The median household income in Rollingwood, TX in 2022 was $238,196, which was 69.7% greater than the median annual income of $72,284 across the entire state of Texas. Compared to the median income of $108,835 in 2000 this represents an increase of 54.3%. The per capita income in 2022 was $127,634, which means an increase of 59.0% compared to 2000 when it was $52,280.
Whole page based on the data from 2000 / 2022 when the population of Rollingwood, Texas was 1,403 / 1,558
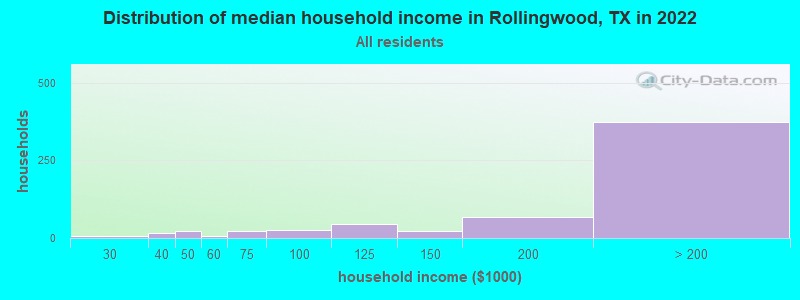
Income statistics for all residents
Median household income in Rollingwood, TX in 2022:
Rollingwood:
$238,196
State:
$72,284
Change in median household income between 2000 and 2022:
Rollingwood, Texas:
+118.9%
State:
+81.0%
Number of households with income < $10k:
Rollingwood:
0.0% (0)
State:
5.5% (611,011)
Number of households with income $10k - 20k:
Rollingwood:
0.3% (2)
State:
6.7% (743,157)
Number of households with income $20k - 30k:
Rollingwood:
1.3% (8)
Texas:
7.2% (803,381)
Number of households with income $30k - 40k:
Rollingwood:
2.6% (16)
State:
7.8% (866,080)
Number of households with income $40k - 50k:
Rollingwood:
3.4% (21)
State:
7.3% (810,440)
Number of households with income $50k - 60k:
Rollingwood:
1.0% (6)
State:
7.2% (799,783)
Number of households with income $60k - 75k:
Rollingwood:
3.4% (21)
State:
9.9% (1,095,384)
Number of households with income $75k - 100k:
Rollingwood:
4.4% (27)
State:
12.8% (1,419,057)
Number of households with income $100k - 125k:
Rollingwood:
7.2% (44)
Texas:
9.5% (1,054,577)
Number of households with income $125k - 150k:
Rollingwood:
3.6% (22)
State:
6.7% (741,518)
Number of households with income $150k - 200k:
Rollingwood:
11.2% (68)
State:
8.7% (961,776)
Number of households with income > $200k:
Rollingwood:
61.4% (374)
State:
10.7% (1,181,544)
Aggregate household income in Rollingwood in 2022: $198,822,753
Median family income in Rollingwood in 2022:
Rollingwood:
$264,420
State:
$86,267
Number of families with income $20k - 30k:
Rollingwood:
1.4% (7)
State:
5.8% (430,949)
Number of families with income $30k - 40k:
Rollingwood:
0.5% (3)
Texas:
6.6% (493,535)
Number of families with income $40k - 50k:
Rollingwood:
0.8% (4)
Texas:
6.7% (499,663)
Number of families with income $50k - 60k:
Rollingwood:
0.4% (2)
State:
6.6% (492,203)
Number of families with income $60k - 75k:
Rollingwood:
1.8% (9)
Texas:
9.5% (710,229)
Number of families with income $75k - 100k:
Rollingwood:
4.9% (24)
State:
13.6% (1,015,480)
Number of families with income $100k - 125k:
Rollingwood:
7.1% (35)
Texas:
10.7% (797,961)
Number of families with income $125k - 150k:
Rollingwood:
3.9% (19)
State:
8.1% (602,985)
Number of families with income $150k - 200k:
Rollingwood:
7.2% (36)
State:
10.7% (804,459)
Number of families with income > $200k:
Rollingwood:
72.1% (353)
State:
13.5% (1,013,514)
Median non-family income in Rollingwood in 2022:
Rollingwood:
$98,243
State:
$45,999
Change in median non-family income between 2000 and 2022:
Rollingwood, Texas:
+123.8%
State:
+79.5%
Median per capita income in Rollingwood in 2022:
Rollingwood:
$127,635
State:
$38,123
Change in median per capita income between 2000 and 2022:
Rollingwood, Texas:
+144.1%
State:
+94.3%
Income statistics for White residents
Median household income in Rollingwood, TX in 2022:
Rollingwood:
$235,653
State:
$82,032
Change in median household income between 2000 and 2022:
Rollingwood, Texas:
+116.7%
Texas:
+91.0%
Number of households with income < $10k:
Rollingwood:
0.0% (0)
State:
4.7% (273,716)
Number of households with income $10k - 20k:
Rollingwood:
0.4% (2)
State:
5.5% (322,702)
Number of households with income $20k - 30k:
Rollingwood:
1.6% (8)
State:
6.2% (363,947)
Number of households with income $30k - 40k:
Rollingwood:
2.0% (10)
State:
6.8% (399,275)
Number of households with income $40k - 50k:
Rollingwood:
2.6% (13)
Texas:
6.5% (383,417)
Number of households with income $50k - 60k:
Rollingwood:
1.0% (5)
State:
6.6% (388,535)
Number of households with income $60k - 75k:
Rollingwood:
3.6% (18)
State:
9.7% (566,295)
Number of households with income $75k - 100k:
Rollingwood:
4.8% (24)
Texas:
13.0% (760,276)
Number of households with income $100k - 125k:
Rollingwood:
7.9% (39)
State:
10.2% (597,596)
Number of households with income $125k - 150k:
Rollingwood:
4.0% (20)
State:
7.4% (436,830)
Number of households with income $150k - 200k:
Rollingwood:
10.3% (51)
Texas:
9.9% (583,067)
Number of households with income > $200k:
Rollingwood:
61.7% (306)
Texas:
13.5% (792,647)
Aggregate household income in Rollingwood in 2022: $158,407,483
Median family income in Rollingwood in 2022:
Rollingwood:
$270,130
State:
$101,788
Number of families with income $20k - 30k:
Rollingwood:
1.4% (5)
Texas:
4.1% (157,688)
Number of families with income $30k - 40k:
Rollingwood:
0.8% (3)
Texas:
5.2% (198,847)
Number of families with income $50k - 60k:
Rollingwood:
0.4% (2)
State:
5.7% (220,689)
Number of families with income $60k - 75k:
Rollingwood:
2.0% (8)
State:
9.0% (346,106)
Number of families with income $75k - 100k:
Rollingwood:
5.1% (20)
Texas:
13.7% (527,363)
Number of families with income $100k - 125k:
Rollingwood:
7.7% (31)
State:
11.6% (448,411)
Number of families with income $125k - 150k:
Rollingwood:
4.2% (17)
State:
9.2% (355,798)
Number of families with income $150k - 200k:
Rollingwood:
6.3% (25)
State:
12.5% (480,185)
Number of families with income > $200k:
Rollingwood:
72.2% (289)
State:
17.6% (677,490)
Median per capita income in Rollingwood in 2022:
Rollingwood:
$133,707
State:
$47,740
Income statistics for Asian residents
Median household income in Rollingwood, TX in 2022:
Rollingwood:
$272,374
State:
$107,673
Change in median household income between 2000 and 2022:
Rollingwood, Texas:
+131.9%
State:
+115.1%
Number of households with income < $10k:
Rollingwood:
0.0% (0)
State:
5.2% (29,885)
Number of households with income $10k - 20k:
Rollingwood:
0.0% (0)
Texas:
4.7% (27,044)
Number of households with income $20k - 30k:
Rollingwood:
0.0% (0)
Texas:
4.1% (23,363)
Number of households with income $30k - 40k:
Rollingwood:
0.0% (0)
State:
4.1% (23,309)
Number of households with income $40k - 50k:
Rollingwood:
26.7% (8)
State:
5.2% (29,826)
Number of households with income $50k - 60k:
Rollingwood:
0.0% (0)
State:
4.7% (26,512)
Number of households with income $60k - 75k:
Rollingwood:
0.0% (0)
State:
6.5% (36,905)
Number of households with income $75k - 100k:
Rollingwood:
0.0% (0)
State:
11.3% (64,350)
Number of households with income $100k - 125k:
Rollingwood:
0.0% (0)
Texas:
11.4% (64,714)
Number of households with income $125k - 150k:
Rollingwood:
0.0% (0)
State:
9.3% (52,719)
Number of households with income $150k - 200k:
Rollingwood:
13.3% (4)
Texas:
12.5% (70,953)
Number of households with income > $200k:
Rollingwood:
60.0% (18)
Texas:
21.1% (120,260)
Aggregate household income in Rollingwood in 2022: $9,757,063
Median family income in Rollingwood in 2022:
Rollingwood:
$259,445
Texas:
$123,328
Number of families with income $40k - 50k:
Rollingwood:
35.2% (8)
State:
4.9% (21,622)
Number of families with income > $200k:
Rollingwood:
64.8% (14)
State:
24.8% (108,511)
Median per capita income in Rollingwood in 2022:
Rollingwood:
$147,960
Texas:
$48,626
Income statistics for Hispanic or Latino residents
Median household income in Rollingwood, TX in 2022:
Rollingwood:
$257,789
Texas:
$60,504
Change in median household income between 2000 and 2022:
Rollingwood, Texas:
+125.8%
Texas:
+102.5%
Number of households with income < $10k:
Rollingwood:
0.0% (0)
State:
5.8% (213,953)
Number of households with income $10k - 20k:
Rollingwood:
0.0% (0)
Texas:
8.0% (297,456)
Number of households with income $20k - 30k:
Rollingwood:
0.0% (0)
State:
9.2% (340,166)
Number of households with income $30k - 40k:
Rollingwood:
0.0% (0)
Texas:
9.5% (354,336)
Number of households with income $40k - 50k:
Rollingwood:
0.0% (0)
Texas:
8.8% (327,013)
Number of households with income $50k - 60k:
Rollingwood:
0.0% (0)
Texas:
8.3% (308,818)
Number of households with income $60k - 75k:
Rollingwood:
0.0% (0)
State:
10.9% (405,109)
Number of households with income $75k - 100k:
Rollingwood:
0.0% (0)
Texas:
13.8% (511,639)
Number of households with income $100k - 125k:
Rollingwood:
0.0% (0)
State:
8.6% (319,728)
Number of households with income $125k - 150k:
Rollingwood:
0.0% (0)
Texas:
5.7% (210,932)
Number of households with income $150k - 200k:
Rollingwood:
0.0% (0)
State:
6.4% (236,055)
Number of households with income > $200k:
Rollingwood:
100.0% (39)
Texas:
5.1% (189,259)
Aggregate household income in Rollingwood in 2022: $21,629,177
Median family income in Rollingwood in 2022:
Rollingwood:
$264,211
State:
$65,080
Number of families with income > $200k:
Rollingwood:
100.0% (38)
Texas:
5.9% (165,129)
Median per capita income in Rollingwood in 2022:
Rollingwood:
$187,142
State:
$24,862
Income statistics for Multirace residents
Median household income in Rollingwood, TX in 2022:
Rollingwood:
$238,314
State:
$62,748
Number of households with income < $10k:
Rollingwood:
0.0% (0)
Texas:
5.5% (122,324)
Number of households with income $10k - 20k:
Rollingwood:
0.0% (0)
Texas:
8.2% (182,232)
Number of households with income $20k - 30k:
Rollingwood:
0.0% (0)
Texas:
8.5% (189,456)
Number of households with income $30k - 40k:
Rollingwood:
0.0% (0)
State:
8.9% (197,499)
Number of households with income $40k - 50k:
Rollingwood:
0.0% (0)
State:
8.7% (191,735)
Number of households with income $50k - 60k:
Rollingwood:
0.0% (0)
Texas:
8.0% (177,535)
Number of households with income $60k - 75k:
Rollingwood:
0.0% (0)
State:
10.5% (232,479)
Number of households with income $75k - 100k:
Rollingwood:
0.0% (0)
State:
13.1% (290,448)
Number of households with income $100k - 125k:
Rollingwood:
0.0% (0)
State:
8.6% (191,595)
Number of households with income $125k - 150k:
Rollingwood:
0.0% (0)
State:
6.0% (133,361)
Number of households with income $150k - 200k:
Rollingwood:
23.4% (11)
State:
7.2% (159,195)
Number of households with income > $200k:
Rollingwood:
76.6% (36)
Texas:
6.7% (148,064)
Aggregate household income in Rollingwood in 2022: $26,268,016
Median family income in Rollingwood in 2022:
Rollingwood:
$234,223
State:
$69,780
Number of families with income $150k - 200k:
Rollingwood:
25.0% (11)
State:
8.5% (137,607)
Number of families with income > $200k:
Rollingwood:
75.0% (34)
State:
7.9% (127,299)
Median per capita income in Rollingwood in 2022:
Rollingwood:
$125,575
State:
$26,785
Discuss Rollingwood, Texas (TX) on our hugely popular Texas forum.