The median household income in Riverton, IL in 2022 was $56,237, which was 36.4% less than the median annual income of $76,708 across the entire state of Illinois. Compared to the median income of $45,531 in 2000 this represents an increase of 19.0%. The per capita income in 2022 was $33,768, which means an increase of 38.8% compared to 2000 when it was $20,678.
Whole page based on the data from 2000 / 2022 when the population of Riverton, Illinois was 3,048 / 3,496
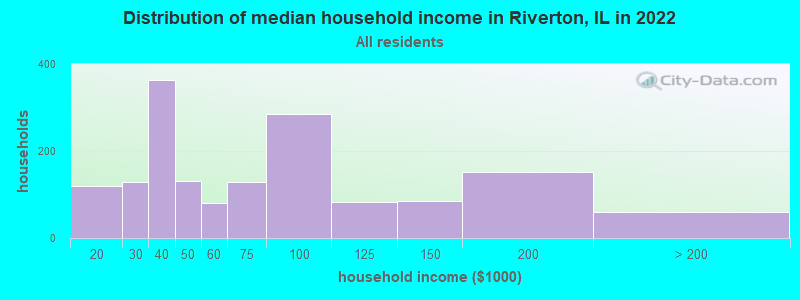
Income statistics for all residents
Median household income in Riverton, IL in 2022:
Riverton:
$56,237
State:
$76,708
Change in median household income between 2000 and 2022:
Riverton, Illinois:
+23.5%
State:
+64.6%
Number of households with income < $10k:
Riverton:
0.0% (0)
State:
5.9% (296,090)
Number of households with income $10k - 20k:
Riverton:
7.4% (119)
State:
6.6% (333,259)
Number of households with income $20k - 30k:
Riverton:
7.9% (128)
State:
6.8% (342,921)
Number of households with income $30k - 40k:
Riverton:
22.5% (364)
State:
7.0% (355,254)
Number of households with income $40k - 50k:
Riverton:
8.1% (131)
Illinois:
6.7% (340,678)
Number of households with income $50k - 60k:
Riverton:
5.0% (80)
Illinois:
6.7% (339,405)
Number of households with income $60k - 75k:
Riverton:
8.0% (129)
State:
9.2% (465,709)
Number of households with income $75k - 100k:
Riverton:
17.6% (285)
Illinois:
12.9% (651,353)
Number of households with income $100k - 125k:
Riverton:
5.1% (83)
Illinois:
10.3% (522,359)
Number of households with income $125k - 150k:
Riverton:
5.3% (86)
Illinois:
7.3% (367,136)
Number of households with income $150k - 200k:
Riverton:
9.3% (151)
State:
9.0% (455,249)
Number of households with income > $200k:
Riverton:
3.7% (59)
Illinois:
11.6% (586,947)
Aggregate household income in Riverton in 2022: $119,639,229
Median family income in Riverton in 2022:
Riverton:
$74,139
State:
$96,948
Number of families with income $10k - 20k:
Riverton:
3.3% (31)
Illinois:
3.3% (105,017)
Number of families with income $20k - 30k:
Riverton:
8.9% (84)
Illinois:
4.7% (146,403)
Number of families with income $30k - 40k:
Riverton:
7.2% (68)
State:
5.3% (167,069)
Number of families with income $40k - 50k:
Riverton:
13.1% (123)
Illinois:
5.8% (181,164)
Number of families with income $50k - 60k:
Riverton:
6.2% (58)
State:
6.1% (191,561)
Number of families with income $60k - 75k:
Riverton:
13.8% (130)
State:
9.0% (282,985)
Number of families with income $75k - 100k:
Riverton:
17.9% (169)
State:
13.8% (432,725)
Number of families with income $100k - 125k:
Riverton:
7.5% (71)
Illinois:
11.9% (373,296)
Number of families with income $125k - 150k:
Riverton:
6.8% (64)
State:
8.9% (279,791)
Number of families with income $150k - 200k:
Riverton:
13.8% (130)
State:
11.9% (372,004)
Number of families with income > $200k:
Riverton:
1.6% (15)
State:
15.9% (500,033)
Median non-family income in Riverton in 2022:
Riverton:
$36,373
State:
$46,533
Change in median non-family income between 2000 and 2022:
Riverton, Illinois:
+38.9%
Illinois:
+64.0%
Median per capita income in Riverton in 2022:
Riverton:
$33,768
State:
$43,317
Change in median per capita income between 2000 and 2022:
Riverton, Illinois:
+63.3%
State:
+87.5%
Income statistics for White residents
Median household income in Riverton, IL in 2022:
Riverton:
$55,732
State:
$83,346
Change in median household income between 2000 and 2022:
Riverton, Illinois:
+21.1%
Illinois:
+67.5%
Number of households with income < $10k:
Riverton:
0.0% (0)
Illinois:
4.5% (149,895)
Number of households with income $10k - 20k:
Riverton:
6.8% (110)
State:
5.5% (184,529)
Number of households with income $20k - 30k:
Riverton:
9.6% (154)
Illinois:
6.1% (205,767)
Number of households with income $30k - 40k:
Riverton:
22.5% (362)
Illinois:
6.7% (225,572)
Number of households with income $40k - 50k:
Riverton:
8.0% (129)
State:
6.5% (216,965)
Number of households with income $50k - 60k:
Riverton:
5.0% (80)
State:
6.6% (222,841)
Number of households with income $60k - 75k:
Riverton:
8.2% (132)
State:
9.3% (312,758)
Number of households with income $75k - 100k:
Riverton:
18.2% (293)
State:
12.9% (433,180)
Number of households with income $100k - 125k:
Riverton:
5.3% (85)
Illinois:
10.7% (360,753)
Number of households with income $125k - 150k:
Riverton:
5.1% (82)
State:
7.9% (266,532)
Number of households with income $150k - 200k:
Riverton:
9.4% (152)
State:
10.0% (337,357)
Number of households with income > $200k:
Riverton:
2.0% (33)
State:
13.3% (446,069)
Aggregate household income in Riverton in 2022: $112,289,815
Median family income in Riverton in 2022:
Riverton:
$71,178
State:
$107,938
Number of families with income $10k - 20k:
Riverton:
3.3% (33)
State:
2.5% (50,574)
Number of families with income $20k - 30k:
Riverton:
11.2% (112)
State:
3.5% (70,927)
Number of families with income $30k - 40k:
Riverton:
8.9% (89)
Illinois:
4.4% (90,563)
Number of families with income $40k - 50k:
Riverton:
11.2% (112)
State:
5.0% (102,597)
Number of families with income $50k - 60k:
Riverton:
5.7% (57)
State:
5.8% (119,129)
Number of families with income $60k - 75k:
Riverton:
14.3% (143)
State:
8.8% (179,665)
Number of families with income $75k - 100k:
Riverton:
17.5% (175)
Illinois:
13.5% (276,887)
Number of families with income $100k - 125k:
Riverton:
7.2% (72)
Illinois:
12.5% (256,099)
Number of families with income $125k - 150k:
Riverton:
5.9% (59)
State:
9.8% (199,855)
Number of families with income $150k - 200k:
Riverton:
13.5% (135)
State:
13.4% (274,569)
Number of families with income > $200k:
Riverton:
1.3% (13)
State:
18.6% (381,354)
Median non-family income in Riverton in 2022:
Riverton:
$38,000
Illinois:
$50,934
Change in median non-family income between 2000 and 2022:
Riverton, Illinois:
+47.6%
State:
+70.7%
Median per capita income in Riverton in 2022:
Riverton:
$32,786
State:
$50,738
Change in median per capita income between 2000 and 2022:
Riverton, Illinois:
+58.1%
State:
+95.5%
Income statistics for Black or African American residents
Median per capita income in Riverton in 2022:
Riverton:
$4,797
State:
$28,045
Change in median per capita income between 2000 and 2022:
Riverton, Illinois:
+91.9%
State:
+90.2%
Income statistics for Asian residents
Number of households with income < $10k:
Riverton:
0.0% (0)
State:
5.3% (14,653)
Number of households with income $10k - 20k:
Riverton:
0.0% (0)
State:
4.5% (12,283)
Number of households with income $20k - 30k:
Riverton:
0.0% (0)
State:
4.8% (13,135)
Number of households with income $30k - 40k:
Riverton:
0.0% (0)
State:
5.0% (13,655)
Number of households with income $40k - 50k:
Riverton:
0.0% (0)
State:
4.5% (12,357)
Number of households with income $50k - 60k:
Riverton:
0.0% (0)
State:
4.9% (13,568)
Number of households with income $60k - 75k:
Riverton:
0.0% (0)
State:
7.1% (19,606)
Number of households with income $75k - 100k:
Riverton:
0.0% (0)
State:
12.1% (33,349)
Number of households with income $100k - 125k:
Riverton:
0.0% (0)
Illinois:
9.7% (26,669)
Number of households with income $125k - 150k:
Riverton:
0.0% (0)
State:
7.3% (20,172)
Number of households with income $150k - 200k:
Riverton:
0.0% (0)
Illinois:
11.5% (31,711)
Number of households with income > $200k:
Riverton:
100.0% (24)
State:
23.1% (63,411)
Median per capita income in Riverton in 2022:
Riverton:
$68,661
State:
$52,977
Change in median per capita income between 2000 and 2022:
Riverton, Illinois:
+119.7%
State:
+119.5%
Discuss Riverton, Illinois (IL) on our hugely popular Illinois forum.