Richland, Wisconsin (WI) income map, earnings map, and wages data
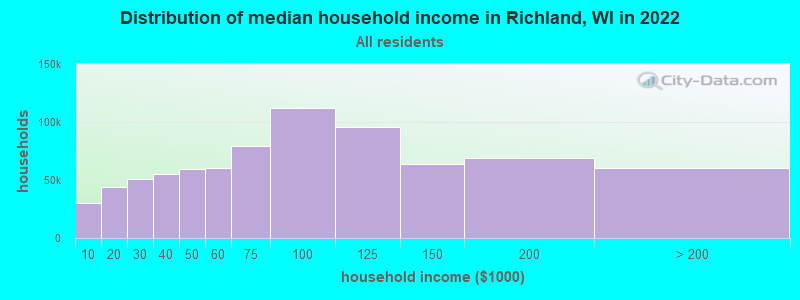
The median household income in Richland, WI in 2022 was $70,466, which was about the same as the median annual income of $70,996 across the entire state of Wisconsin. Compared to the median income of $43,036 in 2000 this represents an increase of 38.9%. The per capita income in 2022 was $41,100, which means an increase of 47.8% compared to 2000 when it was $21,435.
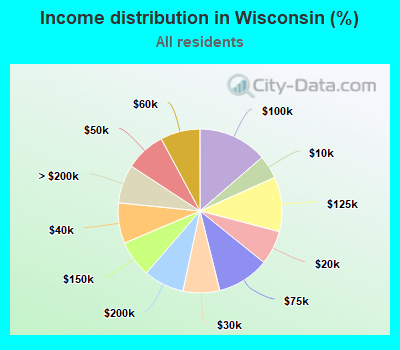
Income statistics for all residents
Median household income in Richland, WI in 2022:| Richland: | $70,466 |
| State: | $70,996 |
Change in median household income between 2000 and 2022:| Richland, Wisconsin: | +63.7% |
| Wisconsin: | +62.1% |
Number of households with income < $10k:| Richland: | 4.6% (56,815) |
| State: | 4.6% (115,058) |
Number of households with income $10k - 20k:| Richland: | 6.8% (82,810) |
| Wisconsin: | 6.7% (167,685) |
Number of households with income $20k - 30k:| Richland: | 7.3% (88,990) |
| State: | 7.2% (180,435) |
Number of households with income $30k - 40k:| Richland: | 8.0% (98,274) |
| State: | 8.0% (199,167) |
Number of households with income $40k - 50k:| Richland: | 7.9% (97,364) |
| Wisconsin: | 7.9% (197,648) |
Number of households with income $50k - 60k:| Richland: | 7.8% (96,151) |
| State: | 7.8% (195,297) |
Number of households with income $60k - 75k:| Richland: | 10.3% (126,339) |
| State: | 10.3% (256,633) |
Number of households with income $75k - 100k:| Richland: | 13.7% (167,379) |
| State: | 13.7% (340,492) |
Number of households with income $100k - 125k:| Richland: | 10.8% (131,908) |
| State: | 10.8% (268,847) |
Number of households with income $125k - 150k:| Richland: | 7.2% (88,793) |
| State: | 7.3% (180,911) |
Number of households with income $150k - 200k:| Richland: | 8.0% (97,861) |
| State: | 8.0% (199,297) |
Number of households with income > $200k:| Richland: | 7.6% (93,302) |
| Wisconsin: | 7.6% (189,651) |
Aggregate household income in Richland in 2022: $1,512,489,776
Median family income in Richland in 2022:| Richland: | $87,473 |
| Wisconsin: | $91,700 |
Median non-family income in Richland in 2022:| Richland: | $41,605 |
| State: | $42,812 |
Change in median non-family income between 2000 and 2022:| Richland, Wisconsin: | +68.3% |
| Wisconsin: | +65.7% |
Median per capita income in Richland in 2022:| Richland: | $41,101 |
| Wisconsin: | $40,188 |
Change in median per capita income between 2000 and 2022:| Richland, Wisconsin: | +91.7% |
| State: | +88.9% |
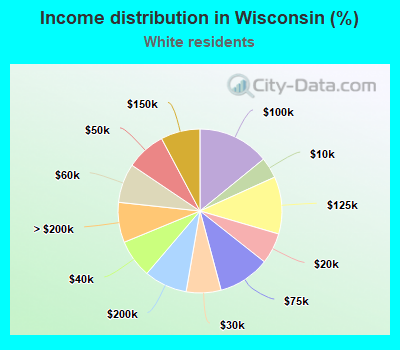
Income statistics for White residents
Median household income in Richland, WI in 2022:| Richland: | $70,958 |
| State: | $74,405 |
Change in median household income between 2000 and 2022:| Richland, Wisconsin: | +65.9% |
| State: | +64.5% |
Number of households with income < $10k:| Richland: | 4.1% (41,353) |
| Wisconsin: | 4.1% (87,410) |
Number of households with income $10k - 20k:| Richland: | 6.1% (61,285) |
| State: | 6.1% (129,511) |
Number of households with income $20k - 30k:| Richland: | 6.9% (68,701) |
| Wisconsin: | 6.9% (145,235) |
Number of households with income $30k - 40k:| Richland: | 7.6% (75,801) |
| Wisconsin: | 7.6% (160,205) |
Number of households with income $40k - 50k:| Richland: | 7.8% (78,343) |
| Wisconsin: | 7.8% (165,627) |
Number of households with income $50k - 60k:| Richland: | 7.7% (77,310) |
| Wisconsin: | 7.7% (163,506) |
Number of households with income $60k - 75k:| Richland: | 10.2% (102,376) |
| State: | 10.2% (216,479) |
Number of households with income $75k - 100k:| Richland: | 14.1% (141,328) |
| State: | 14.1% (298,984) |
Number of households with income $100k - 125k:| Richland: | 11.3% (113,182) |
| Wisconsin: | 11.3% (239,588) |
Number of households with income $125k - 150k:| Richland: | 7.8% (77,733) |
| State: | 7.8% (164,502) |
Number of households with income $150k - 200k:| Richland: | 8.5% (85,093) |
| State: | 8.5% (180,048) |
Number of households with income > $200k:| Richland: | 7.9% (79,449) |
| State: | 7.9% (167,999) |
Aggregate household income in Richland in 2022: $1,316,517,290
Median family income in Richland in 2022:| Richland: | $88,680 |
| Wisconsin: | $96,327 |
Number of families with income < $10k:| Richland: | 2.0% (6) |
| State: | 2.0% (25,684) |
Number of families with income $10k - 20k:| Richland: | 3.0% (9) |
| Wisconsin: | 2.4% (30,426) |
Number of families with income $20k - 30k:| Richland: | 8.1% (25) |
| State: | 3.5% (45,298) |
Number of families with income $30k - 40k:| Richland: | 6.1% (18) |
| State: | 4.9% (62,935) |
Number of families with income $40k - 50k:| Richland: | 7.2% (22) |
| State: | 6.0% (76,575) |
Number of families with income $50k - 60k:| Richland: | 13.9% (42) |
| Wisconsin: | 6.9% (88,079) |
Number of families with income $60k - 75k:| Richland: | 11.1% (33) |
| State: | 10.6% (136,022) |
Number of families with income $75k - 100k:| Richland: | 17.6% (53) |
| Wisconsin: | 16.0% (204,807) |
Number of families with income $100k - 125k:| Richland: | 6.7% (20) |
| Wisconsin: | 14.3% (183,287) |
Number of families with income $125k - 150k:| Richland: | 5.8% (18) |
| State: | 10.2% (131,464) |
Number of families with income $150k - 200k:| Richland: | 8.7% (26) |
| State: | 12.1% (155,060) |
Number of families with income > $200k:| Richland: | 9.8% (29) |
| State: | 11.2% (143,836) |
Median non-family income in Richland in 2022:| Richland: | $42,035 |
| State: | $44,213 |
Change in median non-family income between 2000 and 2022:| Richland, Wisconsin: | +70.0% |
| Wisconsin: | +68.5% |
Median per capita income in Richland in 2022:| Richland: | $42,308 |
| State: | $43,415 |
Change in median per capita income between 2000 and 2022:| Richland, Wisconsin: | +96.6% |
| State: | +94.0% |
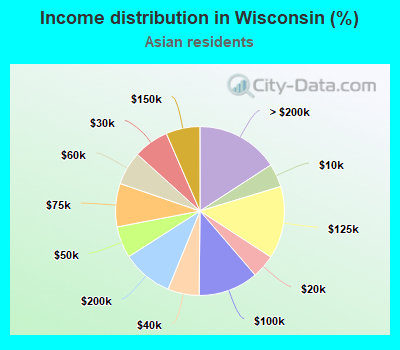
Income statistics for Asian residents
Median household income in Richland, WI in 2022:| Richland: | $198,342 |
| Wisconsin: | $90,784 |
Change in median household income between 2000 and 2022:| Richland, Wisconsin: | +132.0% |
| State: | +127.8% |
Number of households with income < $10k:| Richland: | 4.5% (2,577) |
| State: | 4.5% (2,385) |
Number of households with income $10k - 20k:| Richland: | 4.5% (2,574) |
| State: | 4.5% (2,396) |
Number of households with income $20k - 30k:| Richland: | 6.8% (3,894) |
| State: | 6.8% (3,621) |
Number of households with income $30k - 40k:| Richland: | 6.0% (3,408) |
| Wisconsin: | 6.0% (3,200) |
Number of households with income $40k - 50k:| Richland: | 6.0% (3,438) |
| State: | 6.0% (3,220) |
Number of households with income $50k - 60k:| Richland: | 6.5% (3,670) |
| State: | 6.4% (3,427) |
Number of households with income $60k - 75k:| Richland: | 8.3% (4,746) |
| State: | 8.3% (4,416) |
Number of households with income $75k - 100k:| Richland: | 11.4% (6,506) |
| Wisconsin: | 11.5% (6,114) |
Number of households with income $100k - 125k:| Richland: | 13.9% (7,930) |
| State: | 13.9% (7,397) |
Number of households with income $125k - 150k:| Richland: | 6.5% (3,686) |
| State: | 6.5% (3,469) |
Number of households with income $150k - 200k:| Richland: | 9.8% (5,577) |
| State: | 9.8% (5,204) |
Number of households with income > $200k:| Richland: | 15.6% (8,859) |
| State: | 15.9% (8,450) |
Aggregate household income in Richland in 2022: $1,396,075
Median family income in Richland in 2022:| Richland: | $209,190 |
| State: | $107,809 |
Median per capita income in Richland in 2022:| Richland: | $120,649 |
| Wisconsin: | $40,918 |
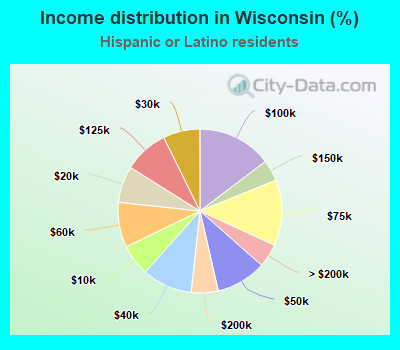
Income statistics for Hispanic or Latino residents
Median household income in Richland, WI in 2022:| Richland: | $136,004 |
| State: | $60,422 |
Change in median household income between 2000 and 2022:| Richland, Wisconsin: | +69.0% |
| State: | +72.7% |
Number of households with income < $10k:| Richland: | 6.2% (9,020) |
| State: | 6.2% (7,841) |
Number of households with income $10k - 20k:| Richland: | 7.2% (10,409) |
| State: | 7.2% (9,100) |
Number of households with income $20k - 30k:| Richland: | 7.3% (10,544) |
| State: | 7.3% (9,213) |
Number of households with income $30k - 40k:| Richland: | 10.0% (14,363) |
| State: | 9.9% (12,505) |
Number of households with income $40k - 50k:| Richland: | 9.9% (14,260) |
| Wisconsin: | 9.9% (12,552) |
Number of households with income $50k - 60k:| Richland: | 8.9% (12,890) |
| Wisconsin: | 8.9% (11,263) |
Number of households with income $60k - 75k:| Richland: | 13.0% (18,719) |
| State: | 13.0% (16,458) |
Number of households with income $75k - 100k:| Richland: | 14.7% (21,252) |
| State: | 14.7% (18,587) |
Number of households with income $100k - 125k:| Richland: | 8.8% (12,695) |
| Wisconsin: | 8.8% (11,136) |
Number of households with income $125k - 150k:| Richland: | 4.1% (5,982) |
| State: | 4.2% (5,292) |
Number of households with income $150k - 200k:| Richland: | 5.3% (7,626) |
| State: | 5.3% (6,737) |
Number of households with income > $200k:| Richland: | 4.6% (6,586) |
| State: | 4.6% (5,851) |
Aggregate household income in Richland in 2022: $540,529
Median family income in Richland in 2022:| Richland: | $134,574 |
| Wisconsin: | $62,574 |
Number of families with income < $10k:| Richland: | 6.6% (1) |
| State: | 7.4% (6,511) |
Number of families with income $10k - 20k:| Richland: | 6.4% (1) |
| State: | 5.3% (4,663) |
Number of families with income $20k - 30k:| Richland: | 14.0% (3) |
| State: | 6.5% (5,706) |
Number of families with income $30k - 40k:| Richland: | 11.6% (2) |
| State: | 10.7% (9,335) |
Number of families with income $40k - 50k:| Richland: | 10.9% (2) |
| State: | 9.6% (8,400) |
Number of families with income $50k - 60k:| Richland: | 12.8% (3) |
| State: | 7.1% (6,250) |
Number of families with income $60k - 75k:| Richland: | 11.0% (2) |
| State: | 12.1% (10,577) |
Number of families with income $75k - 100k:| Richland: | 13.1% (3) |
| State: | 15.1% (13,191) |
Number of families with income $100k - 125k:| Richland: | 3.8% (1) |
| Wisconsin: | 10.4% (9,073) |
Number of families with income $125k - 150k:| Richland: | 2.4% (0) |
| Wisconsin: | 5.1% (4,509) |
Number of families with income $150k - 200k:| Richland: | 3.4% (1) |
| State: | 5.7% (5,013) |
Number of families with income > $200k:| Richland: | 3.9% (1) |
| State: | 5.0% (4,360) |
Median per capita income in Richland in 2022:| Richland: | $18,655 |
| State: | $23,991 |
Change in median per capita income between 2000 and 2022:| Richland, Wisconsin: | +101.2% |
| State: | +108.6% |
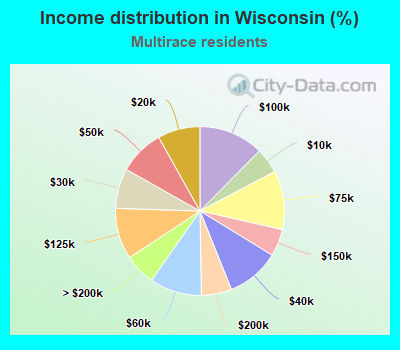
Income statistics for Multirace residents
Median household income in Richland, WI in 2022:| Richland: | $86,626 |
| Wisconsin: | $60,490 |
Change in median household income between 2000 and 2022:| Richland, Wisconsin: | +69.0% |
| Wisconsin: | +69.6% |
Number of households with income < $10k:| Richland: | 4.9% (4,528) |
| State: | 4.8% (6,288) |
Number of households with income $10k - 20k:| Richland: | 8.2% (7,627) |
| State: | 8.1% (10,562) |
Number of households with income $20k - 30k:| Richland: | 7.7% (7,183) |
| State: | 7.7% (9,975) |
Number of households with income $30k - 40k:| Richland: | 10.3% (9,532) |
| Wisconsin: | 10.2% (13,246) |
Number of households with income $40k - 50k:| Richland: | 8.7% (8,096) |
| Wisconsin: | 8.7% (11,305) |
Number of households with income $50k - 60k:| Richland: | 10.0% (9,311) |
| State: | 10.0% (12,968) |
Number of households with income $60k - 75k:| Richland: | 11.2% (10,406) |
| State: | 11.3% (14,655) |
Number of households with income $75k - 100k:| Richland: | 12.5% (11,583) |
| Wisconsin: | 12.4% (16,181) |
Number of households with income $100k - 125k:| Richland: | 9.8% (9,087) |
| State: | 9.8% (12,743) |
Number of households with income $125k - 150k:| Richland: | 5.2% (4,803) |
| Wisconsin: | 5.2% (6,773) |
Number of households with income $150k - 200k:| Richland: | 5.7% (5,308) |
| State: | 5.8% (7,552) |
Number of households with income > $200k:| Richland: | 5.9% (5,522) |
| Wisconsin: | 6.0% (7,788) |
Aggregate household income in Richland in 2022: $891,817
Median family income in Richland in 2022:| Richland: | $84,868 |
| State: | $69,897 |
Median per capita income in Richland in 2022:| Richland: | $6,954 |
| State: | $24,783 |
Change in median per capita income between 2000 and 2022:| Richland, Wisconsin: | +125.9% |
| Wisconsin: | +124.7% |
Income statistics for other residents
Number of households with income < $10k:| Richland: | 7.3% (612) |
| State: | 7.2% (2,622) |
Number of households with income $10k - 20k:| Richland: | 5.9% (498) |
| State: | 5.9% (2,142) |
Number of households with income $20k - 30k:| Richland: | 7.5% (630) |
| State: | 7.5% (2,715) |
Number of households with income $30k - 40k:| Richland: | 11.8% (987) |
| State: | 11.7% (4,249) |
Number of households with income $40k - 50k:| Richland: | 11.3% (951) |
| Wisconsin: | 11.4% (4,111) |
Number of households with income $50k - 60k:| Richland: | 5.9% (495) |
| State: | 5.9% (2,134) |
Number of households with income $60k - 75k:| Richland: | 16.5% (1,387) |
| Wisconsin: | 16.5% (5,962) |
Number of households with income $75k - 100k:| Richland: | 12.5% (1,052) |
| State: | 12.5% (4,527) |
Number of households with income $100k - 125k:| Richland: | 7.0% (592) |
| State: | 7.0% (2,551) |
Number of households with income $125k - 150k:| Richland: | 4.2% (349) |
| State: | 4.2% (1,517) |
Number of households with income $150k - 200k:| Richland: | 6.4% (534) |
| State: | 6.4% (2,318) |
Number of households with income > $200k:| Richland: | 3.7% (313) |
| Wisconsin: | 3.7% (1,344) |
Median per capita income in Richland in 2022:| Richland: | $12,707 |
| State: | $27,766 |