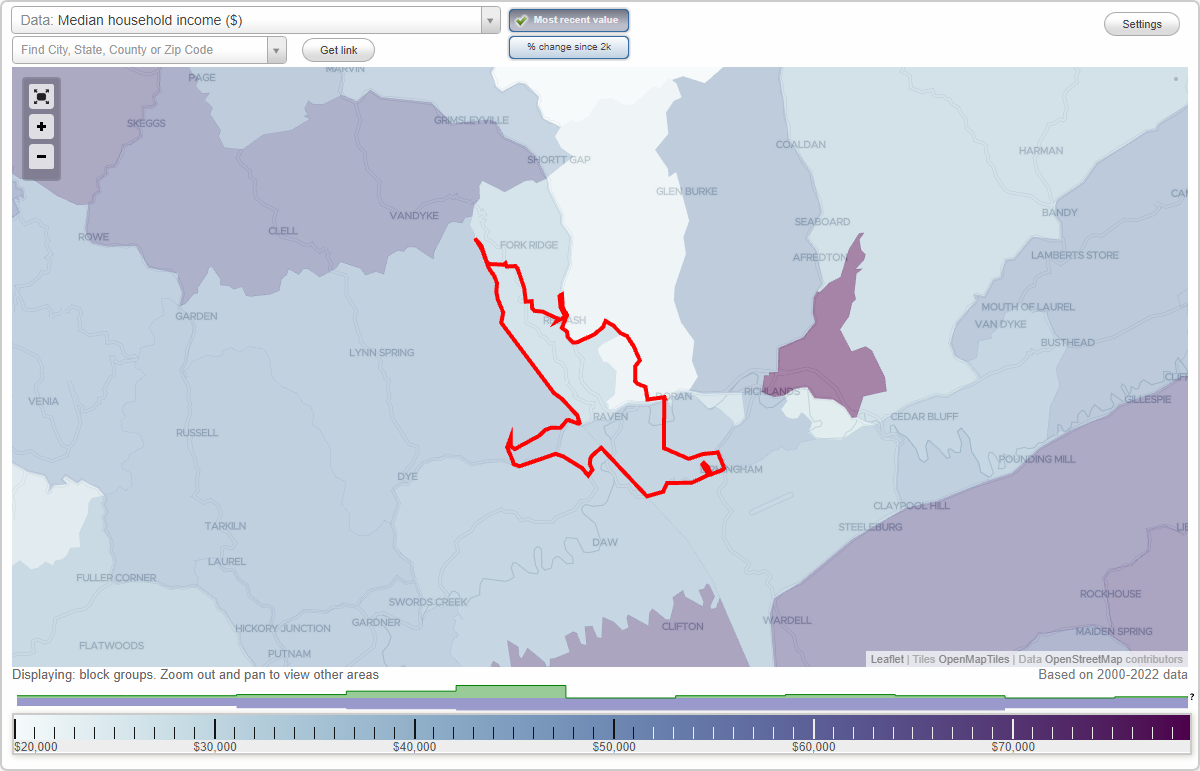
The median household income in Raven, VA in 2022 was $36,035, which was 138.3% less than the median annual income of $85,873 across the entire state of Virginia. Compared to the median income of $19,104 in 2000 this represents an increase of 47.0%. The per capita income in 2022 was $20,118, which means an increase of 48.5% compared to 2000 when it was $10,356.
Whole page based on the data from 2000 / 2022 when the population of Raven, Virginia was 2,593 / 2,079
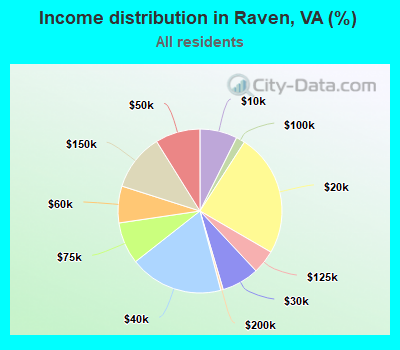
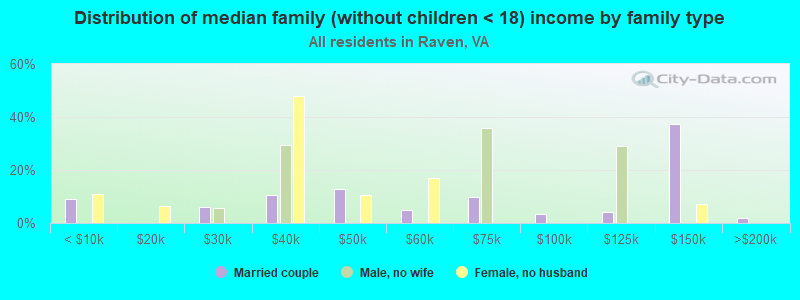
Income statistics for all residents
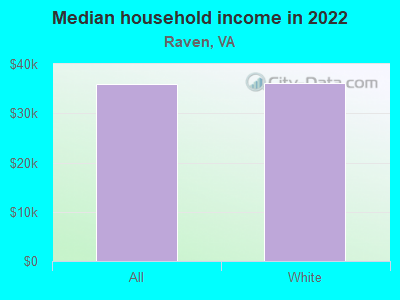
Median household income in Raven, VA in 2022:
Raven:
$36,036
State:
$85,873
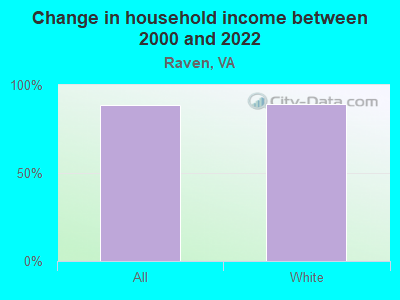
Change in median household income between 2000 and 2022:
Raven, Virginia:
+88.6%
State:
+84.0%
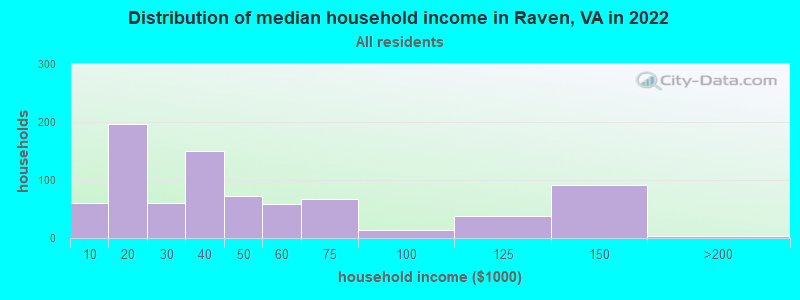
Number of households with income < $10k:
Raven:
7.4% (60)
State:
4.9% (165,315)
Number of households with income $10k - 20k:
Raven:
24.3% (197)
State:
5.9% (199,380)
Number of households with income $20k - 30k:
Raven:
7.4% (60)
Virginia:
6.0% (202,243)
Number of households with income $30k - 40k:
Raven:
18.5% (150)
Virginia:
6.1% (205,967)
Number of households with income $40k - 50k:
Raven:
8.9% (72)
Virginia:
6.4% (215,648)
Number of households with income $50k - 60k:
Raven:
7.3% (59)
State:
6.2% (210,516)
Number of households with income $60k - 75k:
Raven:
8.3% (67)
State:
8.6% (292,112)
Number of households with income $75k - 100k:
Raven:
1.7% (14)
State:
12.2% (412,198)
Number of households with income $100k - 125k:
Raven:
4.7% (38)
State:
10.3% (348,998)
Number of households with income $125k - 150k:
Raven:
11.2% (91)
Virginia:
7.7% (261,236)
Number of households with income $150k - 200k:
Raven:
0.5% (4)
State:
10.3% (347,282)
Number of households with income > $200k:
Raven:
0.0% (0)
State:
15.4% (519,712)
Aggregate household income in Raven in 2022: $39,660,436
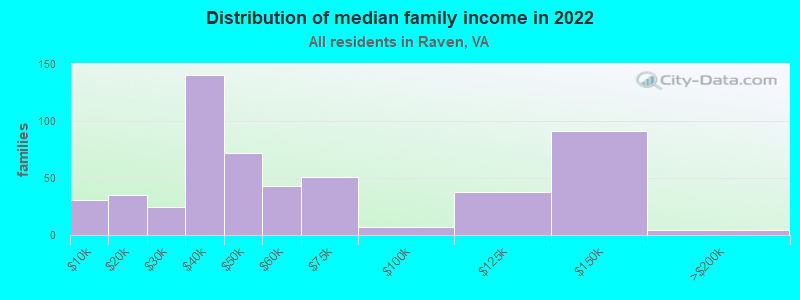
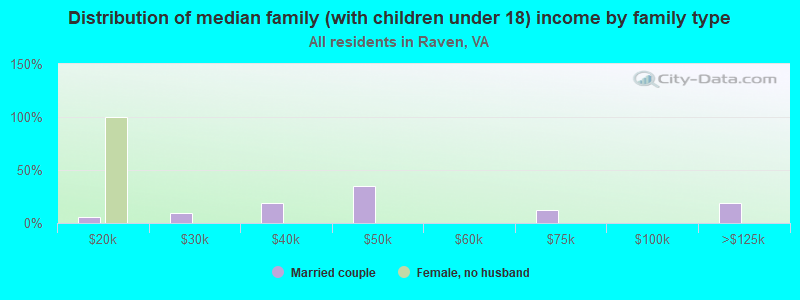
Median family income in Raven in 2022:
Raven:
$44,909
State:
$107,101
Number of families with income < $10k:
Raven:
5.8% (31)
State:
2.8% (61,637)
Number of families with income $10k - 20k:
Raven:
6.5% (35)
Virginia:
3.3% (71,807)
Number of families with income $20k - 30k:
Raven:
4.6% (25)
State:
4.0% (87,860)
Number of families with income $30k - 40k:
Raven:
26.1% (140)
State:
4.7% (103,002)
Number of families with income $40k - 50k:
Raven:
13.4% (72)
Virginia:
5.4% (118,579)
Number of families with income $50k - 60k:
Raven:
8.0% (43)
State:
5.5% (120,924)
Number of families with income $60k - 75k:
Raven:
9.5% (51)
State:
8.2% (180,564)
Number of families with income $75k - 100k:
Raven:
1.3% (7)
Virginia:
12.6% (277,221)
Number of families with income $100k - 125k:
Raven:
7.1% (38)
State:
11.3% (248,485)
Number of families with income $125k - 150k:
Raven:
16.9% (91)
State:
9.0% (197,999)
Number of families with income $150k - 200k:
Raven:
0.8% (4)
State:
12.7% (278,323)
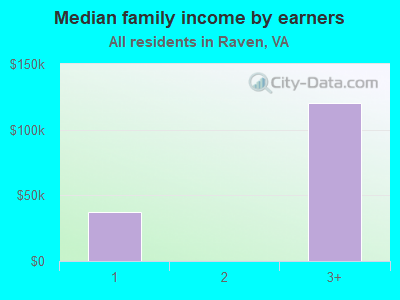
Median income for 4 person families:
Raven:
$40,475
State:
$134,145
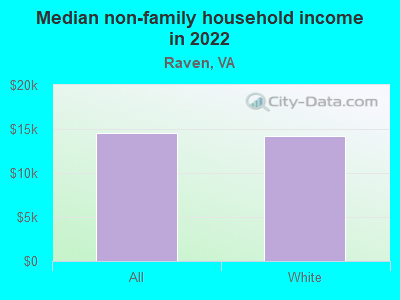
Median non-family income in Raven in 2022:
Raven:
$14,506
State:
$51,436
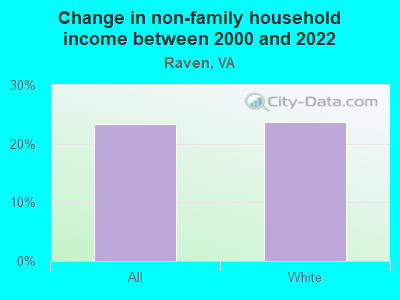
Change in median non-family income between 2000 and 2022:
Raven, Virginia:
+23.3%
Virginia:
+73.5%
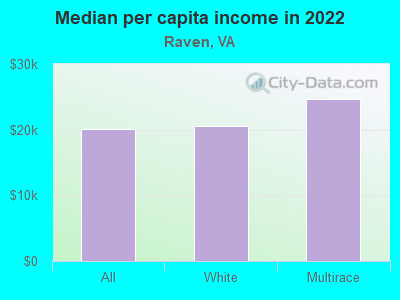
Median per capita income in Raven in 2022:
Raven:
$20,118
State:
$47,199
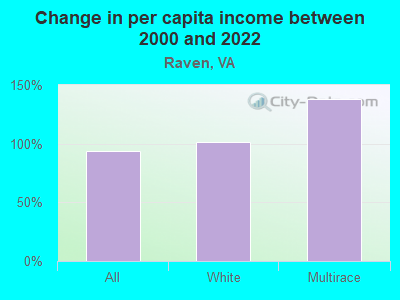
Change in median per capita income between 2000 and 2022:
Raven, Virginia:
+94.3%
Virginia:
+96.9%
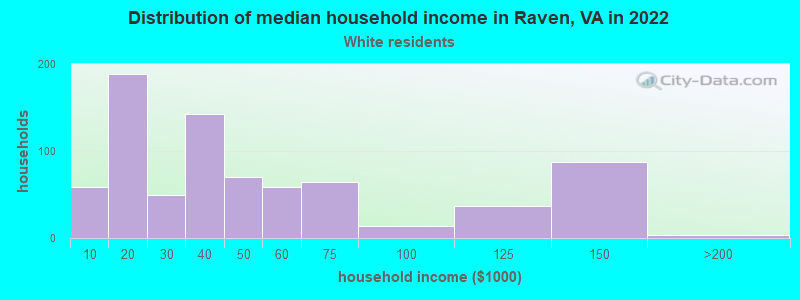
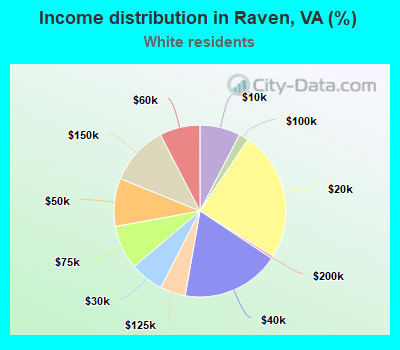
Income statistics for White residents
Median household income in Raven, VA in 2022:
Raven:
$36,054
State:
$91,924
Change in median household income between 2000 and 2022:
Raven, Virginia:
+88.9%
State:
+81.9%
Number of households with income < $10k:
Raven:
7.6% (59)
State:
4.1% (90,549)
Number of households with income $10k - 20k:
Raven:
24.4% (189)
State:
5.2% (114,324)
Number of households with income $20k - 30k:
Raven:
6.3% (49)
State:
5.7% (125,676)
Number of households with income $30k - 40k:
Raven:
18.5% (143)
Virginia:
5.5% (121,220)
Number of households with income $40k - 50k:
Raven:
9.0% (70)
Virginia:
6.0% (133,011)
Number of households with income $50k - 60k:
Raven:
7.6% (59)
State:
6.2% (136,856)
Number of households with income $60k - 75k:
Raven:
8.3% (64)
State:
8.4% (186,094)
Number of households with income $75k - 100k:
Raven:
1.8% (14)
State:
12.5% (277,077)
Number of households with income $100k - 125k:
Raven:
4.8% (37)
Virginia:
10.8% (237,562)
Number of households with income $125k - 150k:
Raven:
11.2% (87)
Virginia:
8.0% (177,532)
Number of households with income $150k - 200k:
Raven:
0.5% (4)
State:
11.0% (242,106)
Number of households with income > $200k:
Raven:
0.0% (0)
State:
16.6% (366,064)
Aggregate household income in Raven in 2022: $37,778,259
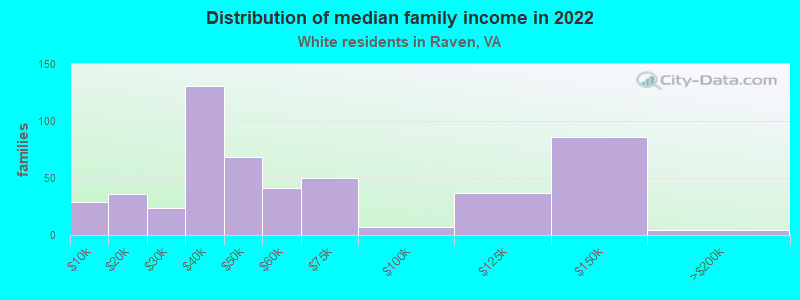
Median family income in Raven in 2022:
Raven:
$44,546
State:
$114,708
Number of families with income < $10k:
Raven:
5.6% (29)
State:
1.9% (27,415)
Number of families with income $10k - 20k:
Raven:
6.9% (36)
State:
2.5% (35,529)
Number of families with income $20k - 30k:
Raven:
4.8% (24)
State:
3.5% (49,027)
Number of families with income $30k - 40k:
Raven:
25.5% (131)
State:
3.8% (53,514)
Number of families with income $40k - 50k:
Raven:
13.3% (68)
Virginia:
4.7% (66,206)
Number of families with income $50k - 60k:
Raven:
8.1% (41)
State:
5.2% (74,438)
Number of families with income $60k - 75k:
Raven:
9.7% (50)
State:
8.2% (116,265)
Number of families with income $75k - 100k:
Raven:
1.4% (7)
Virginia:
12.9% (183,581)
Number of families with income $100k - 125k:
Raven:
7.2% (37)
State:
11.9% (168,950)
Number of families with income $125k - 150k:
Raven:
16.8% (86)
Virginia:
9.5% (134,452)
Number of families with income $150k - 200k:
Raven:
0.8% (4)
Virginia:
13.8% (195,800)
Median non-family income in Raven in 2022:
Raven:
$14,182
Virginia:
$53,785
Change in median non-family income between 2000 and 2022:
Raven, Virginia:
+23.7%
Virginia:
+70.5%
Median per capita income in Raven in 2022:
Raven:
$20,551
State:
$53,456
Change in median per capita income between 2000 and 2022:
Raven, Virginia:
+101.5%
State:
+99.2%
Income statistics for Multirace residents
Aggregate household income in Raven in 2022: $903,374
Median per capita income in Raven in 2022:
Raven:
$24,610
State:
$34,385
Change in median per capita income between 2000 and 2022:
Raven, Virginia:
+137.8%
State:
+130.2%
Discuss Raven, Virginia (VA) on our hugely popular Virginia forum.