Queenland, Maryland (MD) income map, earnings map, and wages data
The median household income in Queenland, MD in 2022 was $173,187, which was 45.2% greater than the median annual income of $94,991 across the entire state of Maryland. Compared to the median income of $55,256 in 2000 this represents an increase of 68.1%. The per capita income in 2022 was $64,087, which means an increase of 63.6% compared to 2000 when it was $23,360.
Whole page based on the data from 2000 / 2022 when the population of Queenland, Maryland was 1,929 / 2,064
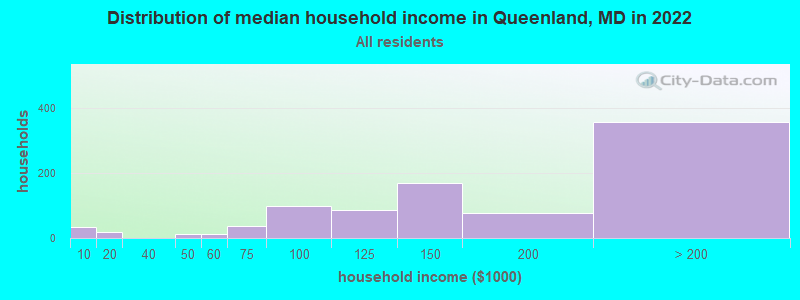
Income statistics for all residents
Median household income in Queenland, MD in 2022:| Queenland: | $173,187 |
| State: | $94,991 |
Number of households with income < $10k:| Queenland: | 3.8% (34) |
| State: | 4.8% (114,450) |
Number of households with income $10k - 20k:| Queenland: | 1.9% (17) |
| State: | 5.0% (117,883) |
Number of households with income $20k - 30k:| Queenland: | 0.0% (0) |
| State: | 5.2% (123,350) |
Number of households with income $30k - 40k:| Queenland: | 0.0% (0) |
| State: | 5.6% (134,104) |
Number of households with income $40k - 50k:| Queenland: | 1.3% (12) |
| Maryland: | 5.6% (132,932) |
Number of households with income $50k - 60k:| Queenland: | 1.2% (11) |
| State: | 5.6% (132,707) |
Number of households with income $60k - 75k:| Queenland: | 4.2% (38) |
| State: | 7.9% (188,335) |
Number of households with income $75k - 100k:| Queenland: | 11.1% (100) |
| Maryland: | 12.5% (297,873) |
Number of households with income $100k - 125k:| Queenland: | 9.6% (87) |
| Maryland: | 10.5% (250,497) |
Number of households with income $125k - 150k:| Queenland: | 18.8% (170) |
| State: | 8.1% (193,208) |
Number of households with income $150k - 200k:| Queenland: | 8.6% (78) |
| State: | 11.6% (274,905) |
Number of households with income > $200k:| Queenland: | 39.5% (357) |
| State: | 17.5% (415,740) |
Aggregate household income in Queenland in 2022: $132,274,511
Median family income in Queenland in 2022:| Queenland: | $175,715 |
| State: | $117,294 |
Number of families with income < $10k:| Queenland: | 0.7% (6) |
| State: | 2.7% (41,433) |
Number of families with income $10k - 20k:| Queenland: | 0.8% (6) |
| Maryland: | 2.6% (40,126) |
Number of families with income $40k - 50k:| Queenland: | 1.5% (12) |
| State: | 4.8% (74,112) |
Number of families with income $50k - 60k:| Queenland: | 0.7% (6) |
| Maryland: | 5.0% (77,590) |
Number of families with income $60k - 75k:| Queenland: | 4.2% (33) |
| State: | 7.1% (109,924) |
Number of families with income $75k - 100k:| Queenland: | 11.3% (87) |
| Maryland: | 12.0% (185,255) |
Number of families with income $100k - 125k:| Queenland: | 8.6% (66) |
| State: | 11.2% (173,203) |
Number of families with income $125k - 150k:| Queenland: | 19.4% (150) |
| State: | 9.3% (143,453) |
Number of families with income $150k - 200k:| Queenland: | 11.5% (89) |
| State: | 14.2% (218,861) |
Number of families with income > $200k:| Queenland: | 41.3% (320) |
| State: | 23.2% (359,182) |
Median non-family income in Queenland in 2022:| Queenland: | $16,919 |
| Maryland: | $57,179 |
Median per capita income in Queenland in 2022:| Queenland: | $64,088 |
| Maryland: | $49,236 |
Income statistics for White residents
Median household income in Queenland, MD in 2022:| Queenland: | $189,207 |
| State: | $107,160 |
Number of households with income < $10k:| Queenland: | 0.0% (0) |
| Maryland: | 3.7% (47,387) |
Number of households with income $10k - 20k:| Queenland: | 3.1% (7) |
| State: | 4.1% (52,102) |
Number of households with income $20k - 30k:| Queenland: | 0.0% (0) |
| State: | 4.6% (58,758) |
Number of households with income $30k - 40k:| Queenland: | 0.0% (0) |
| State: | 4.7% (59,745) |
Number of households with income $40k - 50k:| Queenland: | 0.0% (0) |
| Maryland: | 5.0% (62,576) |
Number of households with income $50k - 60k:| Queenland: | 0.0% (0) |
| State: | 5.1% (64,484) |
Number of households with income $60k - 75k:| Queenland: | 1.8% (4) |
| State: | 7.7% (97,019) |
Number of households with income $75k - 100k:| Queenland: | 3.9% (9) |
| State: | 11.8% (149,205) |
Number of households with income $100k - 125k:| Queenland: | 16.7% (38) |
| Maryland: | 10.6% (134,231) |
Number of households with income $125k - 150k:| Queenland: | 13.2% (30) |
| Maryland: | 8.8% (111,081) |
Number of households with income $150k - 200k:| Queenland: | 21.5% (49) |
| State: | 12.9% (162,966) |
Number of households with income > $200k:| Queenland: | 39.9% (91) |
| State: | 20.9% (264,377) |
Aggregate household income in Queenland in 2022: $39,222,407
Median family income in Queenland in 2022:| Queenland: | $228,597 |
| State: | $134,708 |
Number of families with income $60k - 75k:| Queenland: | 2.1% (4) |
| State: | 6.6% (53,501) |
Number of families with income $75k - 100k:| Queenland: | 4.1% (8) |
| State: | 11.3% (91,779) |
Number of families with income $100k - 125k:| Queenland: | 15.9% (33) |
| State: | 11.3% (91,483) |
Number of families with income $125k - 150k:| Queenland: | 13.4% (27) |
| State: | 9.9% (80,832) |
Number of families with income $150k - 200k:| Queenland: | 22.3% (46) |
| Maryland: | 16.0% (130,295) |
Number of families with income > $200k:| Queenland: | 42.2% (87) |
| State: | 28.1% (228,324) |
Median non-family income in Queenland in 2022:| Queenland: | $168,109 |
| Maryland: | $61,991 |
Median per capita income in Queenland in 2022:| Queenland: | $101,632 |
| State: | $59,750 |
Income statistics for Black or African American residents
Median household income in Queenland, MD in 2022:| Queenland: | $177,609 |
| State: | $77,368 |
Number of households with income < $10k:| Queenland: | 4.3% (32) |
| State: | 7.0% (50,093) |
Number of households with income $10k - 20k:| Queenland: | 1.2% (9) |
| State: | 7.2% (51,849) |
Number of households with income $20k - 30k:| Queenland: | 0.0% (0) |
| Maryland: | 5.8% (41,510) |
Number of households with income $30k - 40k:| Queenland: | 0.0% (0) |
| State: | 6.9% (49,466) |
Number of households with income $40k - 50k:| Queenland: | 0.0% (0) |
| State: | 6.6% (47,557) |
Number of households with income $50k - 60k:| Queenland: | 1.5% (11) |
| Maryland: | 6.2% (44,818) |
Number of households with income $60k - 75k:| Queenland: | 5.1% (38) |
| State: | 8.6% (61,728) |
Number of households with income $75k - 100k:| Queenland: | 10.9% (82) |
| Maryland: | 13.2% (95,107) |
Number of households with income $100k - 125k:| Queenland: | 5.5% (41) |
| Maryland: | 10.2% (73,579) |
Number of households with income $125k - 150k:| Queenland: | 22.1% (166) |
| State: | 7.2% (51,970) |
Number of households with income $150k - 200k:| Queenland: | 3.7% (28) |
| State: | 9.4% (67,623) |
Number of households with income > $200k:| Queenland: | 45.7% (343) |
| State: | 11.7% (83,862) |
Aggregate household income in Queenland in 2022: $87,752,621
Median family income in Queenland in 2022:| Queenland: | $187,728 |
| State: | $96,241 |
Number of families with income < $10k:| Queenland: | 0.8% (5) |
| State: | 4.5% (19,574) |
Number of families with income $10k - 20k:| Queenland: | 0.9% (6) |
| Maryland: | 3.8% (16,604) |
Number of families with income $50k - 60k:| Queenland: | 1.0% (6) |
| State: | 5.9% (25,636) |
Number of families with income $60k - 75k:| Queenland: | 4.8% (31) |
| State: | 8.0% (35,163) |
Number of families with income $75k - 100k:| Queenland: | 11.0% (70) |
| Maryland: | 12.8% (55,976) |
Number of families with income $100k - 125k:| Queenland: | 4.6% (29) |
| State: | 11.4% (49,778) |
Number of families with income $125k - 150k:| Queenland: | 23.0% (146) |
| Maryland: | 8.8% (38,547) |
Number of families with income $150k - 200k:| Queenland: | 7.2% (45) |
| Maryland: | 11.8% (51,381) |
Number of families with income > $200k:| Queenland: | 46.7% (296) |
| Maryland: | 16.5% (71,997) |
Median non-family income in Queenland in 2022:| Queenland: | $3,166 |
| State: | $49,944 |
Median per capita income in Queenland in 2022:| Queenland: | $58,305 |
| Maryland: | $40,756 |
Income statistics for Asian residents
Median household income in Queenland, MD in 2022:| Queenland: | $94,411 |
| State: | $117,771 |
Change in median household income between 2000 and 2022:| Queenland, Maryland: | +74.2% |
| State: | +97.6% |
Number of households with income < $10k:| Queenland: | 0.0% (0) |
| Maryland: | 4.6% (6,395) |
Number of households with income $10k - 20k:| Queenland: | 0.0% (0) |
| State: | 3.6% (4,994) |
Number of households with income $20k - 30k:| Queenland: | 0.0% (0) |
| State: | 4.6% (6,399) |
Number of households with income $30k - 40k:| Queenland: | 0.0% (0) |
| State: | 3.4% (4,682) |
Number of households with income $40k - 50k:| Queenland: | 0.0% (0) |
| State: | 4.6% (6,382) |
Number of households with income $50k - 60k:| Queenland: | 0.0% (0) |
| State: | 4.6% (6,402) |
Number of households with income $60k - 75k:| Queenland: | 0.0% (0) |
| State: | 5.4% (7,426) |
Number of households with income $75k - 100k:| Queenland: | 100.0% (19) |
| State: | 11.1% (15,313) |
Number of households with income $100k - 125k:| Queenland: | 0.0% (0) |
| State: | 10.6% (14,640) |
Number of households with income $125k - 150k:| Queenland: | 0.0% (0) |
| Maryland: | 8.3% (11,465) |
Number of households with income $150k - 200k:| Queenland: | 0.0% (0) |
| Maryland: | 13.4% (18,490) |
Number of households with income > $200k:| Queenland: | 0.0% (0) |
| State: | 25.6% (35,377) |
Aggregate household income in Queenland in 2022: $1,343,928,200
Median family income in Queenland in 2022:| Queenland: | $110,964 |
| State: | $137,857 |
Number of families with income $75k - 100k:| Queenland: | 100.0% (17) |
| State: | 10.9% (11,658) |
Median non-family income in Queenland in 2022:| Queenland: | $39,171 |
| State: | $62,510 |
Change in median non-family income between 2000 and 2022:| Queenland, Maryland: | +29.2% |
| State: | +83.8% |
Median per capita income in Queenland in 2022:| Queenland: | $38,981 |
| State: | $53,546 |
Change in median per capita income between 2000 and 2022:| Queenland, Maryland: | +97.1% |
| State: | +122.9% |
Income statistics for Hispanic or Latino residents
Median household income in Queenland, MD in 2022:| Queenland: | $79,227 |
| State: | $82,138 |
Change in median household income between 2000 and 2022:| Queenland, Maryland: | +75.3% |
| State: | +70.2% |
Number of households with income < $10k:| Queenland: | 0.0% (0) |
| State: | 3.7% (6,871) |
Number of households with income $10k - 20k:| Queenland: | 0.0% (0) |
| State: | 2.9% (5,465) |
Number of households with income $20k - 30k:| Queenland: | 0.0% (0) |
| State: | 5.9% (11,012) |
Number of households with income $30k - 40k:| Queenland: | 0.0% (0) |
| State: | 7.9% (14,668) |
Number of households with income $40k - 50k:| Queenland: | 0.0% (0) |
| State: | 7.6% (14,074) |
Number of households with income $50k - 60k:| Queenland: | 0.0% (0) |
| Maryland: | 7.6% (14,166) |
Number of households with income $60k - 75k:| Queenland: | 0.0% (0) |
| State: | 9.9% (18,486) |
Number of households with income $75k - 100k:| Queenland: | 100.0% (20) |
| State: | 16.1% (30,032) |
Number of households with income $100k - 125k:| Queenland: | 0.0% (0) |
| State: | 9.4% (17,432) |
Number of households with income $125k - 150k:| Queenland: | 0.0% (0) |
| Maryland: | 7.5% (13,963) |
Number of households with income $150k - 200k:| Queenland: | 0.0% (0) |
| Maryland: | 10.1% (18,750) |
Number of households with income > $200k:| Queenland: | 0.0% (0) |
| State: | 11.4% (21,133) |
Aggregate household income in Queenland in 2022: $4,672,126,900
Median family income in Queenland in 2022:| Queenland: | $75,176 |
| Maryland: | $80,127 |
Number of families with income $75k - 100k:| Queenland: | 100.0% (19) |
| State: | 14.6% (21,440) |
Median non-family income in Queenland in 2022:| Queenland: | $49,806 |
| State: | $55,347 |
Change in median non-family income between 2000 and 2022:| Queenland, Maryland: | +41.2% |
| Maryland: | +61.9% |
Median per capita income in Queenland in 2022:| Queenland: | $38,935 |
| Maryland: | $29,024 |
Income statistics for American Indian and Alaska Native residents
Median household income in Queenland, MD in 2022:| Queenland: | $117,583 |
| State: | $71,440 |
Aggregate household income in Queenland in 2022: $202,100,400
Median family income in Queenland in 2022:| Queenland: | $73,457 |
| Maryland: | $83,298 |
Median non-family income in Queenland in 2022:| Queenland: | $52,974 |
| Maryland: | $53,034 |
Change in median non-family income between 2000 and 2022:| Queenland, Maryland: | +67.5% |
| State: | +67.5% |
Median per capita income in Queenland in 2022:| Queenland: | $36,587 |
| Maryland: | $35,089 |
Change in median per capita income between 2000 and 2022:| Queenland, Maryland: | +72.2% |
| State: | +56.2% |
Income statistics for Multirace residents
Median household income in Queenland, MD in 2022:| Queenland: | $174,610 |
| Maryland: | $99,027 |
Number of households with income < $10k:| Queenland: | 0.0% (0) |
| Maryland: | 4.8% (6,469) |
Number of households with income $10k - 20k:| Queenland: | 0.0% (0) |
| Maryland: | 3.3% (4,464) |
Number of households with income $20k - 30k:| Queenland: | 0.0% (0) |
| State: | 5.8% (7,826) |
Number of households with income $30k - 40k:| Queenland: | 0.0% (0) |
| State: | 8.1% (11,077) |
Number of households with income $40k - 50k:| Queenland: | 56.1% (23) |
| Maryland: | 4.3% (5,895) |
Number of households with income $50k - 60k:| Queenland: | 0.0% (0) |
| Maryland: | 3.9% (5,346) |
Number of households with income $60k - 75k:| Queenland: | 0.0% (0) |
| Maryland: | 6.7% (9,159) |
Number of households with income $75k - 100k:| Queenland: | 0.0% (0) |
| State: | 13.6% (18,420) |
Number of households with income $100k - 125k:| Queenland: | 43.9% (18) |
| Maryland: | 12.9% (17,488) |
Number of households with income $125k - 150k:| Queenland: | 0.0% (0) |
| State: | 8.1% (11,039) |
Number of households with income $150k - 200k:| Queenland: | 0.0% (0) |
| Maryland: | 11.5% (15,675) |
Number of households with income > $200k:| Queenland: | 0.0% (0) |
| State: | 17.0% (23,059) |
Aggregate household income in Queenland in 2022: $2,169,585,300
Median family income in Queenland in 2022:| Queenland: | $103,409 |
| State: | $110,784 |
Number of families with income $40k - 50k:| Queenland: | 100.0% (21) |
| State: | 3.6% (3,426) |
Median non-family income in Queenland in 2022:| Queenland: | $56,424 |
| State: | $60,702 |
Change in median non-family income between 2000 and 2022:| Queenland, Maryland: | +59.7% |
| State: | +98.2% |
Median per capita income in Queenland in 2022:| Queenland: | $83,488 |
| Maryland: | $35,630 |
Income statistics for other residents
Aggregate household income in Queenland in 2022: $3,275,444,400
Median family income in Queenland in 2022:| Queenland: | $69,551 |
| State: | $69,179 |
Median non-family income in Queenland in 2022:| Queenland: | $52,828 |
| State: | $52,100 |
Change in median non-family income between 2000 and 2022:| Queenland, Maryland: | +73.0% |
| Maryland: | +64.2% |
Median per capita income in Queenland in 2022:| Queenland: | $21,907 |
| Maryland: | $24,415 |
Change in median per capita income between 2000 and 2022:| Queenland, Maryland: | +69.1% |
| State: | +73.6% |