Putnam Valley, New York (NY) income map, earnings map, and wages data
The median household income in Putnam Valley, NY in 2022 was $112,114, which was 29.0% greater than the median annual income of $79,557 across the entire state of New York. Compared to the median income of $72,938 in 2000 this represents an increase of 34.9%. The per capita income in 2022 was $56,070, which means an increase of 44.3% compared to 2000 when it was $31,215.
Income statistics for all residents
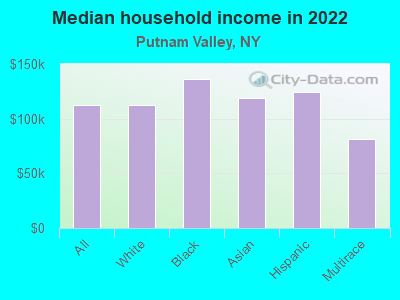
Median household income in Putnam Valley, NY in 2022:| Putnam Valley: | $112,115 |
| State: | $79,557 |
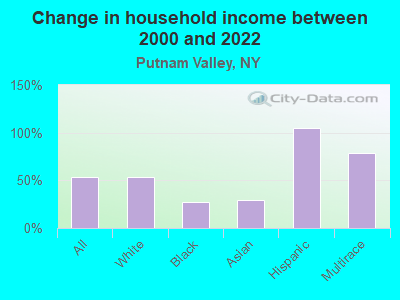
Change in median household income between 2000 and 2022:| Putnam Valley, New York: | +53.7% |
| State: | +83.3% |
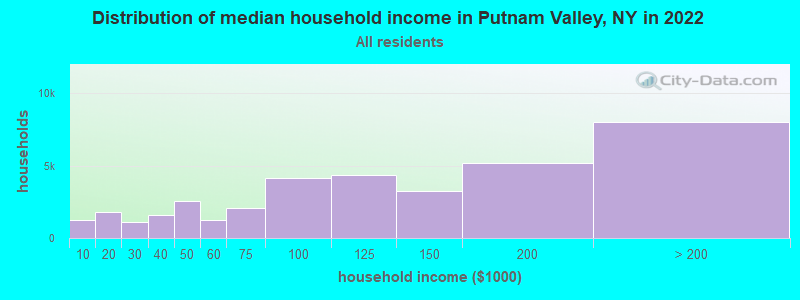
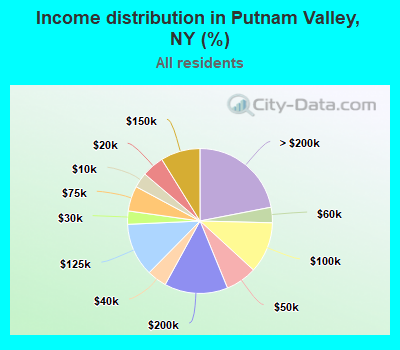
Number of households with income < $10k:| Putnam Valley: | 3.4% (1,230) |
| New York: | 6.8% (527,598) |
Number of households with income $10k - 20k:| Putnam Valley: | 5.0% (1,805) |
| State: | 7.4% (574,940) |
Number of households with income $20k - 30k:| Putnam Valley: | 2.9% (1,074) |
| State: | 6.7% (517,718) |
Number of households with income $30k - 40k:| Putnam Valley: | 4.4% (1,603) |
| State: | 6.5% (506,674) |
Number of households with income $40k - 50k:| Putnam Valley: | 7.0% (2,546) |
| State: | 6.1% (470,439) |
Number of households with income $50k - 60k:| Putnam Valley: | 3.5% (1,258) |
| State: | 5.8% (454,042) |
Number of households with income $60k - 75k:| Putnam Valley: | 5.6% (2,049) |
| State: | 8.5% (657,508) |
Number of households with income $75k - 100k:| Putnam Valley: | 11.4% (4,156) |
| State: | 11.6% (899,824) |
Number of households with income $100k - 125k:| Putnam Valley: | 11.9% (4,336) |
| State: | 9.3% (723,825) |
Number of households with income $125k - 150k:| Putnam Valley: | 8.8% (3,212) |
| State: | 7.1% (552,420) |
Number of households with income $150k - 200k:| Putnam Valley: | 14.2% (5,165) |
| State: | 9.4% (727,051) |
Number of households with income > $200k:| Putnam Valley: | 22.0% (8,000) |
| State: | 15.0% (1,162,269) |
Aggregate household income in Putnam Valley in 2022: $797,672,134
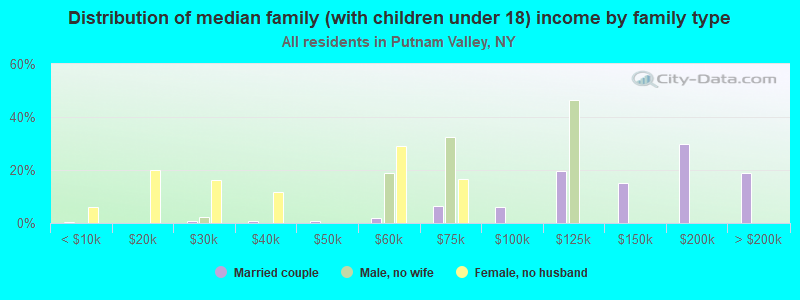
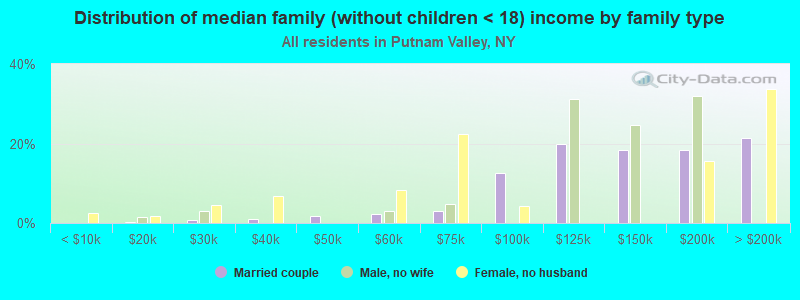
Median family income in Putnam Valley in 2022:| Putnam Valley: | $136,656 |
| New York: | $99,066 |
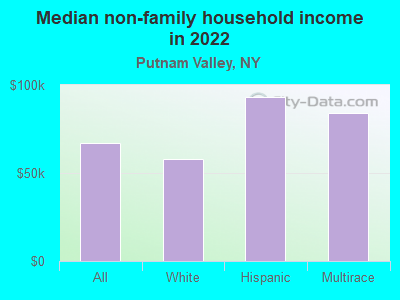
Median non-family income in Putnam Valley in 2022:| Putnam Valley: | $67,164 |
| State: | $50,181 |
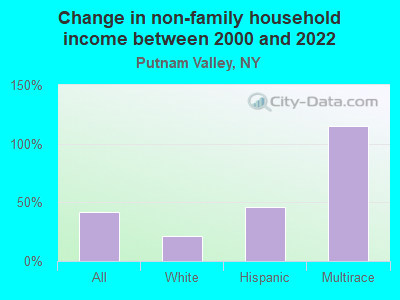
Change in median non-family income between 2000 and 2022:| Putnam Valley, New York: | +41.6% |
| New York: | +85.4% |
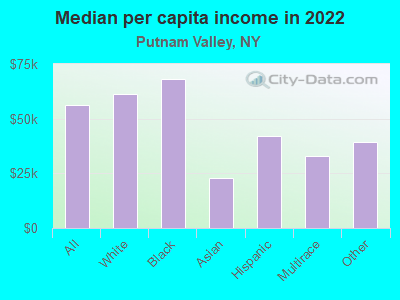
Median per capita income in Putnam Valley in 2022:| Putnam Valley: | $56,070 |
| State: | $47,421 |
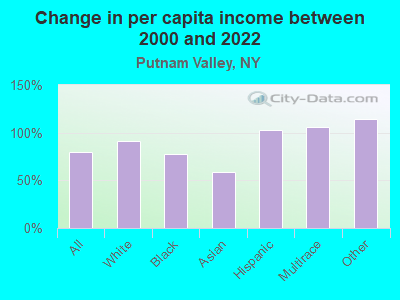
Change in median per capita income between 2000 and 2022:| Putnam Valley, New York: | +79.6% |
| State: | +102.7% |
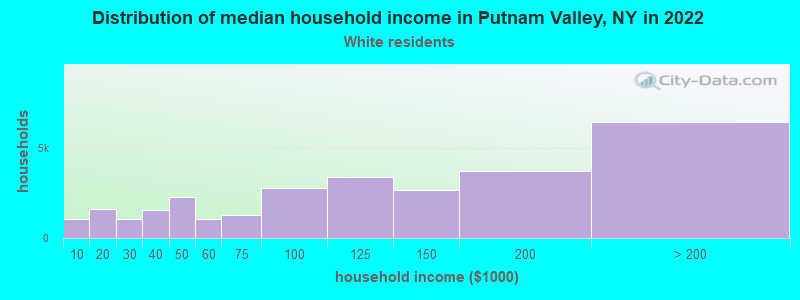
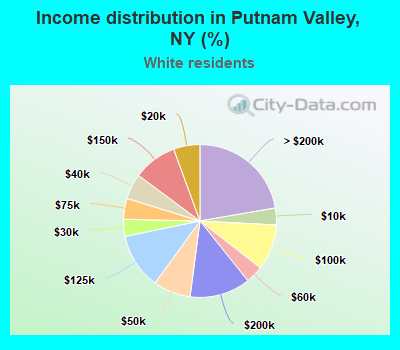
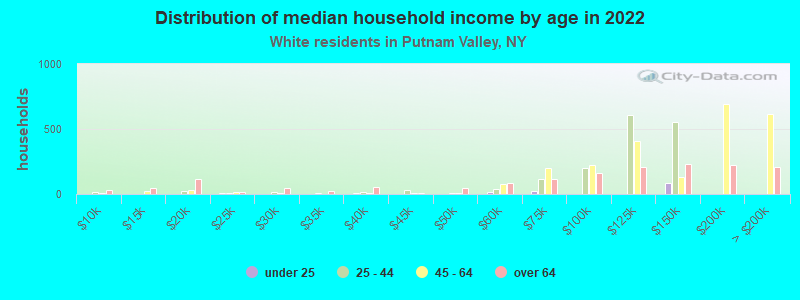
Income statistics for White residents
Median household income in Putnam Valley, NY in 2022:| Putnam Valley: | $112,304 |
| State: | $89,408 |
Change in median household income between 2000 and 2022:| Putnam Valley, New York: | +54.0% |
| State: | +85.5% |
Number of households with income < $10k:| Putnam Valley: | 3.6% (1,029) |
| State: | 4.8% (225,550) |
Number of households with income $10k - 20k:| Putnam Valley: | 5.6% (1,609) |
| State: | 6.1% (289,425) |
Number of households with income $20k - 30k:| Putnam Valley: | 3.6% (1,038) |
| State: | 5.9% (280,254) |
Number of households with income $30k - 40k:| Putnam Valley: | 5.4% (1,556) |
| State: | 6.1% (288,263) |
Number of households with income $40k - 50k:| Putnam Valley: | 7.9% (2,281) |
| State: | 5.9% (278,079) |
Number of households with income $50k - 60k:| Putnam Valley: | 3.7% (1,077) |
| State: | 5.7% (267,554) |
Number of households with income $60k - 75k:| Putnam Valley: | 4.4% (1,270) |
| State: | 8.4% (398,344) |
Number of households with income $75k - 100k:| Putnam Valley: | 9.7% (2,788) |
| State: | 11.8% (554,841) |
Number of households with income $100k - 125k:| Putnam Valley: | 11.8% (3,395) |
| State: | 10.0% (469,794) |
Number of households with income $125k - 150k:| Putnam Valley: | 9.2% (2,663) |
| New York: | 7.6% (360,467) |
Number of households with income $150k - 200k:| Putnam Valley: | 12.8% (3,696) |
| State: | 10.1% (477,078) |
Number of households with income > $200k:| Putnam Valley: | 22.3% (6,422) |
| New York: | 17.6% (829,233) |
Aggregate household income in Putnam Valley in 2022: $610,901,625
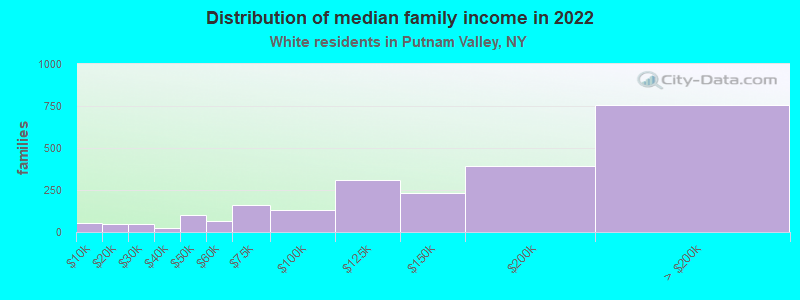
Median family income in Putnam Valley in 2022:| Putnam Valley: | $139,940 |
| State: | $115,170 |
Number of families with income < $10k:| Putnam Valley: | 2.4% (56) |
| State: | 2.5% (68,851) |
Number of families with income $10k - 20k:| Putnam Valley: | 2.0% (47) |
| New York: | 3.0% (83,127) |
Number of families with income $20k - 30k:| Putnam Valley: | 2.0% (47) |
| State: | 3.5% (97,578) |
Number of families with income $30k - 40k:| Putnam Valley: | 1.0% (23) |
| State: | 4.1% (114,108) |
Number of families with income $40k - 50k:| Putnam Valley: | 4.3% (99) |
| State: | 4.7% (130,902) |
Number of families with income $50k - 60k:| Putnam Valley: | 2.8% (66) |
| State: | 4.9% (135,118) |
Number of families with income $60k - 75k:| Putnam Valley: | 6.9% (160) |
| State: | 7.8% (216,254) |
Number of families with income $75k - 100k:| Putnam Valley: | 5.6% (130) |
| New York: | 12.4% (342,382) |
Number of families with income $100k - 125k:| Putnam Valley: | 13.4% (311) |
| New York: | 11.4% (314,917) |
Number of families with income $125k - 150k:| Putnam Valley: | 10.1% (235) |
| State: | 9.4% (260,489) |
Number of families with income $150k - 200k:| Putnam Valley: | 16.8% (390) |
| New York: | 13.2% (365,586) |
Number of families with income > $200k:| Putnam Valley: | 32.6% (754) |
| New York: | 23.2% (642,319) |
Median non-family income in Putnam Valley in 2022:| Putnam Valley: | $58,187 |
| State: | $54,783 |
Change in median non-family income between 2000 and 2022:| Putnam Valley, New York: | +20.6% |
| State: | +87.9% |
Median per capita income in Putnam Valley in 2022:| Putnam Valley: | $61,303 |
| New York: | $57,640 |
Change in median per capita income between 2000 and 2022:| Putnam Valley, New York: | +91.2% |
| State: | +111.6% |
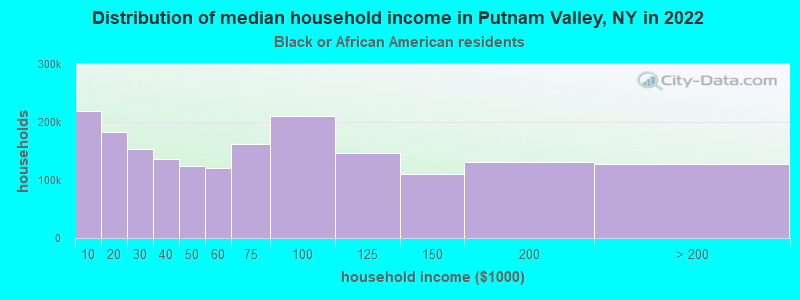
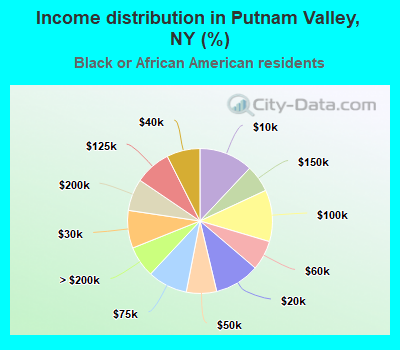
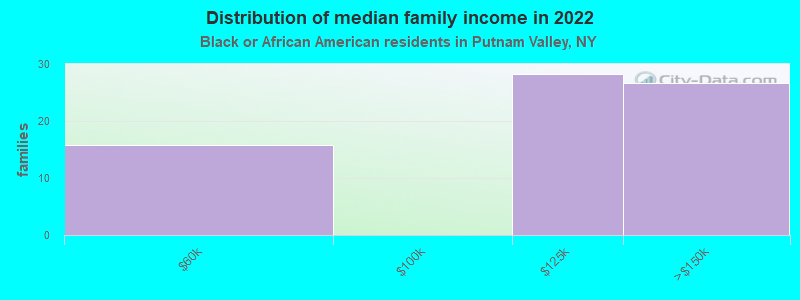
Income statistics for Black or African American residents
Median household income in Putnam Valley, NY in 2022:| Putnam Valley: | $136,020 |
| State: | $57,898 |
Change in median household income between 2000 and 2022:| Putnam Valley, New York: | +27.4% |
| State: | +84.6% |
Number of households with income < $10k:| Putnam Valley: | 12.0% (218,973) |
| State: | 12.0% (128,500) |
Number of households with income $10k - 20k:| Putnam Valley: | 10.0% (183,074) |
| State: | 10.0% (107,541) |
Number of households with income $20k - 30k:| Putnam Valley: | 8.4% (153,649) |
| New York: | 8.4% (90,192) |
Number of households with income $30k - 40k:| Putnam Valley: | 7.4% (135,417) |
| State: | 7.4% (79,579) |
Number of households with income $40k - 50k:| Putnam Valley: | 6.8% (123,476) |
| State: | 6.8% (72,491) |
Number of households with income $50k - 60k:| Putnam Valley: | 6.6% (121,101) |
| State: | 6.7% (71,309) |
Number of households with income $60k - 75k:| Putnam Valley: | 8.9% (161,901) |
| State: | 8.9% (95,050) |
Number of households with income $75k - 100k:| Putnam Valley: | 11.5% (210,063) |
| State: | 11.5% (123,569) |
Number of households with income $100k - 125k:| Putnam Valley: | 8.1% (147,058) |
| State: | 8.1% (86,632) |
Number of households with income $125k - 150k:| Putnam Valley: | 6.1% (110,330) |
| State: | 6.0% (64,788) |
Number of households with income $150k - 200k:| Putnam Valley: | 7.1% (130,186) |
| State: | 7.2% (76,644) |
Number of households with income > $200k:| Putnam Valley: | 7.0% (127,134) |
| State: | 7.0% (75,062) |
Aggregate household income in Putnam Valley in 2022: $14,243,668
Median family income in Putnam Valley in 2022:| Putnam Valley: | $211,640 |
| State: | $72,528 |
Number of families with income $50k - 60k:| Putnam Valley: | 22.4% (16) |
| New York: | 6.3% (39,748) |
Number of families with income $100k - 125k:| Putnam Valley: | 40.0% (28) |
| State: | 9.8% (61,670) |
Number of families with income $125k - 150k:| Putnam Valley: | 37.6% (27) |
| New York: | 7.5% (47,050) |
Median per capita income in Putnam Valley in 2022:| Putnam Valley: | $68,247 |
| State: | $31,947 |
Change in median per capita income between 2000 and 2022:| Putnam Valley, New York: | +77.6% |
| State: | +106.1% |
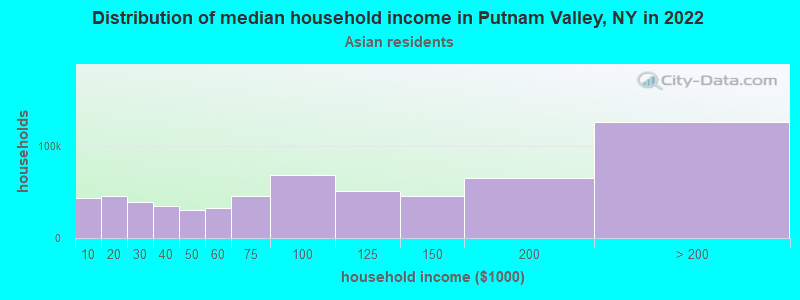
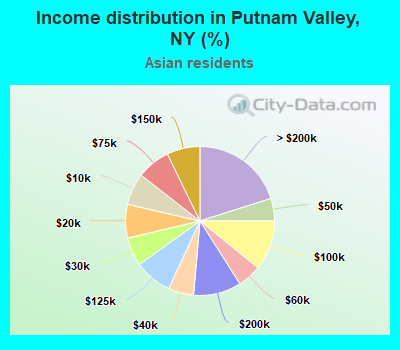
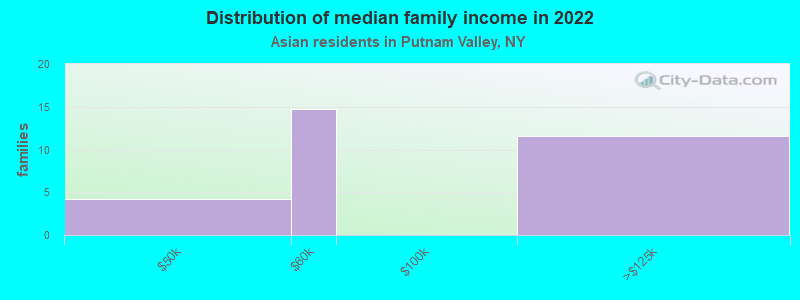
Income statistics for Asian residents
Median household income in Putnam Valley, NY in 2022:| Putnam Valley: | $118,716 |
| State: | $89,947 |
Change in median household income between 2000 and 2022:| Putnam Valley, New York: | +28.6% |
| State: | +98.1% |
Number of households with income < $10k:| Putnam Valley: | 6.9% (43,251) |
| New York: | 6.9% (42,537) |
Number of households with income $10k - 20k:| Putnam Valley: | 7.3% (45,508) |
| State: | 7.3% (44,745) |
Number of households with income $20k - 30k:| Putnam Valley: | 6.2% (38,966) |
| State: | 6.2% (38,249) |
Number of households with income $30k - 40k:| Putnam Valley: | 5.5% (34,566) |
| State: | 5.5% (33,993) |
Number of households with income $40k - 50k:| Putnam Valley: | 4.9% (30,340) |
| New York: | 4.8% (29,795) |
Number of households with income $50k - 60k:| Putnam Valley: | 5.2% (32,450) |
| State: | 5.2% (32,100) |
Number of households with income $60k - 75k:| Putnam Valley: | 7.3% (45,340) |
| New York: | 7.3% (44,615) |
Number of households with income $75k - 100k:| Putnam Valley: | 10.9% (67,795) |
| State: | 10.8% (66,687) |
Number of households with income $100k - 125k:| Putnam Valley: | 8.2% (50,937) |
| State: | 8.2% (50,233) |
Number of households with income $125k - 150k:| Putnam Valley: | 7.2% (45,008) |
| State: | 7.2% (44,299) |
Number of households with income $150k - 200k:| Putnam Valley: | 10.4% (64,755) |
| State: | 10.4% (63,837) |
Number of households with income > $200k:| Putnam Valley: | 20.1% (125,666) |
| State: | 20.1% (123,891) |
Aggregate household income in Putnam Valley in 2022: $4,404,686
Median family income in Putnam Valley in 2022:| Putnam Valley: | $85,538 |
| New York: | $98,136 |
Number of families with income $40k - 50k:| Putnam Valley: | 13.9% (4) |
| State: | 5.2% (22,750) |
Number of families with income $50k - 60k:| Putnam Valley: | 48.1% (15) |
| New York: | 5.5% (24,015) |
Number of families with income $100k - 125k:| Putnam Valley: | 38.0% (12) |
| State: | 8.6% (37,796) |
Median per capita income in Putnam Valley in 2022:| Putnam Valley: | $22,801 |
| State: | $46,726 |
Change in median per capita income between 2000 and 2022:| Putnam Valley, New York: | +59.0% |
| State: | +126.6% |
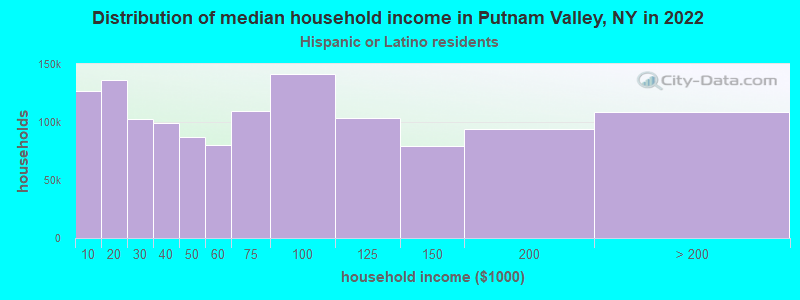
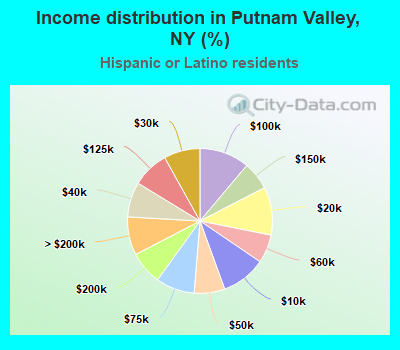
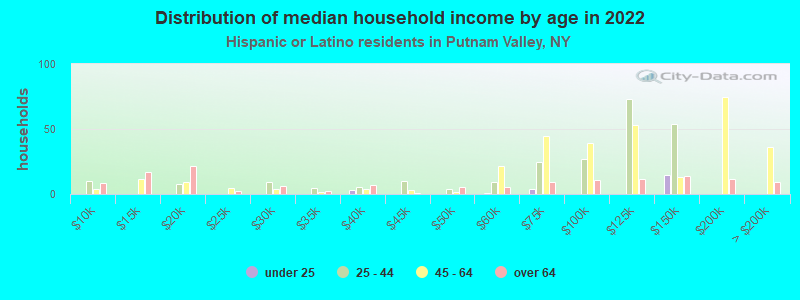
Income statistics for Hispanic or Latino residents
Median household income in Putnam Valley, NY in 2022:| Putnam Valley: | $124,453 |
| New York: | $60,468 |
Change in median household income between 2000 and 2022:| Putnam Valley, New York: | +105.3% |
| State: | +98.3% |
Number of households with income < $10k:| Putnam Valley: | 10.0% (126,325) |
| State: | 9.9% (127,185) |
Number of households with income $10k - 20k:| Putnam Valley: | 10.7% (135,983) |
| New York: | 10.7% (136,699) |
Number of households with income $20k - 30k:| Putnam Valley: | 8.1% (102,397) |
| State: | 8.1% (102,991) |
Number of households with income $30k - 40k:| Putnam Valley: | 7.8% (99,182) |
| State: | 7.8% (100,149) |
Number of households with income $40k - 50k:| Putnam Valley: | 6.8% (86,777) |
| State: | 6.9% (87,760) |
Number of households with income $50k - 60k:| Putnam Valley: | 6.3% (80,357) |
| State: | 6.3% (80,968) |
Number of households with income $60k - 75k:| Putnam Valley: | 8.6% (109,527) |
| State: | 8.7% (110,631) |
Number of households with income $75k - 100k:| Putnam Valley: | 11.2% (141,376) |
| State: | 11.2% (142,787) |
Number of households with income $100k - 125k:| Putnam Valley: | 8.2% (103,598) |
| New York: | 8.2% (104,850) |
Number of households with income $125k - 150k:| Putnam Valley: | 6.3% (79,487) |
| New York: | 6.3% (80,274) |
Number of households with income $150k - 200k:| Putnam Valley: | 7.4% (93,967) |
| State: | 7.4% (95,117) |
Number of households with income > $200k:| Putnam Valley: | 8.6% (108,370) |
| State: | 8.6% (109,514) |
Aggregate household income in Putnam Valley in 2022: $97,278,638
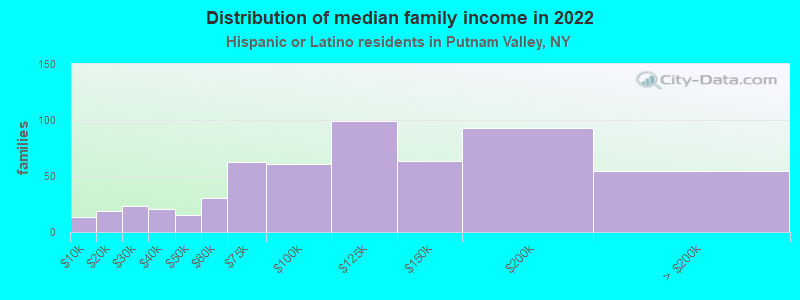
Median family income in Putnam Valley in 2022:| Putnam Valley: | $129,111 |
| New York: | $68,770 |
Number of families with income < $10k:| Putnam Valley: | 2.4% (13) |
| State: | 6.9% (58,565) |
Number of families with income $10k - 20k:| Putnam Valley: | 3.4% (19) |
| New York: | 7.0% (59,058) |
Number of families with income $20k - 30k:| Putnam Valley: | 4.2% (24) |
| State: | 8.0% (68,048) |
Number of families with income $30k - 40k:| Putnam Valley: | 3.7% (21) |
| New York: | 8.4% (70,668) |
Number of families with income $40k - 50k:| Putnam Valley: | 2.8% (16) |
| State: | 7.4% (62,941) |
Number of families with income $50k - 60k:| Putnam Valley: | 5.5% (31) |
| State: | 6.6% (55,592) |
Number of families with income $60k - 75k:| Putnam Valley: | 11.3% (63) |
| New York: | 9.3% (78,564) |
Number of families with income $75k - 100k:| Putnam Valley: | 10.9% (61) |
| State: | 12.6% (106,685) |
Number of families with income $100k - 125k:| Putnam Valley: | 17.8% (99) |
| New York: | 9.4% (79,139) |
Number of families with income $125k - 150k:| Putnam Valley: | 11.4% (63) |
| State: | 6.9% (58,255) |
Number of families with income $150k - 200k:| Putnam Valley: | 16.7% (92) |
| State: | 8.3% (69,877) |
Number of families with income > $200k:| Putnam Valley: | 9.8% (55) |
| New York: | 9.3% (78,555) |
Median non-family income in Putnam Valley in 2022:| Putnam Valley: | $93,050 |
| State: | $34,000 |
Change in median non-family income between 2000 and 2022:| Putnam Valley, New York: | +46.0% |
| State: | +93.9% |
Median per capita income in Putnam Valley in 2022:| Putnam Valley: | $41,902 |
| State: | $29,761 |
Change in median per capita income between 2000 and 2022:| Putnam Valley, New York: | +103.5% |
| State: | +132.7% |
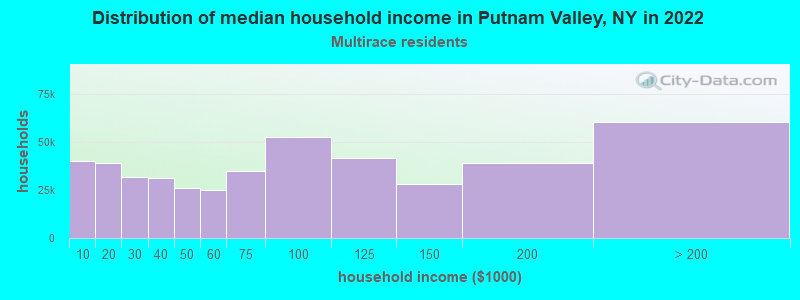
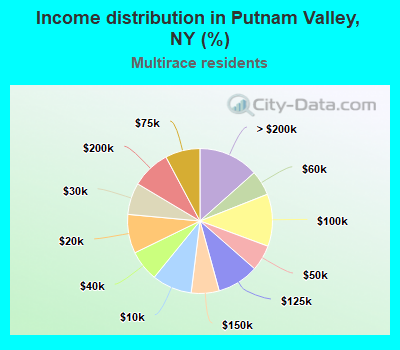
Income statistics for Multirace residents
Median household income in Putnam Valley, NY in 2022:| Putnam Valley: | $81,277 |
| New York: | $73,557 |
Change in median household income between 2000 and 2022:| Putnam Valley, New York: | +79.4% |
| New York: | +123.9% |
Number of households with income < $10k:| Putnam Valley: | 8.9% (39,997) |
| New York: | 8.9% (57,924) |
Number of households with income $10k - 20k:| Putnam Valley: | 8.7% (39,008) |
| State: | 8.7% (56,590) |
Number of households with income $20k - 30k:| Putnam Valley: | 7.1% (31,885) |
| New York: | 7.1% (46,287) |
Number of households with income $30k - 40k:| Putnam Valley: | 6.9% (31,058) |
| New York: | 6.9% (45,132) |
Number of households with income $40k - 50k:| Putnam Valley: | 5.8% (26,062) |
| State: | 5.8% (37,946) |
Number of households with income $50k - 60k:| Putnam Valley: | 5.6% (25,040) |
| New York: | 5.6% (36,410) |
Number of households with income $60k - 75k:| Putnam Valley: | 7.8% (34,928) |
| New York: | 7.8% (50,819) |
Number of households with income $75k - 100k:| Putnam Valley: | 11.7% (52,340) |
| State: | 11.7% (76,024) |
Number of households with income $100k - 125k:| Putnam Valley: | 9.3% (41,650) |
| State: | 9.3% (60,635) |
Number of households with income $125k - 150k:| Putnam Valley: | 6.2% (27,908) |
| State: | 6.2% (40,533) |
Number of households with income $150k - 200k:| Putnam Valley: | 8.6% (38,821) |
| State: | 8.6% (56,409) |
Number of households with income > $200k:| Putnam Valley: | 13.4% (60,269) |
| State: | 13.4% (87,442) |
Aggregate household income in Putnam Valley in 2022: $47,082,576
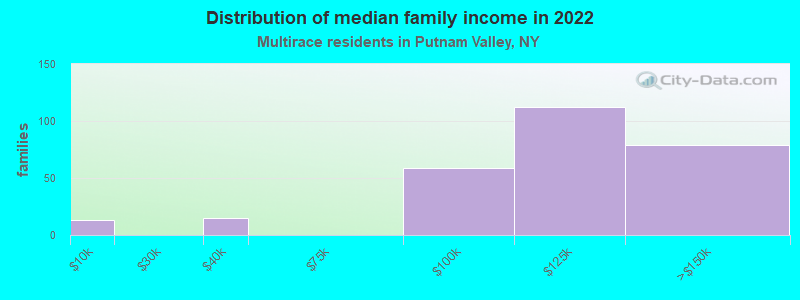
Median family income in Putnam Valley in 2022:| Putnam Valley: | $208,244 |
| New York: | $85,788 |
Number of families with income < $10k:| Putnam Valley: | 4.7% (13) |
| New York: | 6.2% (24,976) |
Number of families with income $30k - 40k:| Putnam Valley: | 5.4% (15) |
| State: | 6.5% (26,239) |
Number of families with income $75k - 100k:| Putnam Valley: | 21.2% (59) |
| State: | 12.9% (51,995) |
Number of families with income $100k - 125k:| Putnam Valley: | 40.3% (112) |
| State: | 10.7% (43,036) |
Number of families with income $125k - 150k:| Putnam Valley: | 28.4% (79) |
| State: | 7.1% (28,583) |
Median non-family income in Putnam Valley in 2022:| Putnam Valley: | $84,114 |
| State: | $46,403 |
Change in median non-family income between 2000 and 2022:| Putnam Valley, New York: | +114.5% |
| State: | +113.6% |
Median per capita income in Putnam Valley in 2022:| Putnam Valley: | $33,090 |
| State: | $36,931 |
Change in median per capita income between 2000 and 2022:| Putnam Valley, New York: | +105.5% |
| State: | +158.8% |
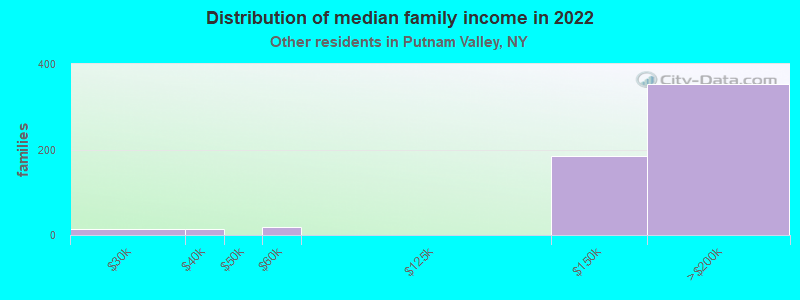
Income statistics for other residents
Number of households with income < $10k:| Putnam Valley: | 10.5% (119) |
| State: | 10.3% (69,252) |
Number of households with income $10k - 20k:| Putnam Valley: | 10.3% (117) |
| State: | 11.0% (73,890) |
Number of households with income $20k - 30k:| Putnam Valley: | 7.7% (87) |
| State: | 8.8% (59,096) |
Number of households with income $30k - 40k:| Putnam Valley: | 7.3% (83) |
| New York: | 8.1% (54,418) |
Number of households with income $40k - 50k:| Putnam Valley: | 7.4% (84) |
| New York: | 7.3% (49,042) |
Number of households with income $50k - 60k:| Putnam Valley: | 5.6% (64) |
| State: | 6.5% (43,945) |
Number of households with income $60k - 75k:| Putnam Valley: | 9.2% (104) |
| New York: | 9.5% (64,087) |
Number of households with income $75k - 100k:| Putnam Valley: | 11.4% (129) |
| New York: | 10.9% (73,094) |
Number of households with income $100k - 125k:| Putnam Valley: | 8.9% (101) |
| State: | 7.9% (53,055) |
Number of households with income $125k - 150k:| Putnam Valley: | 5.4% (61) |
| State: | 5.9% (39,446) |
Number of households with income $150k - 200k:| Putnam Valley: | 9.1% (103) |
| New York: | 7.2% (48,653) |
Number of households with income > $200k:| Putnam Valley: | 7.3% (83) |
| State: | 6.6% (44,703) |
Aggregate household income in Putnam Valley in 2022: $72,664,274
Median family income in Putnam Valley in 2022:| Putnam Valley: | $93,637 |
| State: | $63,465 |
Number of families with income $20k - 30k:| Putnam Valley: | 2.3% (14) |
| New York: | 9.2% (43,198) |
Number of families with income $30k - 40k:| Putnam Valley: | 2.5% (15) |
| State: | 9.5% (44,688) |
Number of families with income $50k - 60k:| Putnam Valley: | 3.1% (18) |
| State: | 7.1% (33,324) |
Number of families with income $125k - 150k:| Putnam Valley: | 31.5% (184) |
| State: | 6.5% (30,363) |
Number of families with income $150k - 200k:| Putnam Valley: | 60.5% (354) |
| New York: | 7.9% (37,167) |
Median per capita income in Putnam Valley in 2022:| Putnam Valley: | $39,441 |
| State: | $26,975 |
Change in median per capita income between 2000 and 2022:| Putnam Valley, New York: | +113.7% |
| State: | +144.6% |