The median household income in Port O'Connor, TX in 2022 was $90,212, which was 19.9% greater than the median annual income of $72,284 across the entire state of Texas. Compared to the median income of $35,849 in 2000 this represents an increase of 60.3%. The per capita income in 2022 was $34,970, which means an increase of 51.0% compared to 2000 when it was $17,125.
Whole page based on the data from 2000 / 2022 when the population of Port O'Connor, Texas was 1,253 / 812
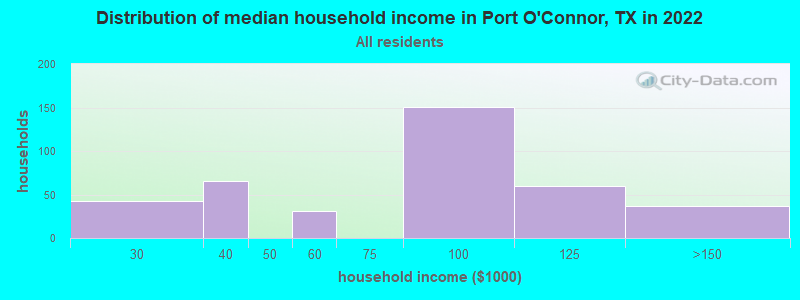
Income statistics for all residents
Median household income in Port O'Connor, TX in 2022:
Port O'Connor:
$90,213
State:
$72,284
Number of households with income < $10k:
Port O'Connor:
0.0% (0)
State:
5.5% (611,011)
Number of households with income $10k - 20k:
Port O'Connor:
0.0% (0)
State:
6.7% (743,157)
Number of households with income $20k - 30k:
Port O'Connor:
10.9% (42)
Texas:
7.2% (803,381)
Number of households with income $30k - 40k:
Port O'Connor:
16.8% (65)
State:
7.8% (866,080)
Number of households with income $40k - 50k:
Port O'Connor:
0.0% (0)
State:
7.3% (810,440)
Number of households with income $50k - 60k:
Port O'Connor:
8.0% (31)
State:
7.2% (799,783)
Number of households with income $60k - 75k:
Port O'Connor:
0.0% (0)
State:
9.9% (1,095,384)
Number of households with income $75k - 100k:
Port O'Connor:
39.1% (151)
State:
12.8% (1,419,057)
Number of households with income $100k - 125k:
Port O'Connor:
15.5% (60)
State:
9.5% (1,054,577)
Number of households with income $125k - 150k:
Port O'Connor:
9.6% (37)
Texas:
6.7% (741,518)
Number of households with income $150k - 200k:
Port O'Connor:
0.0% (0)
State:
8.7% (961,776)
Number of households with income > $200k:
Port O'Connor:
0.0% (0)
Texas:
10.7% (1,181,544)
Aggregate household income in Port O'Connor in 2022: $29,256,073
Median family income in Port O'Connor in 2022:
Port O'Connor:
$93,356
Texas:
$86,267
Number of families with income $20k - 30k:
Port O'Connor:
7.7% (25)
Texas:
5.8% (430,949)
Number of families with income $30k - 40k:
Port O'Connor:
20.1% (64)
Texas:
6.6% (493,535)
Number of families with income $50k - 60k:
Port O'Connor:
9.4% (30)
State:
6.6% (492,203)
Number of families with income $75k - 100k:
Port O'Connor:
32.5% (103)
State:
13.6% (1,015,480)
Number of families with income $100k - 125k:
Port O'Connor:
18.5% (59)
State:
10.7% (797,961)
Number of families with income $125k - 150k:
Port O'Connor:
11.7% (37)
State:
8.1% (602,985)
Median income for 2 person families:
Port O'Connor:
$91,784
State:
$76,712
Median income for families with 0 earners:
Port O'Connor:
$0
State:
$41,529
Median income for families with 1 earner:
Port O'Connor:
$90,647
State:
$59,030
Median income for families with 2 earners:
Port O'Connor:
$0
Texas:
$111,348
Median income for families with 3+ earners:
Port O'Connor:
$0
Texas:
$132,976
Median per capita income in Port O'Connor in 2022:
Port O'Connor:
$34,971
Texas:
$38,123
Change in median per capita income between 2000 and 2022:
Port O'Connor, Texas:
+104.2%
Texas:
+94.3%
Income statistics for White residents
Median household income in Port O'Connor, TX in 2022:
Port O'Connor:
$93,309
State:
$82,032
Change in median household income between 2000 and 2022:
Port O'Connor, Texas:
+148.7%
State:
+91.0%
Number of households with income < $10k:
Port O'Connor:
0.0% (0)
State:
4.7% (273,716)
Number of households with income $10k - 20k:
Port O'Connor:
0.0% (0)
State:
5.5% (322,702)
Number of households with income $20k - 30k:
Port O'Connor:
10.0% (32)
State:
6.2% (363,947)
Number of households with income $30k - 40k:
Port O'Connor:
16.2% (52)
Texas:
6.8% (399,275)
Number of households with income $40k - 50k:
Port O'Connor:
0.0% (0)
State:
6.5% (383,417)
Number of households with income $50k - 60k:
Port O'Connor:
7.8% (25)
State:
6.6% (388,535)
Number of households with income $60k - 75k:
Port O'Connor:
0.0% (0)
Texas:
9.7% (566,295)
Number of households with income $75k - 100k:
Port O'Connor:
39.7% (127)
Texas:
13.0% (760,276)
Number of households with income $100k - 125k:
Port O'Connor:
16.2% (52)
State:
10.2% (597,596)
Number of households with income $125k - 150k:
Port O'Connor:
10.0% (32)
Texas:
7.4% (436,830)
Number of households with income $150k - 200k:
Port O'Connor:
0.0% (0)
State:
9.9% (583,067)
Number of households with income > $200k:
Port O'Connor:
0.0% (0)
Texas:
13.5% (792,647)
Aggregate household income in Port O'Connor in 2022: $25,717,183
Median family income in Port O'Connor in 2022:
Port O'Connor:
$99,315
Texas:
$101,788
Number of families with income $20k - 30k:
Port O'Connor:
6.5% (16)
Texas:
4.1% (157,688)
Number of families with income $30k - 40k:
Port O'Connor:
18.2% (46)
State:
5.2% (198,847)
Number of families with income $50k - 60k:
Port O'Connor:
9.0% (23)
State:
5.7% (220,689)
Number of families with income $75k - 100k:
Port O'Connor:
33.7% (86)
Texas:
13.7% (527,363)
Number of families with income $100k - 125k:
Port O'Connor:
19.9% (50)
State:
11.6% (448,411)
Number of families with income $125k - 150k:
Port O'Connor:
12.7% (32)
State:
9.2% (355,798)
Median per capita income in Port O'Connor in 2022:
Port O'Connor:
$38,569
State:
$47,740
Change in median per capita income between 2000 and 2022:
Port O'Connor, Texas:
+108.6%
State:
+114.3%
Income statistics for Black or African American residents
Median per capita income in Port O'Connor in 2022:
Port O'Connor:
$43,560
Texas:
$30,490
Change in median per capita income between 2000 and 2022:
Port O'Connor, Texas:
+116.3%
State:
+113.9%
Income statistics for Hispanic or Latino residents
Aggregate household income in Port O'Connor in 2022: $3,256,448
Median per capita income in Port O'Connor in 2022:
Port O'Connor:
$18,550
State:
$24,862
Change in median per capita income between 2000 and 2022:
Port O'Connor, Texas:
+49.4%
Texas:
+130.8%
Income statistics for Multirace residents
Median per capita income in Port O'Connor in 2022:
Port O'Connor:
$9,921
State:
$26,785
Change in median per capita income between 2000 and 2022:: -10.7%
Port O'Connor, Texas:
-10.7%
State:
+110.9%
Discuss Port O'Connor, Texas (TX) on our hugely popular Texas forum.