Pinesburg, Maryland (MD) income map, earnings map, and wages data

Data:
The per capita income in 2022 was $21,255, which means an increase of 5.6% compared to 2000 when it was $20,062.
Whole page based on the data from 2000 / 2022 when the population of Pinesburg, Maryland was 449 / 514
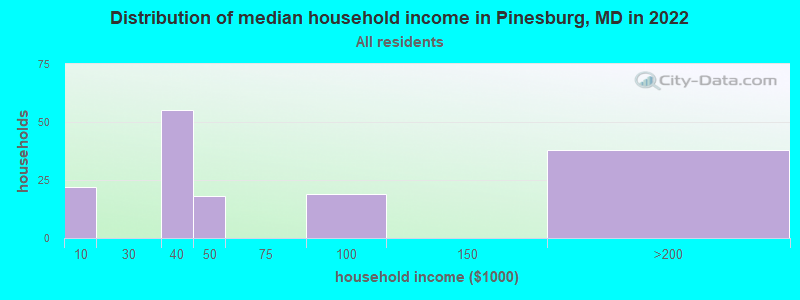
Income statistics for all residents
Number of households with income < $10k:| Pinesburg: | 14.5% (22) |
| Maryland: | 4.8% (114,450) |
Number of households with income $10k - 20k:| Pinesburg: | 0.0% (0) |
| State: | 5.0% (117,883) |
Number of households with income $20k - 30k:| Pinesburg: | 0.0% (0) |
| State: | 5.2% (123,350) |
Number of households with income $30k - 40k:| Pinesburg: | 36.2% (55) |
| State: | 5.6% (134,104) |
Number of households with income $40k - 50k:| Pinesburg: | 11.8% (18) |
| State: | 5.6% (132,932) |
Number of households with income $50k - 60k:| Pinesburg: | 0.0% (0) |
| State: | 5.6% (132,707) |
Number of households with income $60k - 75k:| Pinesburg: | 0.0% (0) |
| State: | 7.9% (188,335) |
Number of households with income $75k - 100k:| Pinesburg: | 12.5% (19) |
| State: | 12.5% (297,873) |
Number of households with income $100k - 125k:| Pinesburg: | 0.0% (0) |
| State: | 10.5% (250,497) |
Number of households with income $125k - 150k:| Pinesburg: | 0.0% (0) |
| State: | 8.1% (193,208) |
Number of households with income $150k - 200k:| Pinesburg: | 25.0% (38) |
| Maryland: | 11.6% (274,905) |
Number of households with income > $200k:| Pinesburg: | 0.0% (0) |
| Maryland: | 17.5% (415,740) |
Aggregate household income in Pinesburg in 2022: $10,626,385
Median per capita income in Pinesburg in 2022:| Pinesburg: | $21,256 |
| State: | $49,236 |
Change in median per capita income between 2000 and 2022:| Pinesburg, Maryland: | +6.0% |
| Maryland: | +92.2% |
Income statistics for White residents
Number of households with income < $10k:| Pinesburg: | 14.9% (20) |
| State: | 3.7% (47,387) |
Number of households with income $10k - 20k:| Pinesburg: | 0.0% (0) |
| Maryland: | 4.1% (52,102) |
Number of households with income $20k - 30k:| Pinesburg: | 0.0% (0) |
| Maryland: | 4.6% (58,758) |
Number of households with income $30k - 40k:| Pinesburg: | 32.1% (43) |
| State: | 4.7% (59,745) |
Number of households with income $40k - 50k:| Pinesburg: | 11.9% (16) |
| State: | 5.0% (62,576) |
Number of households with income $50k - 60k:| Pinesburg: | 0.0% (0) |
| State: | 5.1% (64,484) |
Number of households with income $60k - 75k:| Pinesburg: | 0.0% (0) |
| Maryland: | 7.7% (97,019) |
Number of households with income $75k - 100k:| Pinesburg: | 14.2% (19) |
| Maryland: | 11.8% (149,205) |
Number of households with income $100k - 125k:| Pinesburg: | 0.0% (0) |
| State: | 10.6% (134,231) |
Number of households with income $125k - 150k:| Pinesburg: | 0.0% (0) |
| State: | 8.8% (111,081) |
Number of households with income $150k - 200k:| Pinesburg: | 26.9% (36) |
| Maryland: | 12.9% (162,966) |
Number of households with income > $200k:| Pinesburg: | 0.0% (0) |
| State: | 20.9% (264,377) |
Aggregate household income in Pinesburg in 2022: $10,168,688
Median per capita income in Pinesburg in 2022:| Pinesburg: | $21,696 |
| Maryland: | $59,750 |
Change in median per capita income between 2000 and 2022:| Pinesburg, Maryland: | +6.2% |
| Maryland: | +104.5% |