The median household income in Philipsburg, PA in 2022 was $43,266, which was 65.9% less than the median annual income of $71,798 across the entire state of Pennsylvania. Compared to the median income of $28,356 in 2000 this represents an increase of 34.5%. The per capita income in 2022 was $29,802, which means an increase of 46.3% compared to 2000 when it was $16,002.
Whole page based on the data from 2000 / 2022 when the population of Philipsburg, Pennsylvania was 3,056 / 2,778
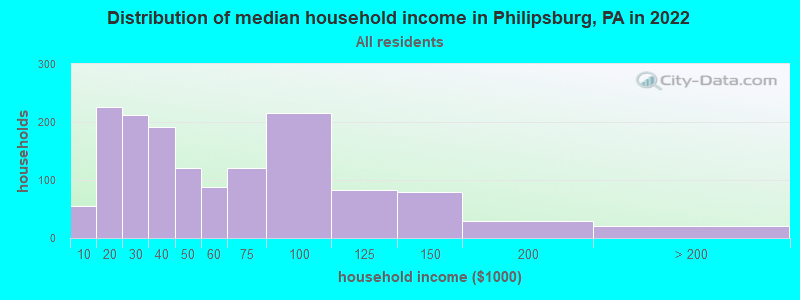
Income statistics for all residents
Median household income in Philipsburg, PA in 2022:
Philipsburg:
$43,266
State:
$71,798
Change in median household income between 2000 and 2022:
Philipsburg, Pennsylvania:
+52.6%
State:
+79.0%
Number of households with income < $10k:
Philipsburg:
3.9% (56)
Pennsylvania:
5.5% (291,562)
Number of households with income $10k - 20k:
Philipsburg:
15.7% (226)
State:
7.3% (384,726)
Number of households with income $20k - 30k:
Philipsburg:
14.7% (212)
Pennsylvania:
7.4% (389,464)
Number of households with income $30k - 40k:
Philipsburg:
13.3% (192)
Pennsylvania:
7.6% (402,138)
Number of households with income $40k - 50k:
Philipsburg:
8.4% (121)
Pennsylvania:
7.3% (387,945)
Number of households with income $50k - 60k:
Philipsburg:
6.1% (88)
Pennsylvania:
7.0% (372,468)
Number of households with income $60k - 75k:
Philipsburg:
8.3% (120)
State:
9.9% (524,786)
Number of households with income $75k - 100k:
Philipsburg:
14.9% (215)
State:
12.6% (666,253)
Number of households with income $100k - 125k:
Philipsburg:
5.8% (83)
Pennsylvania:
9.9% (526,402)
Number of households with income $125k - 150k:
Philipsburg:
5.5% (79)
State:
6.9% (362,702)
Number of households with income $150k - 200k:
Philipsburg:
2.1% (30)
State:
8.3% (440,827)
Number of households with income > $200k:
Philipsburg:
1.5% (21)
State:
10.3% (544,792)
Aggregate household income in Philipsburg in 2022: $80,968,656
Median family income in Philipsburg in 2022:
Philipsburg:
$69,819
Pennsylvania:
$93,029
Number of families with income $10k - 20k:
Philipsburg:
5.9% (39)
State:
3.5% (115,881)
Number of families with income $20k - 30k:
Philipsburg:
13.4% (89)
Pennsylvania:
4.8% (156,521)
Number of families with income $40k - 50k:
Philipsburg:
16.1% (107)
State:
6.4% (211,380)
Number of families with income $50k - 60k:
Philipsburg:
5.8% (39)
State:
6.4% (209,910)
Number of families with income $60k - 75k:
Philipsburg:
14.1% (94)
State:
9.7% (318,991)
Number of families with income $75k - 100k:
Philipsburg:
22.2% (147)
Pennsylvania:
14.0% (461,021)
Number of families with income $100k - 125k:
Philipsburg:
7.0% (46)
State:
12.2% (400,961)
Number of families with income $125k - 150k:
Philipsburg:
9.5% (63)
Pennsylvania:
8.8% (288,471)
Number of families with income $150k - 200k:
Philipsburg:
3.1% (21)
Pennsylvania:
11.2% (367,642)
Number of families with income > $200k:
Philipsburg:
2.9% (19)
State:
14.3% (470,863)
Median non-family income in Philipsburg in 2022:
Philipsburg:
$30,561
Pennsylvania:
$42,203
Change in median non-family income between 2000 and 2022:
Philipsburg, Pennsylvania:
+87.0%
State:
+90.1%
Median per capita income in Philipsburg in 2022:
Philipsburg:
$29,803
State:
$41,489
Change in median per capita income between 2000 and 2022:
Philipsburg, Pennsylvania:
+86.2%
State:
+98.7%
Income statistics for White residents
Median household income in Philipsburg, PA in 2022:
Philipsburg:
$41,293
State:
$76,765
Change in median household income between 2000 and 2022:
Philipsburg, Pennsylvania:
+46.5%
Pennsylvania:
+84.3%
Number of households with income < $10k:
Philipsburg:
4.2% (59)
State:
4.3% (179,792)
Number of households with income $10k - 20k:
Philipsburg:
17.0% (238)
State:
6.5% (268,738)
Number of households with income $20k - 30k:
Philipsburg:
14.4% (201)
State:
7.0% (288,138)
Number of households with income $30k - 40k:
Philipsburg:
14.4% (201)
Pennsylvania:
7.2% (300,208)
Number of households with income $40k - 50k:
Philipsburg:
6.2% (86)
State:
7.2% (298,756)
Number of households with income $50k - 60k:
Philipsburg:
6.1% (85)
State:
6.8% (283,251)
Number of households with income $60k - 75k:
Philipsburg:
8.7% (122)
State:
9.9% (408,159)
Number of households with income $75k - 100k:
Philipsburg:
15.1% (211)
State:
13.2% (547,809)
Number of households with income $100k - 125k:
Philipsburg:
5.6% (78)
State:
10.5% (436,652)
Number of households with income $125k - 150k:
Philipsburg:
4.7% (66)
Pennsylvania:
7.3% (304,132)
Number of households with income $150k - 200k:
Philipsburg:
2.1% (29)
State:
9.0% (374,658)
Number of households with income > $200k:
Philipsburg:
1.6% (22)
State:
10.9% (452,618)
Aggregate household income in Philipsburg in 2022: $77,227,024
Median family income in Philipsburg in 2022:
Philipsburg:
$70,884
State:
$99,396
Number of families with income $10k - 20k:
Philipsburg:
7.6% (45)
State:
2.7% (69,032)
Number of families with income $20k - 30k:
Philipsburg:
11.6% (68)
State:
3.9% (100,065)
Number of families with income $40k - 50k:
Philipsburg:
11.0% (64)
State:
6.0% (154,327)
Number of families with income $50k - 60k:
Philipsburg:
6.1% (36)
Pennsylvania:
6.1% (157,983)
Number of families with income $60k - 75k:
Philipsburg:
16.2% (95)
Pennsylvania:
9.6% (249,292)
Number of families with income $75k - 100k:
Philipsburg:
24.2% (142)
State:
14.7% (379,316)
Number of families with income $100k - 125k:
Philipsburg:
7.4% (43)
State:
12.9% (333,626)
Number of families with income $125k - 150k:
Philipsburg:
8.9% (52)
Pennsylvania:
9.4% (243,915)
Number of families with income $150k - 200k:
Philipsburg:
3.5% (20)
State:
12.2% (314,926)
Number of families with income > $200k:
Philipsburg:
3.5% (20)
State:
15.1% (390,885)
Median non-family income in Philipsburg in 2022:
Philipsburg:
$30,183
State:
$44,251
Change in median non-family income between 2000 and 2022:
Philipsburg, Pennsylvania:
+86.2%
Pennsylvania:
+94.2%
Median per capita income in Philipsburg in 2022:
Philipsburg:
$31,810
State:
$45,306
Change in median per capita income between 2000 and 2022:
Philipsburg, Pennsylvania:
+97.9%
State:
+105.4%
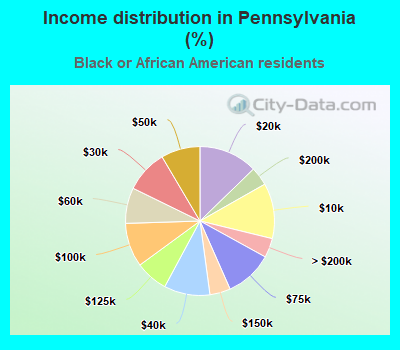
Income statistics for Black or African American residents
Number of households with income < $10k:
Philipsburg:
0.0% (0)
State:
12.0% (64,705)
Number of households with income $10k - 20k:
Philipsburg:
0.0% (0)
State:
12.7% (68,459)
Number of households with income $20k - 30k:
Philipsburg:
0.0% (0)
State:
9.3% (49,778)
Number of households with income $30k - 40k:
Philipsburg:
0.0% (0)
State:
10.0% (53,629)
Number of households with income $40k - 50k:
Philipsburg:
75.4% (43)
State:
8.5% (45,601)
Number of households with income $50k - 60k:
Philipsburg:
0.0% (0)
State:
7.8% (41,725)
Number of households with income $60k - 75k:
Philipsburg:
0.0% (0)
Pennsylvania:
10.4% (55,653)
Number of households with income $75k - 100k:
Philipsburg:
0.0% (0)
Pennsylvania:
9.5% (51,281)
Number of households with income $100k - 125k:
Philipsburg:
0.0% (0)
State:
7.1% (38,125)
Number of households with income $125k - 150k:
Philipsburg:
24.6% (14)
State:
4.5% (24,172)
Number of households with income $150k - 200k:
Philipsburg:
0.0% (0)
State:
4.0% (21,749)
Number of households with income > $200k:
Philipsburg:
0.0% (0)
State:
4.2% (22,562)
Median per capita income in Philipsburg in 2022:
Philipsburg:
$12,716
Pennsylvania:
$28,010
Income statistics for Hispanic or Latino residents
Aggregate household income in Philipsburg in 2022: $1,172,046
Median per capita income in Philipsburg in 2022:
Philipsburg:
$25,164
Pennsylvania:
$23,829
Income statistics for Multirace residents
Number of households with income < $10k:
Philipsburg:
63.2% (12)
State:
7.8% (21,911)
Number of households with income $10k - 20k:
Philipsburg:
0.0% (0)
State:
8.2% (22,847)
Number of households with income $20k - 30k:
Philipsburg:
36.8% (7)
State:
8.7% (24,252)
Number of households with income $30k - 40k:
Philipsburg:
0.0% (0)
Pennsylvania:
7.3% (20,502)
Number of households with income $40k - 50k:
Philipsburg:
0.0% (0)
Pennsylvania:
7.7% (21,525)
Number of households with income $50k - 60k:
Philipsburg:
0.0% (0)
State:
8.6% (24,174)
Number of households with income $60k - 75k:
Philipsburg:
0.0% (0)
State:
11.9% (33,350)
Number of households with income $75k - 100k:
Philipsburg:
0.0% (0)
Pennsylvania:
11.5% (32,274)
Number of households with income $100k - 125k:
Philipsburg:
0.0% (0)
State:
8.3% (23,361)
Number of households with income $125k - 150k:
Philipsburg:
0.0% (0)
Pennsylvania:
5.3% (14,784)
Number of households with income $150k - 200k:
Philipsburg:
0.0% (0)
State:
6.9% (19,314)
Number of households with income > $200k:
Philipsburg:
0.0% (0)
Pennsylvania:
7.8% (21,759)
Median per capita income in Philipsburg in 2022:
Philipsburg:
$15,043
State:
$27,581
Discuss Philipsburg, Pennsylvania (PA) on our hugely popular Pennsylvania forum.