Pelham, Massachusetts (MA) income map, earnings map, and wages data
The median household income in Pelham, MA in 2022 was $109,214, which was 13.5% greater than the median annual income of $94,488 across the entire state of Massachusetts. Compared to the median income of $61,339 in 2000 this represents an increase of 43.8%. The per capita income in 2022 was $57,201, which means an increase of 47.9% compared to 2000 when it was $29,821.
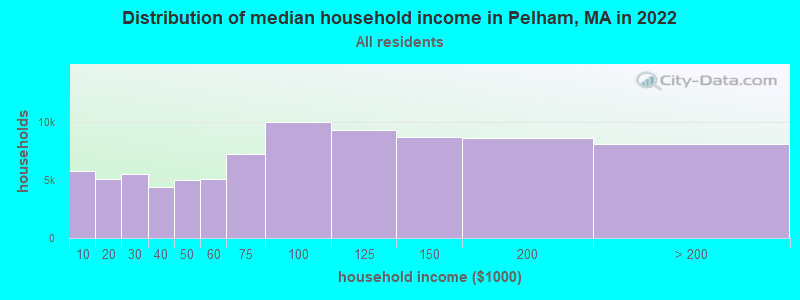
Income statistics for all residents
Median household income in Pelham, MA in 2022:| Pelham: | $109,215 |
| Massachusetts: | $94,488 |
Change in median household income between 2000 and 2022:| Pelham, Massachusetts: | +78.1% |
| Massachusetts: | +87.1% |
Number of households with income < $10k:| Pelham: | 7.0% (5,780) |
| State: | 5.2% (146,170) |
Number of households with income $10k - 20k:| Pelham: | 6.1% (5,075) |
| State: | 6.4% (180,001) |
Number of households with income $20k - 30k:| Pelham: | 6.6% (5,481) |
| Massachusetts: | 5.6% (156,667) |
Number of households with income $30k - 40k:| Pelham: | 5.3% (4,402) |
| State: | 5.6% (157,168) |
Number of households with income $40k - 50k:| Pelham: | 6.0% (4,954) |
| State: | 5.4% (151,455) |
Number of households with income $50k - 60k:| Pelham: | 6.2% (5,108) |
| Massachusetts: | 5.1% (142,726) |
Number of households with income $60k - 75k:| Pelham: | 8.7% (7,200) |
| Massachusetts: | 7.6% (212,203) |
Number of households with income $75k - 100k:| Pelham: | 12.1% (9,982) |
| State: | 11.3% (317,064) |
Number of households with income $100k - 125k:| Pelham: | 11.2% (9,305) |
| Massachusetts: | 9.7% (270,603) |
Number of households with income $125k - 150k:| Pelham: | 10.5% (8,690) |
| Massachusetts: | 8.0% (223,140) |
Number of households with income $150k - 200k:| Pelham: | 10.4% (8,641) |
| Massachusetts: | 11.0% (308,695) |
Number of households with income > $200k:| Pelham: | 9.8% (8,117) |
| State: | 19.0% (531,884) |
Aggregate household income in Pelham in 2022: $128,137,527
Median family income in Pelham in 2022:| Pelham: | $140,605 |
| Massachusetts: | $120,263 |
Median non-family income in Pelham in 2022:| Pelham: | $61,286 |
| Massachusetts: | $55,979 |
Change in median non-family income between 2000 and 2022:| Pelham, Massachusetts: | +62.3% |
| State: | +88.0% |
Median per capita income in Pelham in 2022:| Pelham: | $57,201 |
| State: | $54,025 |
Change in median per capita income between 2000 and 2022:| Pelham, Massachusetts: | +91.8% |
| State: | +108.2% |
Income statistics for White residents
Median household income in Pelham, MA in 2022:| Pelham: | $114,211 |
| State: | $101,391 |
Change in median household income between 2000 and 2022:| Pelham, Massachusetts: | +84.3% |
| State: | +93.3% |
Number of households with income < $10k:| Pelham: | 5.2% (3,649) |
| State: | 4.4% (91,120) |
Number of households with income $10k - 20k:| Pelham: | 5.4% (3,814) |
| State: | 5.9% (122,055) |
Number of households with income $20k - 30k:| Pelham: | 5.7% (4,029) |
| State: | 5.1% (105,311) |
Number of households with income $30k - 40k:| Pelham: | 6.0% (4,250) |
| Massachusetts: | 5.3% (110,239) |
Number of households with income $40k - 50k:| Pelham: | 6.3% (4,447) |
| State: | 5.0% (104,636) |
Number of households with income $50k - 60k:| Pelham: | 6.0% (4,233) |
| Massachusetts: | 4.8% (99,486) |
Number of households with income $60k - 75k:| Pelham: | 8.6% (6,038) |
| State: | 7.5% (155,124) |
Number of households with income $75k - 100k:| Pelham: | 12.6% (8,822) |
| State: | 11.4% (236,252) |
Number of households with income $100k - 125k:| Pelham: | 11.8% (8,265) |
| State: | 9.9% (204,731) |
Number of households with income $125k - 150k:| Pelham: | 11.5% (8,099) |
| State: | 8.5% (175,324) |
Number of households with income $150k - 200k:| Pelham: | 10.6% (7,450) |
| State: | 11.7% (242,980) |
Number of households with income > $200k:| Pelham: | 10.2% (7,189) |
| Massachusetts: | 20.5% (425,966) |
Aggregate household income in Pelham in 2022: $112,097,922
Median family income in Pelham in 2022:| Pelham: | $140,479 |
| State: | $133,153 |
Number of families with income < $10k:| Pelham: | 0.6% (3) |
| State: | 2.0% (25,038) |
Number of families with income $10k - 20k:| Pelham: | 0.9% (6) |
| State: | 2.1% (26,403) |
Number of families with income $20k - 30k:| Pelham: | 1.2% (7) |
| Massachusetts: | 2.6% (32,525) |
Number of families with income $30k - 40k:| Pelham: | 1.6% (9) |
| Massachusetts: | 3.9% (48,079) |
Number of families with income $40k - 50k:| Pelham: | 2.5% (15) |
| State: | 3.8% (46,908) |
Number of families with income $50k - 60k:| Pelham: | 2.0% (12) |
| State: | 3.8% (46,476) |
Number of families with income $60k - 75k:| Pelham: | 4.0% (24) |
| Massachusetts: | 6.4% (79,040) |
Number of families with income $75k - 100k:| Pelham: | 6.9% (41) |
| Massachusetts: | 11.1% (137,395) |
Number of families with income $100k - 125k:| Pelham: | 14.3% (85) |
| State: | 11.1% (136,771) |
Number of families with income $125k - 150k:| Pelham: | 15.6% (93) |
| State: | 10.0% (123,709) |
Number of families with income $150k - 200k:| Pelham: | 19.1% (114) |
| State: | 14.7% (181,602) |
Number of families with income > $200k:| Pelham: | 31.2% (186) |
| State: | 28.5% (351,887) |
Median non-family income in Pelham in 2022:| Pelham: | $67,176 |
| State: | $59,323 |
Change in median non-family income between 2000 and 2022:| Pelham, Massachusetts: | +79.8% |
| Massachusetts: | +94.3% |
Median per capita income in Pelham in 2022:| Pelham: | $60,162 |
| State: | $60,804 |
Change in median per capita income between 2000 and 2022:| Pelham, Massachusetts: | +99.4% |
| Massachusetts: | +118.7% |
Income statistics for Black or African American residents
Median household income in Pelham, MA in 2022:| Pelham: | $74,050 |
| State: | $63,189 |
Change in median household income between 2000 and 2022:| Pelham, Massachusetts: | +62.3% |
| Massachusetts: | +87.4% |
Number of households with income < $10k:| Pelham: | 9.1% (21,370) |
| Massachusetts: | 9.1% (15,797) |
Number of households with income $10k - 20k:| Pelham: | 9.4% (22,006) |
| Massachusetts: | 9.4% (16,267) |
Number of households with income $20k - 30k:| Pelham: | 7.8% (18,289) |
| Massachusetts: | 7.8% (13,520) |
Number of households with income $30k - 40k:| Pelham: | 8.3% (19,496) |
| State: | 8.3% (14,412) |
Number of households with income $40k - 50k:| Pelham: | 7.9% (18,655) |
| State: | 7.9% (13,790) |
Number of households with income $50k - 60k:| Pelham: | 5.8% (13,583) |
| Massachusetts: | 5.8% (10,041) |
Number of households with income $60k - 75k:| Pelham: | 8.5% (20,051) |
| Massachusetts: | 8.5% (14,822) |
Number of households with income $75k - 100k:| Pelham: | 11.0% (25,868) |
| State: | 11.0% (19,122) |
Number of households with income $100k - 125k:| Pelham: | 8.4% (19,717) |
| Massachusetts: | 8.4% (14,575) |
Number of households with income $125k - 150k:| Pelham: | 6.0% (14,108) |
| State: | 6.0% (10,429) |
Number of households with income $150k - 200k:| Pelham: | 7.2% (16,962) |
| State: | 7.2% (12,539) |
Number of households with income > $200k:| Pelham: | 10.5% (24,600) |
| State: | 10.5% (18,185) |
Aggregate household income in Pelham in 2022: $773,130
Median family income in Pelham in 2022:| Pelham: | $131,345 |
| State: | $79,815 |
Median non-family income in Pelham in 2022:| Pelham: | $157,409 |
| State: | $38,934 |
Change in median non-family income between 2000 and 2022:| Pelham, Massachusetts: | +73.1% |
| State: | +69.2% |
Median per capita income in Pelham in 2022:| Pelham: | $55,330 |
| State: | $33,524 |
Change in median per capita income between 2000 and 2022:| Pelham, Massachusetts: | +124.2% |
| State: | +109.4% |
Income statistics for Asian residents
Median household income in Pelham, MA in 2022:| Pelham: | $48,518 |
| State: | $117,855 |
Change in median household income between 2000 and 2022:| Pelham, Massachusetts: | +128.3% |
| State: | +129.9% |
Number of households with income < $10k:| Pelham: | 6.8% (4,966) |
| State: | 6.8% (11,982) |
Number of households with income $10k - 20k:| Pelham: | 4.8% (3,472) |
| State: | 4.8% (8,376) |
Number of households with income $20k - 30k:| Pelham: | 3.7% (2,718) |
| Massachusetts: | 3.7% (6,558) |
Number of households with income $30k - 40k:| Pelham: | 3.3% (2,382) |
| State: | 3.3% (5,748) |
Number of households with income $40k - 50k:| Pelham: | 4.1% (2,980) |
| Massachusetts: | 4.1% (7,192) |
Number of households with income $50k - 60k:| Pelham: | 5.0% (3,620) |
| State: | 5.0% (8,734) |
Number of households with income $60k - 75k:| Pelham: | 5.8% (4,229) |
| State: | 5.8% (10,203) |
Number of households with income $75k - 100k:| Pelham: | 8.6% (6,281) |
| State: | 8.6% (15,154) |
Number of households with income $100k - 125k:| Pelham: | 10.8% (7,850) |
| Massachusetts: | 10.8% (18,942) |
Number of households with income $125k - 150k:| Pelham: | 8.0% (5,818) |
| Massachusetts: | 8.0% (14,037) |
Number of households with income $150k - 200k:| Pelham: | 12.5% (9,058) |
| State: | 12.5% (21,856) |
Number of households with income > $200k:| Pelham: | 26.6% (19,352) |
| State: | 26.6% (46,694) |
Aggregate household income in Pelham in 2022: $134,657
Median non-family income in Pelham in 2022:| Pelham: | $48,451 |
| Massachusetts: | $71,440 |
Change in median non-family income between 2000 and 2022:| Pelham, Massachusetts: | +128.0% |
| State: | +128.0% |
Median per capita income in Pelham in 2022:| Pelham: | $74,475 |
| State: | $58,900 |
Change in median per capita income between 2000 and 2022:| Pelham, Massachusetts: | +69.4% |
| State: | +174.6% |
Income statistics for Hispanic or Latino residents
Median household income in Pelham, MA in 2022:| Pelham: | $151,886 |
| Massachusetts: | $61,523 |
Change in median household income between 2000 and 2022:| Pelham, Massachusetts: | +77.7% |
| Massachusetts: | +125.4% |
Number of households with income < $10k:| Pelham: | 8.8% (79,248) |
| State: | 8.8% (25,307) |
Number of households with income $10k - 20k:| Pelham: | 10.0% (89,725) |
| State: | 10.0% (28,653) |
Number of households with income $20k - 30k:| Pelham: | 8.8% (78,878) |
| State: | 8.8% (25,189) |
Number of households with income $30k - 40k:| Pelham: | 7.2% (65,203) |
| State: | 7.2% (20,822) |
Number of households with income $40k - 50k:| Pelham: | 7.2% (65,188) |
| State: | 7.2% (20,817) |
Number of households with income $50k - 60k:| Pelham: | 6.5% (58,709) |
| State: | 6.5% (18,748) |
Number of households with income $60k - 75k:| Pelham: | 8.8% (79,508) |
| Massachusetts: | 8.8% (25,390) |
Number of households with income $75k - 100k:| Pelham: | 12.0% (107,998) |
| State: | 12.0% (34,488) |
Number of households with income $100k - 125k:| Pelham: | 8.6% (77,031) |
| State: | 8.6% (24,599) |
Number of households with income $125k - 150k:| Pelham: | 6.2% (55,562) |
| State: | 6.2% (17,743) |
Number of households with income $150k - 200k:| Pelham: | 7.3% (65,814) |
| State: | 7.3% (21,017) |
Number of households with income > $200k:| Pelham: | 8.6% (77,053) |
| Massachusetts: | 8.6% (24,606) |
Aggregate household income in Pelham in 2022: $1,029,370
Median family income in Pelham in 2022:| Pelham: | $255,387 |
| Massachusetts: | $66,072 |
Number of families with income < $10k:| Pelham: | 5.8% (3) |
| Massachusetts: | 6.2% (12,456) |
Number of families with income $10k - 20k:| Pelham: | 4.3% (2) |
| State: | 6.0% (12,071) |
Number of families with income $20k - 30k:| Pelham: | 7.1% (4) |
| Massachusetts: | 10.1% (20,376) |
Number of families with income $30k - 40k:| Pelham: | 5.1% (3) |
| Massachusetts: | 8.2% (16,470) |
Number of families with income $40k - 50k:| Pelham: | 7.5% (4) |
| State: | 7.4% (14,829) |
Number of families with income $50k - 60k:| Pelham: | 7.4% (4) |
| State: | 7.3% (14,643) |
Number of families with income $60k - 75k:| Pelham: | 12.8% (7) |
| State: | 10.6% (21,252) |
Number of families with income $75k - 100k:| Pelham: | 9.0% (5) |
| State: | 12.0% (24,088) |
Number of families with income $100k - 125k:| Pelham: | 11.8% (7) |
| Massachusetts: | 8.9% (17,954) |
Number of families with income $125k - 150k:| Pelham: | 8.8% (5) |
| State: | 6.9% (13,837) |
Number of families with income $150k - 200k:| Pelham: | 8.3% (5) |
| Massachusetts: | 7.3% (14,683) |
Number of families with income > $200k:| Pelham: | 11.9% (7) |
| State: | 9.3% (18,741) |
Median per capita income in Pelham in 2022:| Pelham: | $34,705 |
| Massachusetts: | $28,993 |
Change in median per capita income between 2000 and 2022:| Pelham, Massachusetts: | +129.7% |
| Massachusetts: | +142.4% |
Income statistics for American Indian and Alaska Native residents
Number of households with income < $10k:| Pelham: | 6.6% (227) |
| Massachusetts: | 6.6% (451) |
Number of households with income $10k - 20k:| Pelham: | 7.0% (240) |
| State: | 7.0% (476) |
Number of households with income $20k - 30k:| Pelham: | 2.8% (96) |
| State: | 2.8% (192) |
Number of households with income $30k - 40k:| Pelham: | 3.2% (110) |
| State: | 3.2% (218) |
Number of households with income $40k - 50k:| Pelham: | 2.9% (101) |
| State: | 2.9% (199) |
Number of households with income $50k - 60k:| Pelham: | 9.9% (341) |
| State: | 9.9% (677) |
Number of households with income $60k - 75k:| Pelham: | 11.5% (393) |
| State: | 11.5% (781) |
Number of households with income $75k - 100k:| Pelham: | 9.2% (317) |
| State: | 9.2% (629) |
Number of households with income $100k - 125k:| Pelham: | 5.9% (204) |
| State: | 6.0% (406) |
Number of households with income $125k - 150k:| Pelham: | 13.5% (464) |
| State: | 13.5% (921) |
Number of households with income $150k - 200k:| Pelham: | 12.6% (433) |
| Massachusetts: | 12.6% (859) |
Number of households with income > $200k:| Pelham: | 14.7% (505) |
| Massachusetts: | 14.7% (1,003) |
Median per capita income in Pelham in 2022:| Pelham: | $19,218 |
| State: | $39,434 |
Change in median per capita income between 2000 and 2022:| Pelham, Massachusetts: | +140.2% |
| Massachusetts: | +148.2% |
Income statistics for Multirace residents
Median household income in Pelham, MA in 2022:| Pelham: | $86,720 |
| State: | $71,552 |
Change in median household income between 2000 and 2022:| Pelham, Massachusetts: | +43.0% |
| Massachusetts: | +109.0% |
Number of households with income < $10k:| Pelham: | 6.6% (13,481) |
| Massachusetts: | 6.6% (15,127) |
Number of households with income $10k - 20k:| Pelham: | 9.3% (18,950) |
| State: | 9.2% (21,158) |
Number of households with income $20k - 30k:| Pelham: | 7.8% (15,972) |
| State: | 7.8% (18,016) |
Number of households with income $30k - 40k:| Pelham: | 8.0% (16,293) |
| State: | 7.9% (18,260) |
Number of households with income $40k - 50k:| Pelham: | 5.7% (11,562) |
| Massachusetts: | 5.6% (13,027) |
Number of households with income $50k - 60k:| Pelham: | 5.6% (11,446) |
| Massachusetts: | 5.6% (12,909) |
Number of households with income $60k - 75k:| Pelham: | 9.0% (18,410) |
| State: | 9.0% (20,800) |
Number of households with income $75k - 100k:| Pelham: | 12.1% (24,840) |
| State: | 12.1% (27,875) |
Number of households with income $100k - 125k:| Pelham: | 8.1% (16,596) |
| Massachusetts: | 8.1% (18,754) |
Number of households with income $125k - 150k:| Pelham: | 6.8% (13,830) |
| State: | 6.8% (15,621) |
Number of households with income $150k - 200k:| Pelham: | 9.2% (18,911) |
| Massachusetts: | 9.4% (21,618) |
Number of households with income > $200k:| Pelham: | 11.8% (24,219) |
| Massachusetts: | 12.0% (27,592) |
Aggregate household income in Pelham in 2022: $4,833,920
Median family income in Pelham in 2022:| Pelham: | $212,242 |
| State: | $78,380 |
Number of families with income $60k - 75k:| Pelham: | 26.1% (11) |
| State: | 10.3% (16,064) |
Number of families with income $125k - 150k:| Pelham: | 73.9% (31) |
| State: | 7.2% (11,128) |
Median non-family income in Pelham in 2022:| Pelham: | $167,482 |
| State: | $42,253 |
Median per capita income in Pelham in 2022:| Pelham: | $35,696 |
| State: | $34,029 |
Change in median per capita income between 2000 and 2022:| Pelham, Massachusetts: | +78.7% |
| State: | +132.1% |
Income statistics for other residents
Number of households with income < $10k:| Pelham: | 8.4% (7,013) |
| State: | 8.4% (11,559) |
Number of households with income $10k - 20k:| Pelham: | 8.4% (6,977) |
| State: | 8.4% (11,499) |
Number of households with income $20k - 30k:| Pelham: | 9.5% (7,930) |
| State: | 9.5% (13,070) |
Number of households with income $30k - 40k:| Pelham: | 6.0% (5,031) |
| Massachusetts: | 6.0% (8,291) |
Number of households with income $40k - 50k:| Pelham: | 9.2% (7,652) |
| Massachusetts: | 9.2% (12,611) |
Number of households with income $50k - 60k:| Pelham: | 7.9% (6,601) |
| State: | 7.9% (10,879) |
Number of households with income $60k - 75k:| Pelham: | 7.5% (6,212) |
| State: | 7.5% (10,239) |
Number of households with income $75k - 100k:| Pelham: | 13.1% (10,941) |
| State: | 13.1% (18,032) |
Number of households with income $100k - 125k:| Pelham: | 9.6% (7,973) |
| Massachusetts: | 9.6% (13,141) |
Number of households with income $125k - 150k:| Pelham: | 5.0% (4,131) |
| State: | 5.0% (6,808) |
Number of households with income $150k - 200k:| Pelham: | 6.4% (5,365) |
| State: | 6.4% (8,843) |
Number of households with income > $200k:| Pelham: | 9.0% (7,521) |
| State: | 9.0% (12,396) |
Median per capita income in Pelham in 2022:| Pelham: | $16,545 |
| State: | $30,797 |