The median household income in Ossining, NY in 2022 was $94,020, which was 15.4% greater than the median annual income of $79,557 across the entire state of New York. Compared to the median income of $52,185 in 2000 this represents an increase of 44.5%. The per capita income in 2022 was $49,724, which means an increase of 49.7% compared to 2000 when it was $25,036.
Whole page based on the data from 2000 / 2022 when the population of Ossining, New York was 24,010 / 26,873
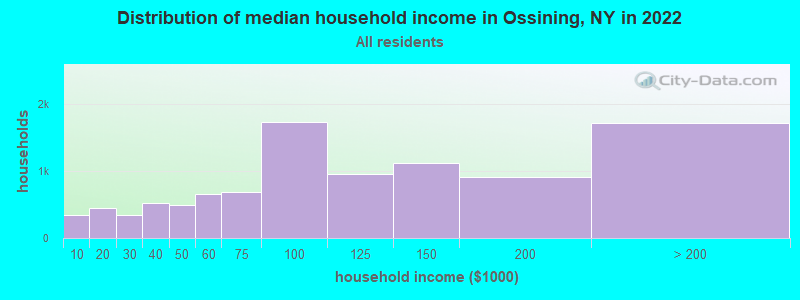
Income statistics for all residents
Median household income in Ossining, NY in 2022:
Ossining:
$94,021
State:
$79,557
Change in median household income between 2000 and 2022:
Ossining, New York:
+80.2%
State:
+83.3%
Number of households with income < $10k:
Ossining:
3.4% (337)
State:
6.8% (527,598)
Number of households with income $10k - 20k:
Ossining:
4.5% (444)
New York:
7.4% (574,940)
Number of households with income $20k - 30k:
Ossining:
3.5% (350)
State:
6.7% (517,718)
Number of households with income $30k - 40k:
Ossining:
5.2% (520)
State:
6.5% (506,674)
Number of households with income $40k - 50k:
Ossining:
4.9% (489)
New York:
6.1% (470,439)
Number of households with income $50k - 60k:
Ossining:
6.7% (662)
State:
5.8% (454,042)
Number of households with income $60k - 75k:
Ossining:
6.9% (688)
State:
8.5% (657,508)
Number of households with income $75k - 100k:
Ossining:
17.4% (1,729)
State:
11.6% (899,824)
Number of households with income $100k - 125k:
Ossining:
9.7% (959)
State:
9.3% (723,825)
Number of households with income $125k - 150k:
Ossining:
11.3% (1,119)
State:
7.1% (552,420)
Number of households with income $150k - 200k:
Ossining:
9.2% (912)
State:
9.4% (727,051)
Number of households with income > $200k:
Ossining:
17.3% (1,718)
State:
15.0% (1,162,269)
Aggregate household income in Ossining in 2022: $1,325,517,859
Median family income in Ossining in 2022:
Ossining:
$115,269
State:
$99,066
Number of families with income < $10k:
Ossining:
1.6% (102)
State:
4.2% (197,409)
Number of families with income $10k - 20k:
Ossining:
3.9% (253)
New York:
4.3% (205,373)
Number of families with income $20k - 30k:
Ossining:
1.9% (121)
State:
5.1% (241,229)
Number of families with income $30k - 40k:
Ossining:
4.5% (292)
State:
5.5% (259,233)
Number of families with income $40k - 50k:
Ossining:
3.5% (230)
State:
5.5% (259,113)
Number of families with income $50k - 60k:
Ossining:
9.2% (598)
State:
5.4% (255,320)
Number of families with income $60k - 75k:
Ossining:
6.8% (442)
New York:
8.2% (388,624)
Number of families with income $75k - 100k:
Ossining:
14.5% (943)
State:
12.3% (583,110)
Number of families with income $100k - 125k:
Ossining:
11.2% (726)
State:
10.6% (500,579)
Number of families with income $125k - 150k:
Ossining:
12.5% (814)
New York:
8.5% (400,594)
Number of families with income $150k - 200k:
Ossining:
9.8% (637)
State:
11.6% (551,650)
Number of families with income > $200k:
Ossining:
20.6% (1,339)
State:
18.9% (895,998)
Median non-family income in Ossining in 2022:
Ossining:
$71,007
State:
$50,181
Change in median non-family income between 2000 and 2022:
Ossining, New York:
+99.9%
State:
+85.4%
Median per capita income in Ossining in 2022:
Ossining:
$49,724
State:
$47,421
Change in median per capita income between 2000 and 2022:
Ossining, New York:
+98.6%
State:
+102.7%
Income statistics for White residents
Median household income in Ossining, NY in 2022:
Ossining:
$112,048
State:
$89,408
Change in median household income between 2000 and 2022:
Ossining, New York:
+94.6%
State:
+85.5%
Number of households with income < $10k:
Ossining:
2.3% (128)
State:
4.8% (225,550)
Number of households with income $10k - 20k:
Ossining:
4.7% (263)
New York:
6.1% (289,425)
Number of households with income $20k - 30k:
Ossining:
2.8% (155)
New York:
5.9% (280,254)
Number of households with income $30k - 40k:
Ossining:
7.8% (435)
State:
6.1% (288,263)
Number of households with income $40k - 50k:
Ossining:
3.0% (169)
State:
5.9% (278,079)
Number of households with income $50k - 60k:
Ossining:
5.1% (285)
State:
5.7% (267,554)
Number of households with income $60k - 75k:
Ossining:
4.6% (256)
State:
8.4% (398,344)
Number of households with income $75k - 100k:
Ossining:
14.0% (782)
State:
11.8% (554,841)
Number of households with income $100k - 125k:
Ossining:
13.3% (747)
New York:
10.0% (469,794)
Number of households with income $125k - 150k:
Ossining:
11.5% (641)
State:
7.6% (360,467)
Number of households with income $150k - 200k:
Ossining:
10.1% (563)
New York:
10.1% (477,078)
Number of households with income > $200k:
Ossining:
21.0% (1,174)
New York:
17.6% (829,233)
Aggregate household income in Ossining in 2022: $877,717,726
Median family income in Ossining in 2022:
Ossining:
$130,460
New York:
$115,170
Number of families with income < $10k:
Ossining:
0.7% (25)
State:
2.5% (68,851)
Number of families with income $10k - 20k:
Ossining:
3.6% (127)
State:
3.0% (83,127)
Number of families with income $20k - 30k:
Ossining:
0.8% (27)
New York:
3.5% (97,578)
Number of families with income $30k - 40k:
Ossining:
5.0% (175)
New York:
4.1% (114,108)
Number of families with income $40k - 50k:
Ossining:
0.8% (29)
New York:
4.7% (130,902)
Number of families with income $50k - 60k:
Ossining:
4.1% (143)
State:
4.9% (135,118)
Number of families with income $60k - 75k:
Ossining:
5.8% (203)
New York:
7.8% (216,254)
Number of families with income $75k - 100k:
Ossining:
13.7% (480)
State:
12.4% (342,382)
Number of families with income $100k - 125k:
Ossining:
14.4% (505)
New York:
11.4% (314,917)
Number of families with income $125k - 150k:
Ossining:
10.9% (381)
New York:
9.4% (260,489)
Number of families with income $150k - 200k:
Ossining:
12.3% (431)
New York:
13.2% (365,586)
Number of families with income > $200k:
Ossining:
28.0% (981)
State:
23.2% (642,319)
Median non-family income in Ossining in 2022:
Ossining:
$76,176
New York:
$54,783
Change in median non-family income between 2000 and 2022:
Ossining, New York:
+87.6%
State:
+87.9%
Median per capita income in Ossining in 2022:
Ossining:
$70,838
New York:
$57,640
Change in median per capita income between 2000 and 2022:
Ossining, New York:
+124.2%
State:
+111.6%
Income statistics for Black or African American residents
Median household income in Ossining, NY in 2022:
Ossining:
$79,413
New York:
$57,898
Change in median household income between 2000 and 2022:
Ossining, New York:
+116.5%
State:
+84.6%
Number of households with income < $10k:
Ossining:
22.0% (181)
New York:
12.0% (128,500)
Number of households with income $10k - 20k:
Ossining:
4.0% (33)
State:
10.0% (107,541)
Number of households with income $20k - 30k:
Ossining:
8.5% (70)
State:
8.4% (90,192)
Number of households with income $30k - 40k:
Ossining:
1.0% (8)
New York:
7.4% (79,579)
Number of households with income $40k - 50k:
Ossining:
2.1% (17)
New York:
6.8% (72,491)
Number of households with income $50k - 60k:
Ossining:
10.0% (82)
New York:
6.7% (71,309)
Number of households with income $60k - 75k:
Ossining:
3.7% (30)
State:
8.9% (95,050)
Number of households with income $75k - 100k:
Ossining:
15.5% (127)
State:
11.5% (123,569)
Number of households with income $100k - 125k:
Ossining:
6.0% (49)
New York:
8.1% (86,632)
Number of households with income $125k - 150k:
Ossining:
12.3% (101)
State:
6.0% (64,788)
Number of households with income $150k - 200k:
Ossining:
6.9% (57)
State:
7.2% (76,644)
Number of households with income > $200k:
Ossining:
8.0% (66)
State:
7.0% (75,062)
Aggregate household income in Ossining in 2022: $80,633,053
Median family income in Ossining in 2022:
Ossining:
$111,840
State:
$72,528
Number of families with income < $10k:
Ossining:
19.2% (82)
State:
8.6% (54,100)
Number of families with income $10k - 20k:
Ossining:
7.2% (31)
New York:
6.6% (41,506)
Number of families with income $20k - 30k:
Ossining:
7.6% (32)
State:
7.0% (44,139)
Number of families with income $60k - 75k:
Ossining:
2.3% (10)
State:
9.2% (57,626)
Number of families with income $75k - 100k:
Ossining:
17.7% (75)
State:
12.6% (78,986)
Number of families with income $100k - 125k:
Ossining:
5.6% (24)
State:
9.8% (61,670)
Number of families with income $125k - 150k:
Ossining:
20.4% (87)
State:
7.5% (47,050)
Number of families with income $150k - 200k:
Ossining:
5.2% (22)
State:
9.4% (59,260)
Number of families with income > $200k:
Ossining:
14.7% (62)
State:
9.3% (58,575)
Median non-family income in Ossining in 2022:
Ossining:
$62,329
State:
$37,265
Median per capita income in Ossining in 2022:
Ossining:
$32,893
State:
$31,947
Change in median per capita income between 2000 and 2022:
Ossining, New York:
+117.9%
State:
+106.1%
Income statistics for Asian residents
Median household income in Ossining, NY in 2022:
Ossining:
$168,310
State:
$89,947
Change in median household income between 2000 and 2022:
Ossining, New York:
+118.5%
New York:
+98.1%
Number of households with income < $10k:
Ossining:
1.9% (9)
State:
6.9% (42,537)
Number of households with income $10k - 20k:
Ossining:
0.0% (0)
New York:
7.3% (44,745)
Number of households with income $20k - 30k:
Ossining:
0.0% (0)
State:
6.2% (38,249)
Number of households with income $30k - 40k:
Ossining:
0.0% (0)
State:
5.5% (33,993)
Number of households with income $40k - 50k:
Ossining:
0.0% (0)
State:
4.8% (29,795)
Number of households with income $50k - 60k:
Ossining:
3.5% (17)
State:
5.2% (32,100)
Number of households with income $60k - 75k:
Ossining:
7.9% (38)
State:
7.3% (44,615)
Number of households with income $75k - 100k:
Ossining:
12.1% (58)
State:
10.8% (66,687)
Number of households with income $100k - 125k:
Ossining:
1.7% (8)
State:
8.2% (50,233)
Number of households with income $125k - 150k:
Ossining:
10.4% (50)
State:
7.2% (44,299)
Number of households with income $150k - 200k:
Ossining:
28.8% (138)
State:
10.4% (63,837)
Number of households with income > $200k:
Ossining:
33.8% (162)
State:
20.1% (123,891)
Aggregate household income in Ossining in 2022: $74,728,749
Median family income in Ossining in 2022:
Ossining:
$184,480
State:
$98,136
Number of families with income $50k - 60k:
Ossining:
3.7% (12)
State:
5.5% (24,015)
Number of families with income $60k - 75k:
Ossining:
6.1% (19)
State:
7.6% (33,120)
Number of families with income $75k - 100k:
Ossining:
16.6% (52)
New York:
10.7% (46,726)
Number of families with income $100k - 125k:
Ossining:
2.1% (7)
State:
8.6% (37,796)
Number of families with income $125k - 150k:
Ossining:
10.7% (34)
New York:
7.3% (31,893)
Number of families with income $150k - 200k:
Ossining:
29.6% (93)
State:
11.0% (48,177)
Number of families with income > $200k:
Ossining:
31.2% (98)
State:
22.2% (97,322)
Median per capita income in Ossining in 2022:
Ossining:
$55,816
New York:
$46,726
Change in median per capita income between 2000 and 2022:
Ossining, New York:
+106.5%
State:
+126.6%
Income statistics for Hispanic or Latino residents
Median household income in Ossining, NY in 2022:
Ossining:
$73,555
State:
$60,468
Change in median household income between 2000 and 2022:
Ossining, New York:
+76.1%
State:
+98.3%
Number of households with income < $10k:
Ossining:
2.0% (68)
State:
9.9% (127,185)
Number of households with income $10k - 20k:
Ossining:
7.3% (249)
State:
10.7% (136,699)
Number of households with income $20k - 30k:
Ossining:
4.5% (152)
New York:
8.1% (102,991)
Number of households with income $30k - 40k:
Ossining:
1.5% (50)
New York:
7.8% (100,149)
Number of households with income $40k - 50k:
Ossining:
6.3% (213)
State:
6.9% (87,760)
Number of households with income $50k - 60k:
Ossining:
9.0% (305)
New York:
6.3% (80,968)
Number of households with income $60k - 75k:
Ossining:
12.3% (418)
New York:
8.7% (110,631)
Number of households with income $75k - 100k:
Ossining:
23.3% (791)
State:
11.2% (142,787)
Number of households with income $100k - 125k:
Ossining:
11.2% (382)
State:
8.2% (104,850)
Number of households with income $125k - 150k:
Ossining:
8.9% (304)
New York:
6.3% (80,274)
Number of households with income $150k - 200k:
Ossining:
4.6% (157)
State:
7.4% (95,117)
Number of households with income > $200k:
Ossining:
9.2% (313)
State:
8.6% (109,514)
Aggregate household income in Ossining in 2022: $339,550,618
Median family income in Ossining in 2022:
Ossining:
$79,528
State:
$68,770
Number of families with income $10k - 20k:
Ossining:
9.5% (260)
State:
7.0% (59,058)
Number of families with income $20k - 30k:
Ossining:
3.6% (98)
State:
8.0% (68,048)
Number of families with income $30k - 40k:
Ossining:
3.1% (86)
New York:
8.4% (70,668)
Number of families with income $40k - 50k:
Ossining:
7.9% (217)
State:
7.4% (62,941)
Number of families with income $50k - 60k:
Ossining:
15.1% (416)
State:
6.6% (55,592)
Number of families with income $60k - 75k:
Ossining:
8.6% (236)
State:
9.3% (78,564)
Number of families with income $75k - 100k:
Ossining:
14.1% (389)
State:
12.6% (106,685)
Number of families with income $100k - 125k:
Ossining:
15.1% (415)
State:
9.4% (79,139)
Number of families with income $125k - 150k:
Ossining:
12.0% (331)
State:
6.9% (58,255)
Number of families with income $150k - 200k:
Ossining:
3.2% (87)
State:
8.3% (69,877)
Number of families with income > $200k:
Ossining:
7.8% (213)
State:
9.3% (78,555)
Median non-family income in Ossining in 2022:
Ossining:
$62,953
State:
$34,000
Change in median non-family income between 2000 and 2022:
Ossining, New York:
+97.1%
State:
+93.9%
Median per capita income in Ossining in 2022:
Ossining:
$29,601
New York:
$29,761
Change in median per capita income between 2000 and 2022:
Ossining, New York:
+140.2%
State:
+132.7%
Income statistics for American Indian and Alaska Native residents
Number of households with income < $10k:
Ossining:
0.0% (0)
New York:
8.6% (3,559)
Number of households with income $10k - 20k:
Ossining:
0.0% (0)
State:
5.9% (2,455)
Number of households with income $20k - 30k:
Ossining:
0.0% (0)
State:
8.2% (3,393)
Number of households with income $30k - 40k:
Ossining:
0.0% (0)
State:
11.9% (4,918)
Number of households with income $40k - 50k:
Ossining:
0.0% (0)
State:
6.5% (2,682)
Number of households with income $50k - 60k:
Ossining:
0.0% (0)
New York:
6.1% (2,516)
Number of households with income $60k - 75k:
Ossining:
0.0% (0)
State:
10.0% (4,125)
Number of households with income $75k - 100k:
Ossining:
0.0% (0)
State:
13.3% (5,517)
Number of households with income $100k - 125k:
Ossining:
0.0% (0)
State:
8.4% (3,463)
Number of households with income $125k - 150k:
Ossining:
0.0% (0)
New York:
7.0% (2,887)
Number of households with income $150k - 200k:
Ossining:
0.0% (0)
State:
9.9% (4,106)
Number of households with income > $200k:
Ossining:
100.0% (25)
New York:
4.2% (1,744)
Aggregate household income in Ossining in 2022: $12,112,534
Median per capita income in Ossining in 2022:
Ossining:
$67,211
State:
$25,837
Income statistics for Multirace residents
Median household income in Ossining, NY in 2022:
Ossining:
$74,781
State:
$73,557
Change in median household income between 2000 and 2022:
Ossining, New York:
+88.7%
State:
+123.9%
Number of households with income < $10k:
Ossining:
0.0% (0)
State:
8.9% (57,924)
Number of households with income $10k - 20k:
Ossining:
4.2% (49)
State:
8.7% (56,590)
Number of households with income $20k - 30k:
Ossining:
1.3% (15)
New York:
7.1% (46,287)
Number of households with income $30k - 40k:
Ossining:
0.0% (0)
State:
6.9% (45,132)
Number of households with income $40k - 50k:
Ossining:
7.2% (83)
New York:
5.8% (37,946)
Number of households with income $50k - 60k:
Ossining:
9.2% (106)
State:
5.6% (36,410)
Number of households with income $60k - 75k:
Ossining:
8.2% (95)
State:
7.8% (50,819)
Number of households with income $75k - 100k:
Ossining:
37.9% (437)
State:
11.7% (76,024)
Number of households with income $100k - 125k:
Ossining:
2.5% (29)
New York:
9.3% (60,635)
Number of households with income $125k - 150k:
Ossining:
17.3% (199)
State:
6.2% (40,533)
Number of households with income $150k - 200k:
Ossining:
2.0% (23)
State:
8.6% (56,409)
Number of households with income > $200k:
Ossining:
10.1% (117)
New York:
13.4% (87,442)
Aggregate household income in Ossining in 2022: $116,959,775
Median family income in Ossining in 2022:
Ossining:
$82,048
State:
$85,788
Number of families with income $40k - 50k:
Ossining:
2.5% (21)
State:
6.1% (24,694)
Number of families with income $50k - 60k:
Ossining:
17.9% (153)
State:
5.5% (22,002)
Number of families with income $60k - 75k:
Ossining:
5.1% (43)
State:
7.6% (30,653)
Number of families with income $75k - 100k:
Ossining:
38.2% (326)
State:
12.9% (51,995)
Number of families with income $100k - 125k:
Ossining:
1.3% (11)
State:
10.7% (43,036)
Number of families with income $125k - 150k:
Ossining:
20.8% (178)
New York:
7.1% (28,583)
Number of families with income $150k - 200k:
Ossining:
2.5% (21)
New York:
9.4% (37,771)
Number of families with income > $200k:
Ossining:
11.9% (101)
State:
15.7% (62,951)
Median per capita income in Ossining in 2022:
Ossining:
$33,934
State:
$36,931
Income statistics for other residents
Median household income in Ossining, NY in 2022:
Ossining:
$73,080
New York:
$56,210
Number of households with income < $10k:
Ossining:
0.0% (0)
State:
10.3% (69,252)
Number of households with income $10k - 20k:
Ossining:
4.1% (80)
New York:
11.0% (73,890)
Number of households with income $20k - 30k:
Ossining:
6.8% (134)
State:
8.8% (59,096)
Number of households with income $30k - 40k:
Ossining:
1.8% (35)
New York:
8.1% (54,418)
Number of households with income $40k - 50k:
Ossining:
11.1% (219)
State:
7.3% (49,042)
Number of households with income $50k - 60k:
Ossining:
9.9% (195)
State:
6.5% (43,945)
Number of households with income $60k - 75k:
Ossining:
16.0% (315)
New York:
9.5% (64,087)
Number of households with income $75k - 100k:
Ossining:
22.2% (437)
State:
10.9% (73,094)
Number of households with income $100k - 125k:
Ossining:
3.7% (72)
New York:
7.9% (53,055)
Number of households with income $125k - 150k:
Ossining:
7.7% (152)
State:
5.9% (39,446)
Number of households with income $150k - 200k:
Ossining:
5.8% (115)
State:
7.2% (48,653)
Number of households with income > $200k:
Ossining:
10.8% (212)
New York:
6.6% (44,703)
Aggregate household income in Ossining in 2022: $190,027,579
Median family income in Ossining in 2022:
Ossining:
$57,461
State:
$63,465
Number of families with income $10k - 20k:
Ossining:
4.8% (73)
State:
7.4% (34,598)
Number of families with income $20k - 30k:
Ossining:
5.3% (81)
State:
9.2% (43,198)
Number of families with income $30k - 40k:
Ossining:
4.6% (70)
State:
9.5% (44,688)
Number of families with income $40k - 50k:
Ossining:
14.0% (213)
New York:
7.8% (36,771)
Number of families with income $50k - 60k:
Ossining:
19.0% (288)
New York:
7.1% (33,324)
Number of families with income $60k - 75k:
Ossining:
13.1% (199)
New York:
10.1% (47,546)
Number of families with income $75k - 100k:
Ossining:
7.5% (114)
State:
12.5% (58,659)
Number of families with income $100k - 125k:
Ossining:
8.8% (133)
New York:
8.6% (40,211)
Number of families with income $125k - 150k:
Ossining:
11.7% (179)
New York:
6.5% (30,363)
Number of families with income $150k - 200k:
Ossining:
4.6% (70)
State:
7.9% (37,167)
Number of families with income > $200k:
Ossining:
6.7% (101)
New York:
7.2% (33,950)
Median non-family income in Ossining in 2022:
Ossining:
$63,859
New York:
$26,983
Change in median non-family income between 2000 and 2022:
Ossining, New York:
+97.8%
State:
+66.4%
Median per capita income in Ossining in 2022:
Ossining:
$27,954
State:
$26,975
Change in median per capita income between 2000 and 2022:
Ossining, New York:
+127.0%
State:
+144.6%
Discuss Ossining, New York (NY) on our hugely popular New York forum.