Onondaga, New York (NY) income map, earnings map, and wages data
The median household income in Onondaga, NY in 2022 was $92,814, which was 14.3% greater than the median annual income of $79,557 across the entire state of New York. Compared to the median income of $53,421 in 2000 this represents an increase of 42.4%. The per capita income in 2022 was $47,620, which means an increase of 46.4% compared to 2000 when it was $25,522.
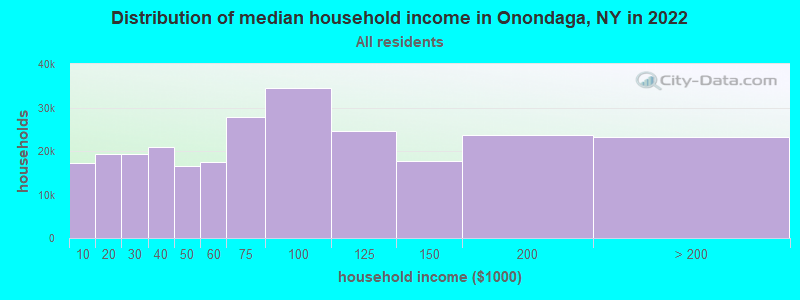
Income statistics for all residents
Median household income in Onondaga, NY in 2022:| Onondaga: | $92,814 |
| New York: | $79,557 |
Change in median household income between 2000 and 2022:| Onondaga, New York: | +73.7% |
| New York: | +83.3% |
Number of households with income < $10k:| Onondaga: | 6.6% (17,331) |
| New York: | 6.8% (527,598) |
Number of households with income $10k - 20k:| Onondaga: | 7.3% (19,197) |
| State: | 7.4% (574,940) |
Number of households with income $20k - 30k:| Onondaga: | 7.4% (19,285) |
| New York: | 6.7% (517,718) |
Number of households with income $30k - 40k:| Onondaga: | 8.0% (20,914) |
| State: | 6.5% (506,674) |
Number of households with income $40k - 50k:| Onondaga: | 6.3% (16,461) |
| State: | 6.1% (470,439) |
Number of households with income $50k - 60k:| Onondaga: | 6.7% (17,533) |
| State: | 5.8% (454,042) |
Number of households with income $60k - 75k:| Onondaga: | 10.6% (27,825) |
| State: | 8.5% (657,508) |
Number of households with income $75k - 100k:| Onondaga: | 13.1% (34,374) |
| New York: | 11.6% (899,824) |
Number of households with income $100k - 125k:| Onondaga: | 9.4% (24,645) |
| State: | 9.3% (723,825) |
Number of households with income $125k - 150k:| Onondaga: | 6.7% (17,639) |
| New York: | 7.1% (552,420) |
Number of households with income $150k - 200k:| Onondaga: | 9.0% (23,609) |
| State: | 9.4% (727,051) |
Number of households with income > $200k:| Onondaga: | 8.9% (23,200) |
| State: | 15.0% (1,162,269) |
Aggregate household income in Onondaga in 2022: $4,552,202,221
Median family income in Onondaga in 2022:| Onondaga: | $115,559 |
| State: | $99,066 |
Median non-family income in Onondaga in 2022:| Onondaga: | $53,189 |
| State: | $50,181 |
Change in median non-family income between 2000 and 2022:| Onondaga, New York: | +87.2% |
| New York: | +85.4% |
Median per capita income in Onondaga in 2022:| Onondaga: | $47,620 |
| State: | $47,421 |
Change in median per capita income between 2000 and 2022:| Onondaga, New York: | +86.6% |
| State: | +102.7% |
Income statistics for White residents
Median household income in Onondaga, NY in 2022:| Onondaga: | $94,152 |
| New York: | $89,408 |
Change in median household income between 2000 and 2022:| Onondaga, New York: | +75.2% |
| State: | +85.5% |
Number of households with income < $10k:| Onondaga: | 5.3% (10,388) |
| New York: | 4.8% (225,550) |
Number of households with income $10k - 20k:| Onondaga: | 6.3% (12,391) |
| New York: | 6.1% (289,425) |
Number of households with income $20k - 30k:| Onondaga: | 6.1% (11,988) |
| New York: | 5.9% (280,254) |
Number of households with income $30k - 40k:| Onondaga: | 7.4% (14,484) |
| State: | 6.1% (288,263) |
Number of households with income $40k - 50k:| Onondaga: | 6.4% (12,637) |
| New York: | 5.9% (278,079) |
Number of households with income $50k - 60k:| Onondaga: | 6.5% (12,748) |
| New York: | 5.7% (267,554) |
Number of households with income $60k - 75k:| Onondaga: | 11.1% (21,783) |
| State: | 8.4% (398,344) |
Number of households with income $75k - 100k:| Onondaga: | 13.7% (27,050) |
| State: | 11.8% (554,841) |
Number of households with income $100k - 125k:| Onondaga: | 10.0% (19,611) |
| New York: | 10.0% (469,794) |
Number of households with income $125k - 150k:| Onondaga: | 7.5% (14,779) |
| State: | 7.6% (360,467) |
Number of households with income $150k - 200k:| Onondaga: | 9.8% (19,306) |
| New York: | 10.1% (477,078) |
Number of households with income > $200k:| Onondaga: | 10.0% (19,616) |
| New York: | 17.6% (829,233) |
Aggregate household income in Onondaga in 2022: $3,681,664,023
Median family income in Onondaga in 2022:| Onondaga: | $118,892 |
| New York: | $115,170 |
Number of families with income < $10k:| Onondaga: | 0.9% (51) |
| New York: | 2.5% (68,851) |
Number of families with income $10k - 20k:| Onondaga: | 0.9% (54) |
| State: | 3.0% (83,127) |
Number of families with income $20k - 30k:| Onondaga: | 2.1% (121) |
| State: | 3.5% (97,578) |
Number of families with income $30k - 40k:| Onondaga: | 3.9% (225) |
| State: | 4.1% (114,108) |
Number of families with income $40k - 50k:| Onondaga: | 4.1% (236) |
| State: | 4.7% (130,902) |
Number of families with income $50k - 60k:| Onondaga: | 3.8% (216) |
| State: | 4.9% (135,118) |
Number of families with income $60k - 75k:| Onondaga: | 7.9% (457) |
| State: | 7.8% (216,254) |
Number of families with income $75k - 100k:| Onondaga: | 14.1% (809) |
| State: | 12.4% (342,382) |
Number of families with income $100k - 125k:| Onondaga: | 13.8% (795) |
| State: | 11.4% (314,917) |
Number of families with income $125k - 150k:| Onondaga: | 12.1% (695) |
| New York: | 9.4% (260,489) |
Number of families with income $150k - 200k:| Onondaga: | 21.1% (1,214) |
| State: | 13.2% (365,586) |
Number of families with income > $200k:| Onondaga: | 15.3% (882) |
| State: | 23.2% (642,319) |
Median non-family income in Onondaga in 2022:| Onondaga: | $58,667 |
| State: | $54,783 |
Change in median non-family income between 2000 and 2022:| Onondaga, New York: | +97.8% |
| State: | +87.9% |
Median per capita income in Onondaga in 2022:| Onondaga: | $50,475 |
| New York: | $57,640 |
Change in median per capita income between 2000 and 2022:| Onondaga, New York: | +95.4% |
| State: | +111.6% |
Income statistics for Black or African American residents
Median household income in Onondaga, NY in 2022:| Onondaga: | $91,300 |
| State: | $57,898 |
Change in median household income between 2000 and 2022:| Onondaga, New York: | +64.8% |
| State: | +84.6% |
Number of households with income < $10k:| Onondaga: | 15.2% (8,597) |
| State: | 12.0% (128,500) |
Number of households with income $10k - 20k:| Onondaga: | 11.7% (6,630) |
| State: | 10.0% (107,541) |
Number of households with income $20k - 30k:| Onondaga: | 17.1% (9,674) |
| New York: | 8.4% (90,192) |
Number of households with income $30k - 40k:| Onondaga: | 11.2% (6,302) |
| State: | 7.4% (79,579) |
Number of households with income $40k - 50k:| Onondaga: | 5.6% (3,166) |
| State: | 6.8% (72,491) |
Number of households with income $50k - 60k:| Onondaga: | 8.4% (4,762) |
| State: | 6.7% (71,309) |
Number of households with income $60k - 75k:| Onondaga: | 7.4% (4,163) |
| State: | 8.9% (95,050) |
Number of households with income $75k - 100k:| Onondaga: | 7.9% (4,469) |
| State: | 11.5% (123,569) |
Number of households with income $100k - 125k:| Onondaga: | 7.7% (4,370) |
| State: | 8.1% (86,632) |
Number of households with income $125k - 150k:| Onondaga: | 1.4% (787) |
| State: | 6.0% (64,788) |
Number of households with income $150k - 200k:| Onondaga: | 3.7% (2,075) |
| New York: | 7.2% (76,644) |
Number of households with income > $200k:| Onondaga: | 2.6% (1,473) |
| New York: | 7.0% (75,062) |
Aggregate household income in Onondaga in 2022: $19,924,545
Median family income in Onondaga in 2022:| Onondaga: | $143,318 |
| New York: | $72,528 |
Number of families with income $20k - 30k:| Onondaga: | 3.4% (6) |
| State: | 7.0% (44,139) |
Number of families with income $30k - 40k:| Onondaga: | 10.1% (18) |
| New York: | 6.9% (43,353) |
Number of families with income $40k - 50k:| Onondaga: | 10.4% (18) |
| State: | 6.6% (41,419) |
Number of families with income $50k - 60k:| Onondaga: | 6.0% (10) |
| State: | 6.3% (39,748) |
Number of families with income $60k - 75k:| Onondaga: | 10.3% (18) |
| New York: | 9.2% (57,626) |
Number of families with income $75k - 100k:| Onondaga: | 17.0% (29) |
| State: | 12.6% (78,986) |
Number of families with income $100k - 125k:| Onondaga: | 21.0% (37) |
| State: | 9.8% (61,670) |
Number of families with income $125k - 150k:| Onondaga: | 10.1% (17) |
| New York: | 7.5% (47,050) |
Number of families with income > $200k:| Onondaga: | 11.7% (20) |
| State: | 9.3% (58,575) |
Median non-family income in Onondaga in 2022:| Onondaga: | $57,793 |
| State: | $37,265 |
Change in median non-family income between 2000 and 2022:| Onondaga, New York: | +71.2% |
| New York: | +81.7% |
Median per capita income in Onondaga in 2022:| Onondaga: | $42,803 |
| State: | $31,947 |
Change in median per capita income between 2000 and 2022:| Onondaga, New York: | +111.1% |
| New York: | +106.1% |
Income statistics for Asian residents
Median household income in Onondaga, NY in 2022:| Onondaga: | $74,296 |
| State: | $89,947 |
Change in median household income between 2000 and 2022:| Onondaga, New York: | +67.4% |
| State: | +98.1% |
Number of households with income < $10k:| Onondaga: | 12.8% (811) |
| State: | 6.9% (42,537) |
Number of households with income $10k - 20k:| Onondaga: | 9.6% (610) |
| State: | 7.3% (44,745) |
Number of households with income $20k - 30k:| Onondaga: | 5.9% (376) |
| State: | 6.2% (38,249) |
Number of households with income $30k - 40k:| Onondaga: | 8.7% (551) |
| State: | 5.5% (33,993) |
Number of households with income $40k - 50k:| Onondaga: | 4.3% (275) |
| New York: | 4.8% (29,795) |
Number of households with income $50k - 60k:| Onondaga: | 13.9% (878) |
| State: | 5.2% (32,100) |
Number of households with income $60k - 75k:| Onondaga: | 11.3% (718) |
| New York: | 7.3% (44,615) |
Number of households with income $75k - 100k:| Onondaga: | 9.5% (599) |
| State: | 10.8% (66,687) |
Number of households with income $100k - 125k:| Onondaga: | 2.4% (154) |
| State: | 8.2% (50,233) |
Number of households with income $125k - 150k:| Onondaga: | 7.9% (500) |
| New York: | 7.2% (44,299) |
Number of households with income $150k - 200k:| Onondaga: | 6.8% (428) |
| State: | 10.4% (63,837) |
Number of households with income > $200k:| Onondaga: | 6.9% (435) |
| New York: | 20.1% (123,891) |
Aggregate household income in Onondaga in 2022: $26,297,060
Median family income in Onondaga in 2022:| Onondaga: | $82,999 |
| State: | $98,136 |
Number of families with income < $10k:| Onondaga: | 2.0% (6) |
| State: | 4.1% (18,020) |
Number of families with income $30k - 40k:| Onondaga: | 19.8% (57) |
| State: | 6.2% (26,994) |
Number of families with income $40k - 50k:| Onondaga: | 3.2% (9) |
| State: | 5.2% (22,750) |
Number of families with income $50k - 60k:| Onondaga: | 3.4% (10) |
| New York: | 5.5% (24,015) |
Number of families with income $60k - 75k:| Onondaga: | 3.9% (11) |
| State: | 7.6% (33,120) |
Number of families with income $75k - 100k:| Onondaga: | 12.7% (37) |
| State: | 10.7% (46,726) |
Number of families with income $100k - 125k:| Onondaga: | 10.1% (29) |
| State: | 8.6% (37,796) |
Number of families with income > $200k:| Onondaga: | 44.8% (129) |
| State: | 22.2% (97,322) |
Median non-family income in Onondaga in 2022:| Onondaga: | $5,105 |
| State: | $63,573 |
Change in median non-family income between 2000 and 2022:| Onondaga, New York: | +104.3% |
| State: | +101.1% |
Median per capita income in Onondaga in 2022:| Onondaga: | $27,591 |
| New York: | $46,726 |
Change in median per capita income between 2000 and 2022:| Onondaga, New York: | +29.6% |
| State: | +126.6% |
Income statistics for Hispanic or Latino residents
Median household income in Onondaga, NY in 2022:| Onondaga: | $211,494 |
| New York: | $60,468 |
Number of households with income < $10k:| Onondaga: | 7.9% (2,211) |
| State: | 9.9% (127,185) |
Number of households with income $10k - 20k:| Onondaga: | 13.2% (3,687) |
| New York: | 10.7% (136,699) |
Number of households with income $20k - 30k:| Onondaga: | 7.2% (2,023) |
| State: | 8.1% (102,991) |
Number of households with income $30k - 40k:| Onondaga: | 12.8% (3,579) |
| New York: | 7.8% (100,149) |
Number of households with income $40k - 50k:| Onondaga: | 3.9% (1,082) |
| New York: | 6.9% (87,760) |
Number of households with income $50k - 60k:| Onondaga: | 4.0% (1,105) |
| State: | 6.3% (80,968) |
Number of households with income $60k - 75k:| Onondaga: | 8.4% (2,359) |
| New York: | 8.7% (110,631) |
Number of households with income $75k - 100k:| Onondaga: | 12.6% (3,532) |
| New York: | 11.2% (142,787) |
Number of households with income $100k - 125k:| Onondaga: | 9.9% (2,764) |
| New York: | 8.2% (104,850) |
Number of households with income $125k - 150k:| Onondaga: | 6.4% (1,776) |
| State: | 6.3% (80,274) |
Number of households with income $150k - 200k:| Onondaga: | 6.4% (1,786) |
| State: | 7.4% (95,117) |
Number of households with income > $200k:| Onondaga: | 7.2% (2,022) |
| State: | 8.6% (109,514) |
Aggregate household income in Onondaga in 2022: $28,110,747
Median family income in Onondaga in 2022:| Onondaga: | $244,813 |
| New York: | $68,770 |
Number of families with income < $10k:| Onondaga: | 1.7% (4) |
| State: | 6.9% (58,565) |
Number of families with income $10k - 20k:| Onondaga: | 7.7% (20) |
| New York: | 7.0% (59,058) |
Number of families with income $20k - 30k:| Onondaga: | 9.0% (24) |
| New York: | 8.0% (68,048) |
Number of families with income $30k - 40k:| Onondaga: | 7.9% (21) |
| New York: | 8.4% (70,668) |
Number of families with income $40k - 50k:| Onondaga: | 1.9% (5) |
| New York: | 7.4% (62,941) |
Number of families with income $50k - 60k:| Onondaga: | 6.7% (18) |
| State: | 6.6% (55,592) |
Number of families with income $60k - 75k:| Onondaga: | 7.1% (19) |
| State: | 9.3% (78,564) |
Number of families with income $75k - 100k:| Onondaga: | 17.6% (46) |
| State: | 12.6% (106,685) |
Number of families with income $100k - 125k:| Onondaga: | 12.5% (33) |
| State: | 9.4% (79,139) |
Number of families with income $125k - 150k:| Onondaga: | 11.3% (30) |
| State: | 6.9% (58,255) |
Number of families with income $150k - 200k:| Onondaga: | 8.3% (22) |
| New York: | 8.3% (69,877) |
Number of families with income > $200k:| Onondaga: | 8.4% (22) |
| State: | 9.3% (78,555) |
Median non-family income in Onondaga in 2022:| Onondaga: | $78,058 |
| State: | $34,000 |
Median per capita income in Onondaga in 2022:| Onondaga: | $73,078 |
| State: | $29,761 |
Change in median per capita income between 2000 and 2022:| Onondaga, New York: | +138.6% |
| State: | +132.7% |
Income statistics for American Indian and Alaska Native residents
Median household income in Onondaga, NY in 2022:| Onondaga: | $41,412 |
| State: | $63,208 |
Change in median household income between 2000 and 2022:| Onondaga, New York: | +103.9% |
| State: | +110.1% |
Number of households with income < $10k:| Onondaga: | 8.6% (1,213) |
| State: | 8.6% (3,559) |
Number of households with income $10k - 20k:| Onondaga: | 6.0% (842) |
| State: | 5.9% (2,455) |
Number of households with income $20k - 30k:| Onondaga: | 8.2% (1,152) |
| State: | 8.2% (3,393) |
Number of households with income $30k - 40k:| Onondaga: | 11.9% (1,676) |
| State: | 11.9% (4,918) |
Number of households with income $40k - 50k:| Onondaga: | 6.4% (901) |
| State: | 6.5% (2,682) |
Number of households with income $50k - 60k:| Onondaga: | 6.0% (848) |
| State: | 6.1% (2,516) |
Number of households with income $60k - 75k:| Onondaga: | 9.9% (1,393) |
| New York: | 10.0% (4,125) |
Number of households with income $75k - 100k:| Onondaga: | 13.4% (1,884) |
| State: | 13.3% (5,517) |
Number of households with income $100k - 125k:| Onondaga: | 8.4% (1,176) |
| State: | 8.4% (3,463) |
Number of households with income $125k - 150k:| Onondaga: | 7.0% (989) |
| State: | 7.0% (2,887) |
Number of households with income $150k - 200k:| Onondaga: | 10.0% (1,409) |
| New York: | 9.9% (4,106) |
Number of households with income > $200k:| Onondaga: | 4.2% (595) |
| State: | 4.2% (1,744) |
Aggregate household income in Onondaga in 2022: $1,214,083
Median family income in Onondaga in 2022:| Onondaga: | $36,016 |
| State: | $69,721 |
Number of families with income < $10k:| Onondaga: | 27.8% (5) |
| State: | 8.3% (2,415) |
Number of families with income $10k - 20k:| Onondaga: | 10.9% (2) |
| State: | 2.6% (761) |
Number of families with income $20k - 30k:| Onondaga: | 61.4% (12) |
| State: | 6.2% (1,790) |
Median non-family income in Onondaga in 2022:| Onondaga: | $35,652 |
| State: | $33,910 |
Change in median non-family income between 2000 and 2022:| Onondaga, New York: | +83.2% |
| State: | +89.9% |
Median per capita income in Onondaga in 2022:| Onondaga: | $26,656 |
| State: | $25,837 |
Change in median per capita income between 2000 and 2022:| Onondaga, New York: | +67.7% |
| New York: | +99.6% |
Income statistics for Multirace residents
Median household income in Onondaga, NY in 2022:| Onondaga: | $117,824 |
| New York: | $73,557 |
Change in median household income between 2000 and 2022:| Onondaga, New York: | +141.7% |
| State: | +123.9% |
Number of households with income < $10k:| Onondaga: | 8.9% (1,844) |
| New York: | 8.9% (57,924) |
Number of households with income $10k - 20k:| Onondaga: | 11.6% (2,397) |
| State: | 8.7% (56,590) |
Number of households with income $20k - 30k:| Onondaga: | 7.5% (1,552) |
| State: | 7.1% (46,287) |
Number of households with income $30k - 40k:| Onondaga: | 6.9% (1,436) |
| State: | 6.9% (45,132) |
Number of households with income $40k - 50k:| Onondaga: | 6.1% (1,254) |
| State: | 5.8% (37,946) |
Number of households with income $50k - 60k:| Onondaga: | 4.8% (998) |
| New York: | 5.6% (36,410) |
Number of households with income $60k - 75k:| Onondaga: | 9.6% (1,993) |
| State: | 7.8% (50,819) |
Number of households with income $75k - 100k:| Onondaga: | 13.0% (2,693) |
| State: | 11.7% (76,024) |
Number of households with income $100k - 125k:| Onondaga: | 9.6% (1,981) |
| State: | 9.3% (60,635) |
Number of households with income $125k - 150k:| Onondaga: | 5.4% (1,122) |
| State: | 6.2% (40,533) |
Number of households with income $150k - 200k:| Onondaga: | 9.7% (2,004) |
| New York: | 8.6% (56,409) |
Number of households with income > $200k:| Onondaga: | 6.8% (1,398) |
| State: | 13.4% (87,442) |
Aggregate household income in Onondaga in 2022: $38,010,219
Median family income in Onondaga in 2022:| Onondaga: | $199,377 |
| State: | $85,788 |
Number of families with income < $10k:| Onondaga: | 3.7% (11) |
| New York: | 6.2% (24,976) |
Number of families with income $75k - 100k:| Onondaga: | 57.0% (175) |
| State: | 12.9% (51,995) |
Number of families with income > $200k:| Onondaga: | 39.3% (121) |
| New York: | 15.7% (62,951) |
Median non-family income in Onondaga in 2022:| Onondaga: | $62,555 |
| State: | $46,403 |
Median per capita income in Onondaga in 2022:| Onondaga: | $52,348 |
| State: | $36,931 |
Income statistics for other residents
Number of households with income < $10k:| Onondaga: | 10.8% (9) |
| New York: | 10.3% (69,252) |
Number of households with income $10k - 20k:| Onondaga: | 9.6% (8) |
| State: | 11.0% (73,890) |
Number of households with income $20k - 30k:| Onondaga: | 7.2% (6) |
| New York: | 8.8% (59,096) |
Number of households with income $30k - 40k:| Onondaga: | 7.2% (6) |
| State: | 8.1% (54,418) |
Number of households with income $40k - 50k:| Onondaga: | 8.4% (7) |
| State: | 7.3% (49,042) |
Number of households with income $50k - 60k:| Onondaga: | 6.0% (5) |
| State: | 6.5% (43,945) |
Number of households with income $60k - 75k:| Onondaga: | 9.6% (8) |
| State: | 9.5% (64,087) |
Number of households with income $75k - 100k:| Onondaga: | 10.8% (9) |
| State: | 10.9% (73,094) |
Number of households with income $100k - 125k:| Onondaga: | 8.4% (7) |
| State: | 7.9% (53,055) |
Number of households with income $125k - 150k:| Onondaga: | 4.8% (4) |
| New York: | 5.9% (39,446) |
Number of households with income $150k - 200k:| Onondaga: | 9.6% (8) |
| New York: | 7.2% (48,653) |
Number of households with income > $200k:| Onondaga: | 7.2% (6) |
| State: | 6.6% (44,703) |
Aggregate household income in Onondaga in 2022: $2,343,796
Median family income in Onondaga in 2022:| Onondaga: | $200,504 |
| State: | $63,465 |
Number of families with income $60k - 75k:| Onondaga: | 100.0% (18) |
| New York: | 10.1% (47,546) |
Median non-family income in Onondaga in 2022:| Onondaga: | $15,512 |
| New York: | $26,983 |
Change in median non-family income between 2000 and 2022:| Onondaga, New York: | +77.3% |
| New York: | +66.4% |
Median per capita income in Onondaga in 2022:| Onondaga: | $72,841 |
| State: | $26,975 |