The median household income in Oakland, MD in 2022 was $59,398, which was 59.9% less than the median annual income of $94,991 across the entire state of Maryland. Compared to the median income of $26,728 in 2000 this represents an increase of 55.0%. The per capita income in 2022 was $34,649, which means an increase of 51.3% compared to 2000 when it was $16,872.
Whole page based on the data from 2000 / 2022 when the population of Oakland, Maryland was 1,930 / 1,996
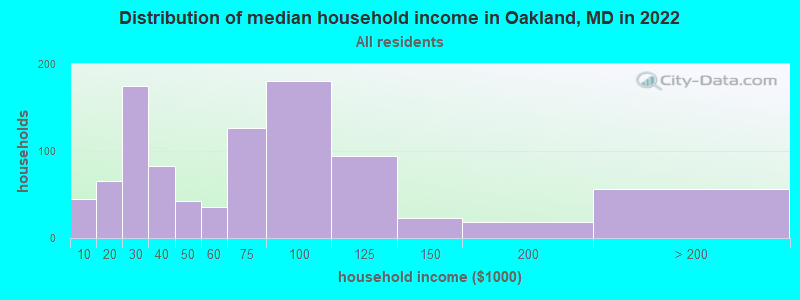
Income statistics for all residents
Median household income in Oakland, MD in 2022:
Oakland:
$59,398
Maryland:
$94,991
Change in median household income between 2000 and 2022:
Oakland, Maryland:
+122.2%
Maryland:
+79.7%
Number of households with income < $10k:
Oakland:
4.8% (45)
State:
4.8% (114,450)
Number of households with income $10k - 20k:
Oakland:
6.9% (65)
State:
5.0% (117,883)
Number of households with income $20k - 30k:
Oakland:
18.5% (175)
Maryland:
5.2% (123,350)
Number of households with income $30k - 40k:
Oakland:
8.8% (83)
State:
5.6% (134,104)
Number of households with income $40k - 50k:
Oakland:
4.4% (42)
State:
5.6% (132,932)
Number of households with income $50k - 60k:
Oakland:
3.8% (36)
Maryland:
5.6% (132,707)
Number of households with income $60k - 75k:
Oakland:
13.5% (127)
State:
7.9% (188,335)
Number of households with income $75k - 100k:
Oakland:
19.1% (180)
Maryland:
12.5% (297,873)
Number of households with income $100k - 125k:
Oakland:
10.0% (94)
State:
10.5% (250,497)
Number of households with income $125k - 150k:
Oakland:
2.4% (23)
State:
8.1% (193,208)
Number of households with income $150k - 200k:
Oakland:
1.9% (18)
State:
11.6% (274,905)
Number of households with income > $200k:
Oakland:
5.9% (56)
State:
17.5% (415,740)
Aggregate household income in Oakland in 2022: $65,656,449
Median family income in Oakland in 2022:
Oakland:
$76,835
Maryland:
$117,294
Number of families with income < $10k:
Oakland:
1.2% (6)
State:
2.7% (41,433)
Number of families with income $10k - 20k:
Oakland:
6.3% (30)
State:
2.6% (40,126)
Number of families with income $20k - 30k:
Oakland:
6.0% (29)
Maryland:
3.4% (52,891)
Number of families with income $30k - 40k:
Oakland:
8.6% (42)
State:
4.5% (70,252)
Number of families with income $40k - 50k:
Oakland:
2.0% (10)
Maryland:
4.8% (74,112)
Number of families with income $50k - 60k:
Oakland:
2.9% (14)
Maryland:
5.0% (77,590)
Number of families with income $60k - 75k:
Oakland:
16.2% (78)
Maryland:
7.1% (109,924)
Number of families with income $75k - 100k:
Oakland:
18.8% (91)
State:
12.0% (185,255)
Number of families with income $100k - 125k:
Oakland:
18.1% (88)
State:
11.2% (173,203)
Number of families with income $125k - 150k:
Oakland:
4.8% (23)
Maryland:
9.3% (143,453)
Number of families with income $150k - 200k:
Oakland:
3.6% (18)
State:
14.2% (218,861)
Number of families with income > $200k:
Oakland:
11.6% (56)
State:
23.2% (359,182)
Median non-family income in Oakland in 2022:
Oakland:
$31,573
State:
$57,179
Change in median non-family income between 2000 and 2022:
Oakland, Maryland:
+107.9%
State:
+75.1%
Median per capita income in Oakland in 2022:
Oakland:
$34,649
State:
$49,236
Change in median per capita income between 2000 and 2022:
Oakland, Maryland:
+105.4%
Maryland:
+92.2%
Income statistics for White residents
Median household income in Oakland, MD in 2022:
Oakland:
$59,879
Maryland:
$107,160
Change in median household income between 2000 and 2022:
Oakland, Maryland:
+124.0%
State:
+85.3%
Number of households with income < $10k:
Oakland:
4.9% (43)
State:
3.7% (47,387)
Number of households with income $10k - 20k:
Oakland:
7.3% (64)
Maryland:
4.1% (52,102)
Number of households with income $20k - 30k:
Oakland:
19.3% (169)
Maryland:
4.6% (58,758)
Number of households with income $30k - 40k:
Oakland:
8.5% (74)
State:
4.7% (59,745)
Number of households with income $40k - 50k:
Oakland:
4.0% (35)
State:
5.0% (62,576)
Number of households with income $50k - 60k:
Oakland:
4.0% (35)
State:
5.1% (64,484)
Number of households with income $60k - 75k:
Oakland:
14.3% (125)
Maryland:
7.7% (97,019)
Number of households with income $75k - 100k:
Oakland:
19.3% (169)
State:
11.8% (149,205)
Number of households with income $100k - 125k:
Oakland:
10.3% (90)
State:
10.6% (134,231)
Number of households with income $125k - 150k:
Oakland:
2.6% (23)
State:
8.8% (111,081)
Number of households with income $150k - 200k:
Oakland:
1.9% (17)
State:
12.9% (162,966)
Number of households with income > $200k:
Oakland:
3.5% (31)
Maryland:
20.9% (264,377)
Aggregate household income in Oakland in 2022: $58,005,578
Median family income in Oakland in 2022:
Oakland:
$76,250
State:
$134,708
Number of families with income < $10k:
Oakland:
1.1% (5)
State:
1.6% (13,064)
Number of families with income $10k - 20k:
Oakland:
7.2% (31)
Maryland:
2.0% (16,048)
Number of families with income $20k - 30k:
Oakland:
5.9% (26)
State:
2.2% (18,018)
Number of families with income $30k - 40k:
Oakland:
8.6% (37)
State:
3.3% (26,886)
Number of families with income $40k - 50k:
Oakland:
2.0% (9)
State:
3.6% (29,194)
Number of families with income $50k - 60k:
Oakland:
3.0% (13)
State:
4.1% (33,120)
Number of families with income $60k - 75k:
Oakland:
17.3% (75)
State:
6.6% (53,501)
Number of families with income $75k - 100k:
Oakland:
19.8% (86)
State:
11.3% (91,779)
Number of families with income $100k - 125k:
Oakland:
19.1% (83)
State:
11.3% (91,483)
Number of families with income $125k - 150k:
Oakland:
5.2% (22)
State:
9.9% (80,832)
Number of families with income $150k - 200k:
Oakland:
3.9% (17)
State:
16.0% (130,295)
Number of families with income > $200k:
Oakland:
7.0% (30)
State:
28.1% (228,324)
Median non-family income in Oakland in 2022:
Oakland:
$32,046
State:
$61,991
Change in median non-family income between 2000 and 2022:
Oakland, Maryland:
+111.0%
State:
+76.8%
Median per capita income in Oakland in 2022:
Oakland:
$33,937
State:
$59,750
Change in median per capita income between 2000 and 2022:
Oakland, Maryland:
+102.3%
State:
+104.5%
Income statistics for Black or African American residents
Median per capita income in Oakland in 2022:
Oakland:
$3,789
Maryland:
$40,756
Change in median per capita income between 2000 and 2022:: -58.4%
Oakland, Maryland:
-58.4%
State:
+113.5%
Income statistics for Asian residents
Number of households with income < $10k:
Oakland:
0.0% (0)
State:
4.6% (6,395)
Number of households with income $10k - 20k:
Oakland:
0.0% (0)
Maryland:
3.6% (4,994)
Number of households with income $20k - 30k:
Oakland:
0.0% (0)
Maryland:
4.6% (6,399)
Number of households with income $30k - 40k:
Oakland:
0.0% (0)
State:
3.4% (4,682)
Number of households with income $40k - 50k:
Oakland:
0.0% (0)
State:
4.6% (6,382)
Number of households with income $50k - 60k:
Oakland:
0.0% (0)
State:
4.6% (6,402)
Number of households with income $60k - 75k:
Oakland:
0.0% (0)
State:
5.4% (7,426)
Number of households with income $75k - 100k:
Oakland:
0.0% (0)
State:
11.1% (15,313)
Number of households with income $100k - 125k:
Oakland:
0.0% (0)
Maryland:
10.6% (14,640)
Number of households with income $125k - 150k:
Oakland:
0.0% (0)
State:
8.3% (11,465)
Number of households with income $150k - 200k:
Oakland:
0.0% (0)
Maryland:
13.4% (18,490)
Number of households with income > $200k:
Oakland:
100.0% (23)
State:
25.6% (35,377)
Aggregate household income in Oakland in 2022: $3,248,149
Median per capita income in Oakland in 2022:
Oakland:
$168,012
Maryland:
$53,546
Change in median per capita income between 2000 and 2022:
Oakland, Maryland:
+147.1%
State:
+122.9%
Income statistics for Hispanic or Latino residents
Median per capita income in Oakland in 2022:
Oakland:
$5,336
State:
$29,024
Change in median per capita income between 2000 and 2022:: -74.2%
Oakland, Maryland:
-74.2%
State:
+79.2%
Income statistics for Multirace residents
Median per capita income in Oakland in 2022:
Oakland:
$4,796
State:
$35,630
Change in median per capita income between 2000 and 2022:: -76.8%
Oakland, Maryland:
-76.8%
State:
+125.1%
Discuss Oakland, Maryland (MD) on our hugely popular Maryland forum.