North Stanwood, Washington (WA) income map, earnings map, and wages data
The median household income in North Stanwood, WA in 2022 was $111,356, which was 18.0% greater than the median annual income of $91,306 across the entire state of Washington. Compared to the median income of $58,194 in 2000 this represents an increase of 47.7%. The per capita income in 2022 was $52,895, which means an increase of 54.4% compared to 2000 when it was $24,128.
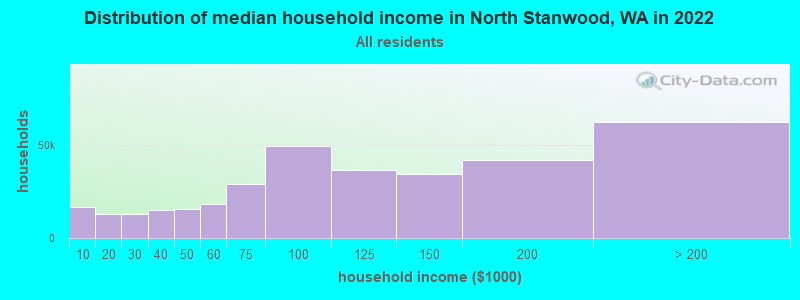
Income statistics for all residents
Median household income in North Stanwood, WA in 2022:| North Stanwood: | $111,356 |
| State: | $91,306 |
Change in median household income between 2000 and 2022:| North Stanwood, Washington: | +91.4% |
| Washington: | +99.5% |
Number of households with income < $10k:| North Stanwood: | 4.8% (16,497) |
| Washington: | 4.5% (139,331) |
Number of households with income $10k - 20k:| North Stanwood: | 3.8% (13,158) |
| State: | 5.0% (154,508) |
Number of households with income $20k - 30k:| North Stanwood: | 3.7% (12,771) |
| State: | 5.4% (166,555) |
Number of households with income $30k - 40k:| North Stanwood: | 4.3% (14,912) |
| State: | 5.5% (170,324) |
Number of households with income $40k - 50k:| North Stanwood: | 4.5% (15,633) |
| Washington: | 6.0% (183,941) |
Number of households with income $50k - 60k:| North Stanwood: | 5.3% (18,316) |
| Washington: | 6.1% (187,395) |
Number of households with income $60k - 75k:| North Stanwood: | 8.5% (29,291) |
| State: | 8.7% (266,771) |
Number of households with income $75k - 100k:| North Stanwood: | 14.3% (49,410) |
| State: | 13.1% (404,672) |
Number of households with income $100k - 125k:| North Stanwood: | 10.6% (36,449) |
| State: | 11.0% (337,911) |
Number of households with income $125k - 150k:| North Stanwood: | 9.9% (34,233) |
| Washington: | 8.0% (244,934) |
Number of households with income $150k - 200k:| North Stanwood: | 12.2% (42,188) |
| State: | 10.5% (323,812) |
Number of households with income > $200k:| North Stanwood: | 18.1% (62,499) |
| Washington: | 16.2% (499,799) |
Aggregate household income in North Stanwood in 2022: $194,869,319
Median family income in North Stanwood in 2022:| North Stanwood: | $131,074 |
| State: | $109,192 |
Median non-family income in North Stanwood in 2022:| North Stanwood: | $60,942 |
| State: | $57,299 |
Change in median non-family income between 2000 and 2022:| North Stanwood, Washington: | +89.1% |
| State: | +94.9% |
Median per capita income in North Stanwood in 2022:| North Stanwood: | $52,896 |
| State: | $50,764 |
Change in median per capita income between 2000 and 2022:| North Stanwood, Washington: | +119.2% |
| State: | +121.0% |
Income statistics for White residents
Median household income in North Stanwood, WA in 2022:| North Stanwood: | $110,295 |
| Washington: | $91,916 |
Change in median household income between 2000 and 2022:| North Stanwood, Washington: | +86.4% |
| State: | +95.4% |
Number of households with income < $10k:| North Stanwood: | 4.4% (11,066) |
| State: | 4.3% (95,850) |
Number of households with income $10k - 20k:| North Stanwood: | 3.9% (9,869) |
| State: | 4.8% (106,421) |
Number of households with income $20k - 30k:| North Stanwood: | 3.9% (9,923) |
| Washington: | 5.5% (122,860) |
Number of households with income $30k - 40k:| North Stanwood: | 4.2% (10,656) |
| Washington: | 5.4% (119,627) |
Number of households with income $40k - 50k:| North Stanwood: | 4.4% (11,050) |
| Washington: | 5.9% (132,276) |
Number of households with income $50k - 60k:| North Stanwood: | 5.9% (14,710) |
| State: | 6.1% (136,212) |
Number of households with income $60k - 75k:| North Stanwood: | 8.3% (20,813) |
| Washington: | 8.8% (196,086) |
Number of households with income $75k - 100k:| North Stanwood: | 14.9% (37,536) |
| State: | 13.4% (299,192) |
Number of households with income $100k - 125k:| North Stanwood: | 10.8% (27,052) |
| State: | 11.3% (252,209) |
Number of households with income $125k - 150k:| North Stanwood: | 9.6% (24,246) |
| State: | 7.9% (175,962) |
Number of households with income $150k - 200k:| North Stanwood: | 12.3% (31,000) |
| State: | 10.7% (239,156) |
Number of households with income > $200k:| North Stanwood: | 17.3% (43,503) |
| Washington: | 16.1% (359,917) |
Aggregate household income in North Stanwood in 2022: $136,180,776
Median family income in North Stanwood in 2022:| North Stanwood: | $131,471 |
| Washington: | $112,511 |
Number of families with income $20k - 30k:| North Stanwood: | 5.1% (4) |
| State: | 2.9% (39,288) |
Number of families with income $30k - 40k:| North Stanwood: | 4.4% (3) |
| State: | 3.6% (50,190) |
Number of families with income $40k - 50k:| North Stanwood: | 3.1% (2) |
| State: | 4.6% (63,009) |
Number of families with income $50k - 60k:| North Stanwood: | 7.6% (6) |
| Washington: | 5.0% (69,270) |
Number of families with income $60k - 75k:| North Stanwood: | 14.1% (11) |
| State: | 8.2% (112,369) |
Number of families with income $75k - 100k:| North Stanwood: | 28.6% (23) |
| State: | 14.1% (194,214) |
Number of families with income $100k - 125k:| North Stanwood: | 37.0% (29) |
| State: | 13.2% (182,184) |
Median non-family income in North Stanwood in 2022:| North Stanwood: | $85,145 |
| Washington: | $56,103 |
Change in median non-family income between 2000 and 2022:| North Stanwood, Washington: | +87.4% |
| Washington: | +87.7% |
Median per capita income in North Stanwood in 2022:| North Stanwood: | $58,449 |
| State: | $55,212 |
Change in median per capita income between 2000 and 2022:| North Stanwood, Washington: | +128.1% |
| State: | +123.8% |
Income statistics for Multirace residents
Median household income in North Stanwood, WA in 2022:| North Stanwood: | $48,328 |
| State: | $84,303 |
Change in median household income between 2000 and 2022:| North Stanwood, Washington: | +103.5% |
| State: | +125.7% |
Number of households with income < $10k:| North Stanwood: | 2.9% (329) |
| Washington: | 4.3% (12,040) |
Number of households with income $10k - 20k:| North Stanwood: | 5.9% (677) |
| Washington: | 6.6% (18,437) |
Number of households with income $20k - 30k:| North Stanwood: | 2.4% (277) |
| State: | 5.2% (14,559) |
Number of households with income $30k - 40k:| North Stanwood: | 5.3% (609) |
| Washington: | 6.7% (18,491) |
Number of households with income $40k - 50k:| North Stanwood: | 4.2% (484) |
| State: | 6.3% (17,459) |
Number of households with income $50k - 60k:| North Stanwood: | 4.5% (522) |
| Washington: | 6.9% (19,086) |
Number of households with income $60k - 75k:| North Stanwood: | 12.2% (1,398) |
| State: | 9.1% (25,310) |
Number of households with income $75k - 100k:| North Stanwood: | 11.1% (1,269) |
| Washington: | 13.5% (37,493) |
Number of households with income $100k - 125k:| North Stanwood: | 13.4% (1,543) |
| Washington: | 10.7% (29,626) |
Number of households with income $125k - 150k:| North Stanwood: | 11.9% (1,366) |
| Washington: | 8.6% (23,899) |
Number of households with income $150k - 200k:| North Stanwood: | 13.1% (1,503) |
| State: | 10.2% (28,214) |
Number of households with income > $200k:| North Stanwood: | 13.1% (1,505) |
| State: | 11.9% (32,947) |
Aggregate household income in North Stanwood in 2022: $1,629,715
Median non-family income in North Stanwood in 2022:| North Stanwood: | $54,193 |
| State: | $56,573 |
Change in median non-family income between 2000 and 2022:| North Stanwood, Washington: | +128.2% |
| Washington: | +115.0% |
Median per capita income in North Stanwood in 2022:| North Stanwood: | $9,282 |
| State: | $32,496 |
Change in median per capita income between 2000 and 2022:| North Stanwood, Washington: | +128.0% |
| State: | +156.8% |