The median household income in North Richland Hills, TX in 2022 was $82,005, which was 11.9% greater than the median annual income of $72,284 across the entire state of Texas. Compared to the median income of $56,150 in 2000 this represents an increase of 31.5%. The per capita income in 2022 was $44,966, which means an increase of 43.3% compared to 2000 when it was $25,516.
Whole page based on the data from 2000 / 2022 when the population of North Richland Hills, Texas was 55,635 / 70,666
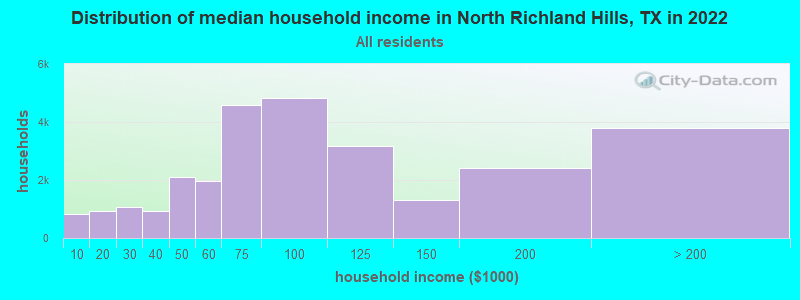
Income statistics for all residents
Median household income in North Richland Hills, TX in 2022:
North Richland Hills:
$82,005
State:
$72,284
Change in median household income between 2000 and 2022:
North Richland Hills, Texas:
+46.0%
Texas:
+81.0%
Number of households with income < $10k:
North Richland Hills:
2.9% (819)
State:
5.5% (611,011)
Number of households with income $10k - 20k:
North Richland Hills:
3.3% (936)
Texas:
6.7% (743,157)
Number of households with income $20k - 30k:
North Richland Hills:
3.8% (1,066)
State:
7.2% (803,381)
Number of households with income $30k - 40k:
North Richland Hills:
3.4% (939)
State:
7.8% (866,080)
Number of households with income $40k - 50k:
North Richland Hills:
7.6% (2,110)
Texas:
7.3% (810,440)
Number of households with income $50k - 60k:
North Richland Hills:
7.0% (1,964)
Texas:
7.2% (799,783)
Number of households with income $60k - 75k:
North Richland Hills:
16.4% (4,580)
Texas:
9.9% (1,095,384)
Number of households with income $75k - 100k:
North Richland Hills:
17.3% (4,837)
State:
12.8% (1,419,057)
Number of households with income $100k - 125k:
North Richland Hills:
11.3% (3,160)
State:
9.5% (1,054,577)
Number of households with income $125k - 150k:
North Richland Hills:
4.7% (1,323)
Texas:
6.7% (741,518)
Number of households with income $150k - 200k:
North Richland Hills:
8.7% (2,428)
State:
8.7% (961,776)
Number of households with income > $200k:
North Richland Hills:
13.5% (3,784)
State:
10.7% (1,181,544)
Aggregate household income in North Richland Hills in 2022: $3,117,503,700
Median family income in North Richland Hills in 2022:
North Richland Hills:
$100,642
State:
$86,267
Number of families with income < $10k:
North Richland Hills:
1.6% (291)
State:
4.0% (297,884)
Number of families with income $10k - 20k:
North Richland Hills:
2.1% (378)
State:
4.3% (324,514)
Number of families with income $20k - 30k:
North Richland Hills:
3.0% (553)
Texas:
5.8% (430,949)
Number of families with income $30k - 40k:
North Richland Hills:
2.1% (381)
State:
6.6% (493,535)
Number of families with income $40k - 50k:
North Richland Hills:
4.8% (872)
State:
6.7% (499,663)
Number of families with income $50k - 60k:
North Richland Hills:
6.6% (1,209)
State:
6.6% (492,203)
Number of families with income $60k - 75k:
North Richland Hills:
14.1% (2,594)
State:
9.5% (710,229)
Number of families with income $75k - 100k:
North Richland Hills:
15.4% (2,826)
State:
13.6% (1,015,480)
Number of families with income $100k - 125k:
North Richland Hills:
12.8% (2,354)
State:
10.7% (797,961)
Number of families with income $125k - 150k:
North Richland Hills:
6.7% (1,235)
State:
8.1% (602,985)
Number of families with income $150k - 200k:
North Richland Hills:
12.1% (2,214)
State:
10.7% (804,459)
Number of families with income > $200k:
North Richland Hills:
18.7% (3,430)
State:
13.5% (1,013,514)
Median non-family income in North Richland Hills in 2022:
North Richland Hills:
$66,443
State:
$45,999
Change in median non-family income between 2000 and 2022:
North Richland Hills, Texas:
+109.3%
State:
+79.5%
Median per capita income in North Richland Hills in 2022:
North Richland Hills:
$44,966
State:
$38,123
Change in median per capita income between 2000 and 2022:
North Richland Hills, Texas:
+76.2%
State:
+94.3%
Income statistics for White residents
Median household income in North Richland Hills, TX in 2022:
North Richland Hills:
$87,300
State:
$82,032
Change in median household income between 2000 and 2022:
North Richland Hills, Texas:
+53.6%
State:
+91.0%
Number of households with income < $10k:
North Richland Hills:
1.5% (334)
State:
4.7% (273,716)
Number of households with income $10k - 20k:
North Richland Hills:
4.0% (858)
State:
5.5% (322,702)
Number of households with income $20k - 30k:
North Richland Hills:
3.7% (792)
State:
6.2% (363,947)
Number of households with income $30k - 40k:
North Richland Hills:
4.0% (853)
Texas:
6.8% (399,275)
Number of households with income $40k - 50k:
North Richland Hills:
7.5% (1,619)
State:
6.5% (383,417)
Number of households with income $50k - 60k:
North Richland Hills:
4.9% (1,068)
Texas:
6.6% (388,535)
Number of households with income $60k - 75k:
North Richland Hills:
16.7% (3,605)
State:
9.7% (566,295)
Number of households with income $75k - 100k:
North Richland Hills:
18.6% (4,011)
State:
13.0% (760,276)
Number of households with income $100k - 125k:
North Richland Hills:
11.5% (2,476)
Texas:
10.2% (597,596)
Number of households with income $125k - 150k:
North Richland Hills:
5.8% (1,244)
State:
7.4% (436,830)
Number of households with income $150k - 200k:
North Richland Hills:
7.7% (1,666)
State:
9.9% (583,067)
Number of households with income > $200k:
North Richland Hills:
14.2% (3,056)
State:
13.5% (792,647)
Aggregate household income in North Richland Hills in 2022: $2,430,327,800
Median family income in North Richland Hills in 2022:
North Richland Hills:
$109,521
State:
$101,788
Number of families with income < $10k:
North Richland Hills:
0.9% (115)
State:
2.8% (108,142)
Number of families with income $10k - 20k:
North Richland Hills:
2.0% (275)
Texas:
2.9% (113,421)
Number of families with income $20k - 30k:
North Richland Hills:
3.1% (420)
Texas:
4.1% (157,688)
Number of families with income $30k - 40k:
North Richland Hills:
2.8% (382)
State:
5.2% (198,847)
Number of families with income $40k - 50k:
North Richland Hills:
8.2% (1,105)
Texas:
5.6% (216,490)
Number of families with income $50k - 60k:
North Richland Hills:
3.8% (514)
Texas:
5.7% (220,689)
Number of families with income $60k - 75k:
North Richland Hills:
6.3% (841)
State:
9.0% (346,106)
Number of families with income $75k - 100k:
North Richland Hills:
13.4% (1,801)
State:
13.7% (527,363)
Number of families with income $100k - 125k:
North Richland Hills:
17.0% (2,288)
Texas:
11.6% (448,411)
Number of families with income $125k - 150k:
North Richland Hills:
9.9% (1,323)
State:
9.2% (355,798)
Number of families with income $150k - 200k:
North Richland Hills:
13.7% (1,838)
State:
12.5% (480,185)
Number of families with income > $200k:
North Richland Hills:
18.8% (2,517)
State:
17.6% (677,490)
Median non-family income in North Richland Hills in 2022:
North Richland Hills:
$69,417
State:
$50,587
Change in median non-family income between 2000 and 2022:
North Richland Hills, Texas:
+122.3%
State:
+87.7%
Median per capita income in North Richland Hills in 2022:
North Richland Hills:
$49,431
Texas:
$47,740
Change in median per capita income between 2000 and 2022:
North Richland Hills, Texas:
+89.0%
State:
+114.3%
Income statistics for Black or African American residents
Median household income in North Richland Hills, TX in 2022:
North Richland Hills:
$65,063
State:
$55,759
Change in median household income between 2000 and 2022:
North Richland Hills, Texas:
+22.6%
State:
+90.3%
Number of households with income < $10k:
North Richland Hills:
10.3% (153)
State:
8.9% (126,378)
Number of households with income $10k - 20k:
North Richland Hills:
0.0% (0)
State:
9.9% (140,369)
Number of households with income $20k - 30k:
North Richland Hills:
5.7% (84)
State:
8.5% (120,639)
Number of households with income $30k - 40k:
North Richland Hills:
3.5% (52)
State:
9.7% (137,517)
Number of households with income $40k - 50k:
North Richland Hills:
5.4% (80)
State:
8.0% (112,973)
Number of households with income $50k - 60k:
North Richland Hills:
10.7% (158)
State:
8.3% (117,156)
Number of households with income $60k - 75k:
North Richland Hills:
20.4% (302)
State:
10.4% (147,462)
Number of households with income $75k - 100k:
North Richland Hills:
19.9% (295)
Texas:
11.5% (162,718)
Number of households with income $100k - 125k:
North Richland Hills:
4.9% (72)
State:
8.2% (115,829)
Number of households with income $125k - 150k:
North Richland Hills:
7.4% (109)
Texas:
4.9% (69,556)
Number of households with income $150k - 200k:
North Richland Hills:
10.2% (151)
State:
6.4% (90,701)
Number of households with income > $200k:
North Richland Hills:
1.6% (23)
State:
5.5% (77,988)
Aggregate household income in North Richland Hills in 2022: $225,616,100
Median family income in North Richland Hills in 2022:
North Richland Hills:
$64,834
State:
$69,134
Number of families with income < $10k:
North Richland Hills:
14.4% (131)
State:
6.8% (55,625)
Number of families with income $20k - 30k:
North Richland Hills:
1.4% (13)
Texas:
7.1% (57,877)
Number of families with income $30k - 40k:
North Richland Hills:
1.7% (15)
State:
8.5% (68,776)
Number of families with income $40k - 50k:
North Richland Hills:
3.2% (29)
State:
7.1% (57,907)
Number of families with income $50k - 60k:
North Richland Hills:
6.2% (56)
State:
7.3% (59,511)
Number of families with income $60k - 75k:
North Richland Hills:
32.1% (292)
Texas:
10.1% (81,994)
Number of families with income $75k - 100k:
North Richland Hills:
8.7% (80)
State:
12.7% (103,723)
Number of families with income $100k - 125k:
North Richland Hills:
7.7% (70)
Texas:
9.4% (76,609)
Number of families with income $125k - 150k:
North Richland Hills:
6.3% (57)
State:
6.8% (55,615)
Number of families with income $150k - 200k:
North Richland Hills:
15.7% (143)
State:
9.4% (76,146)
Number of families with income > $200k:
North Richland Hills:
2.6% (24)
State:
7.9% (64,439)
Median non-family income in North Richland Hills in 2022:
North Richland Hills:
$60,705
State:
$40,133
Change in median non-family income between 2000 and 2022:
North Richland Hills, Texas:
+42.3%
State:
+102.2%
Median per capita income in North Richland Hills in 2022:
North Richland Hills:
$29,647
Texas:
$30,490
Change in median per capita income between 2000 and 2022:
North Richland Hills, Texas:
+56.9%
State:
+113.9%
Income statistics for Asian residents
Median household income in North Richland Hills, TX in 2022:
North Richland Hills:
$79,739
Texas:
$107,673
Change in median household income between 2000 and 2022:
North Richland Hills, Texas:
+78.0%
State:
+115.1%
Number of households with income < $10k:
North Richland Hills:
13.3% (123)
State:
5.2% (29,885)
Number of households with income $10k - 20k:
North Richland Hills:
8.6% (79)
State:
4.7% (27,044)
Number of households with income $20k - 30k:
North Richland Hills:
6.6% (61)
Texas:
4.1% (23,363)
Number of households with income $30k - 40k:
North Richland Hills:
4.1% (38)
State:
4.1% (23,309)
Number of households with income $40k - 50k:
North Richland Hills:
2.5% (23)
State:
5.2% (29,826)
Number of households with income $50k - 60k:
North Richland Hills:
6.2% (57)
Texas:
4.7% (26,512)
Number of households with income $60k - 75k:
North Richland Hills:
8.5% (78)
State:
6.5% (36,905)
Number of households with income $75k - 100k:
North Richland Hills:
11.3% (104)
State:
11.3% (64,350)
Number of households with income $100k - 125k:
North Richland Hills:
7.3% (67)
State:
11.4% (64,714)
Number of households with income $125k - 150k:
North Richland Hills:
5.2% (48)
State:
9.3% (52,719)
Number of households with income $150k - 200k:
North Richland Hills:
10.7% (99)
State:
12.5% (70,953)
Number of households with income > $200k:
North Richland Hills:
15.8% (146)
State:
21.1% (120,260)
Aggregate household income in North Richland Hills in 2022: $72,023,000
Median family income in North Richland Hills in 2022:
North Richland Hills:
$113,030
Texas:
$123,328
Number of families with income < $10k:
North Richland Hills:
9.2% (68)
Texas:
3.1% (13,567)
Number of families with income $10k - 20k:
North Richland Hills:
11.9% (88)
State:
3.0% (13,043)
Number of families with income $20k - 30k:
North Richland Hills:
8.4% (62)
State:
3.4% (14,738)
Number of families with income $40k - 50k:
North Richland Hills:
3.8% (28)
Texas:
4.9% (21,622)
Number of families with income $50k - 60k:
North Richland Hills:
7.1% (53)
State:
4.7% (20,568)
Number of families with income $60k - 75k:
North Richland Hills:
6.6% (49)
Texas:
6.1% (26,637)
Number of families with income $75k - 100k:
North Richland Hills:
6.4% (47)
State:
10.7% (46,626)
Number of families with income $100k - 125k:
North Richland Hills:
9.0% (66)
Texas:
11.3% (49,585)
Number of families with income $125k - 150k:
North Richland Hills:
6.0% (44)
State:
9.8% (43,043)
Number of families with income $150k - 200k:
North Richland Hills:
13.4% (99)
State:
14.7% (64,203)
Number of families with income > $200k:
North Richland Hills:
18.1% (134)
Texas:
24.8% (108,511)
Median per capita income in North Richland Hills in 2022:
North Richland Hills:
$44,456
State:
$48,626
Change in median per capita income between 2000 and 2022:
North Richland Hills, Texas:
+104.9%
Texas:
+132.0%
Income statistics for Hispanic or Latino residents
Median household income in North Richland Hills, TX in 2022:
North Richland Hills:
$74,028
State:
$60,504
Change in median household income between 2000 and 2022:
North Richland Hills, Texas:
+47.4%
State:
+102.5%
Number of households with income < $10k:
North Richland Hills:
1.6% (61)
Texas:
5.8% (213,953)
Number of households with income $10k - 20k:
North Richland Hills:
2.4% (92)
State:
8.0% (297,456)
Number of households with income $20k - 30k:
North Richland Hills:
4.5% (170)
State:
9.2% (340,166)
Number of households with income $30k - 40k:
North Richland Hills:
6.1% (231)
State:
9.5% (354,336)
Number of households with income $40k - 50k:
North Richland Hills:
13.5% (512)
State:
8.8% (327,013)
Number of households with income $50k - 60k:
North Richland Hills:
4.5% (169)
Texas:
8.3% (308,818)
Number of households with income $60k - 75k:
North Richland Hills:
16.2% (612)
Texas:
10.9% (405,109)
Number of households with income $75k - 100k:
North Richland Hills:
10.4% (394)
Texas:
13.8% (511,639)
Number of households with income $100k - 125k:
North Richland Hills:
7.6% (288)
State:
8.6% (319,728)
Number of households with income $125k - 150k:
North Richland Hills:
4.6% (173)
Texas:
5.7% (210,932)
Number of households with income $150k - 200k:
North Richland Hills:
16.9% (640)
Texas:
6.4% (236,055)
Number of households with income > $200k:
North Richland Hills:
11.7% (441)
State:
5.1% (189,259)
Aggregate household income in North Richland Hills in 2022: $380,289,400
Median family income in North Richland Hills in 2022:
North Richland Hills:
$96,955
Texas:
$65,080
Number of families with income < $10k:
North Richland Hills:
0.8% (23)
Texas:
5.3% (147,493)
Number of families with income $10k - 20k:
North Richland Hills:
2.9% (85)
State:
6.3% (174,531)
Number of families with income $20k - 30k:
North Richland Hills:
1.3% (38)
State:
8.6% (238,528)
Number of families with income $30k - 40k:
North Richland Hills:
4.9% (143)
State:
9.1% (251,999)
Number of families with income $40k - 50k:
North Richland Hills:
12.9% (374)
State:
8.6% (240,188)
Number of families with income $50k - 60k:
North Richland Hills:
5.4% (157)
State:
8.0% (223,566)
Number of families with income $60k - 75k:
North Richland Hills:
16.5% (479)
Texas:
10.9% (302,688)
Number of families with income $75k - 100k:
North Richland Hills:
10.9% (315)
Texas:
14.3% (398,554)
Number of families with income $100k - 125k:
North Richland Hills:
7.8% (228)
State:
9.5% (264,007)
Number of families with income $125k - 150k:
North Richland Hills:
5.0% (146)
State:
6.2% (171,274)
Number of families with income $150k - 200k:
North Richland Hills:
22.0% (638)
State:
7.3% (202,259)
Number of families with income > $200k:
North Richland Hills:
9.6% (279)
State:
5.9% (165,129)
Median non-family income in North Richland Hills in 2022:
North Richland Hills:
$44,088
State:
$39,934
Change in median non-family income between 2000 and 2022:
North Richland Hills, Texas:
+41.8%
State:
+109.1%
Median per capita income in North Richland Hills in 2022:
North Richland Hills:
$35,303
State:
$24,862
Change in median per capita income between 2000 and 2022:
North Richland Hills, Texas:
+96.7%
State:
+130.8%
Income statistics for American Indian and Alaska Native residents
Median household income in North Richland Hills, TX in 2022:
North Richland Hills:
$116,250
State:
$65,765
Change in median household income between 2000 and 2022:
North Richland Hills, Texas:
+110.4%
State:
+88.3%
Number of households with income < $10k:
North Richland Hills:
6.2% (13)
State:
4.1% (3,398)
Number of households with income $10k - 20k:
North Richland Hills:
0.0% (0)
Texas:
8.3% (6,949)
Number of households with income $20k - 30k:
North Richland Hills:
2.9% (6)
Texas:
9.3% (7,742)
Number of households with income $30k - 40k:
North Richland Hills:
0.0% (0)
State:
9.1% (7,627)
Number of households with income $40k - 50k:
North Richland Hills:
0.0% (0)
Texas:
7.1% (5,922)
Number of households with income $50k - 60k:
North Richland Hills:
0.0% (0)
Texas:
8.1% (6,761)
Number of households with income $60k - 75k:
North Richland Hills:
12.0% (25)
State:
12.7% (10,588)
Number of households with income $75k - 100k:
North Richland Hills:
13.5% (28)
State:
13.0% (10,903)
Number of households with income $100k - 125k:
North Richland Hills:
55.3% (115)
Texas:
9.9% (8,256)
Number of households with income $125k - 150k:
North Richland Hills:
5.3% (11)
State:
5.2% (4,355)
Number of households with income $150k - 200k:
North Richland Hills:
4.8% (10)
State:
6.7% (5,623)
Number of households with income > $200k:
North Richland Hills:
0.0% (0)
Texas:
6.6% (5,522)
Aggregate household income in North Richland Hills in 2022: $23,784,427
Median family income in North Richland Hills in 2022:
North Richland Hills:
$123,540
State:
$72,369
Number of families with income $20k - 30k:
North Richland Hills:
3.4% (6)
State:
7.3% (4,502)
Number of families with income $30k - 40k:
North Richland Hills:
23.0% (42)
State:
7.5% (4,592)
Number of families with income $60k - 75k:
North Richland Hills:
9.9% (18)
Texas:
12.1% (7,429)
Number of families with income $75k - 100k:
North Richland Hills:
16.8% (31)
State:
14.4% (8,852)
Number of families with income $100k - 125k:
North Richland Hills:
34.2% (63)
State:
11.4% (6,997)
Number of families with income $125k - 150k:
North Richland Hills:
7.6% (14)
Texas:
7.5% (4,609)
Number of families with income $150k - 200k:
North Richland Hills:
4.9% (9)
State:
6.9% (4,246)
Median per capita income in North Richland Hills in 2022:
North Richland Hills:
$29,603
State:
$28,166
Change in median per capita income between 2000 and 2022:: -9.0%
North Richland Hills, Texas:
-9.0%
Texas:
+77.2%
Income statistics for Multirace residents
Median household income in North Richland Hills, TX in 2022:
North Richland Hills:
$85,214
Texas:
$62,748
Change in median household income between 2000 and 2022:
North Richland Hills, Texas:
+55.5%
State:
+92.3%
Number of households with income < $10k:
North Richland Hills:
1.2% (37)
Texas:
5.5% (122,324)
Number of households with income $10k - 20k:
North Richland Hills:
0.3% (9)
Texas:
8.2% (182,232)
Number of households with income $20k - 30k:
North Richland Hills:
4.4% (132)
Texas:
8.5% (189,456)
Number of households with income $30k - 40k:
North Richland Hills:
3.1% (94)
Texas:
8.9% (197,499)
Number of households with income $40k - 50k:
North Richland Hills:
10.6% (320)
State:
8.7% (191,735)
Number of households with income $50k - 60k:
North Richland Hills:
16.0% (481)
State:
8.0% (177,535)
Number of households with income $60k - 75k:
North Richland Hills:
24.8% (746)
State:
10.5% (232,479)
Number of households with income $75k - 100k:
North Richland Hills:
10.8% (326)
State:
13.1% (290,448)
Number of households with income $100k - 125k:
North Richland Hills:
6.2% (186)
Texas:
8.6% (191,595)
Number of households with income $125k - 150k:
North Richland Hills:
1.6% (48)
Texas:
6.0% (133,361)
Number of households with income $150k - 200k:
North Richland Hills:
13.4% (404)
State:
7.2% (159,195)
Number of households with income > $200k:
North Richland Hills:
7.6% (229)
Texas:
6.7% (148,064)
Aggregate household income in North Richland Hills in 2022: $279,810,800
Median family income in North Richland Hills in 2022:
North Richland Hills:
$94,955
Texas:
$69,780
Number of families with income $20k - 30k:
North Richland Hills:
2.1% (50)
Texas:
7.8% (126,627)
Number of families with income $30k - 40k:
North Richland Hills:
1.8% (43)
State:
8.5% (137,626)
Number of families with income $40k - 50k:
North Richland Hills:
8.1% (191)
State:
8.4% (135,809)
Number of families with income $50k - 60k:
North Richland Hills:
13.4% (315)
Texas:
7.9% (127,739)
Number of families with income $60k - 75k:
North Richland Hills:
29.4% (694)
State:
10.5% (169,549)
Number of families with income $75k - 100k:
North Richland Hills:
12.7% (301)
State:
14.0% (226,284)
Number of families with income $100k - 125k:
North Richland Hills:
6.9% (162)
State:
9.5% (153,597)
Number of families with income $125k - 150k:
North Richland Hills:
3.2% (77)
State:
6.7% (107,900)
Number of families with income $150k - 200k:
North Richland Hills:
12.8% (301)
Texas:
8.5% (137,607)
Number of families with income > $200k:
North Richland Hills:
9.5% (224)
Texas:
7.9% (127,299)
Median non-family income in North Richland Hills in 2022:
North Richland Hills:
$55,816
State:
$40,634
Change in median non-family income between 2000 and 2022:
North Richland Hills, Texas:
+54.5%
State:
+77.2%
Median per capita income in North Richland Hills in 2022:
North Richland Hills:
$43,212
State:
$26,785
Change in median per capita income between 2000 and 2022:
North Richland Hills, Texas:
+97.2%
State:
+110.9%
Income statistics for other residents
Median household income in North Richland Hills, TX in 2022:
North Richland Hills:
$44,385
State:
$57,114
Number of households with income < $10k:
North Richland Hills:
2.9% (22)
State:
5.9% (54,162)
Number of households with income $10k - 20k:
North Richland Hills:
9.5% (72)
Texas:
6.8% (62,891)
Number of households with income $20k - 30k:
North Richland Hills:
11.7% (89)
State:
10.6% (97,294)
Number of households with income $30k - 40k:
North Richland Hills:
10.0% (76)
State:
10.8% (99,670)
Number of households with income $40k - 50k:
North Richland Hills:
10.8% (82)
Texas:
9.3% (85,548)
Number of households with income $50k - 60k:
North Richland Hills:
3.3% (25)
State:
9.0% (82,757)
Number of households with income $60k - 75k:
North Richland Hills:
0.9% (7)
State:
10.9% (100,326)
Number of households with income $75k - 100k:
North Richland Hills:
13.8% (105)
Texas:
14.0% (128,767)
Number of households with income $100k - 125k:
North Richland Hills:
1.1% (8)
Texas:
8.2% (75,218)
Number of households with income $125k - 150k:
North Richland Hills:
8.9% (68)
State:
4.8% (44,223)
Number of households with income $150k - 200k:
North Richland Hills:
20.1% (153)
Texas:
5.6% (51,376)
Number of households with income > $200k:
North Richland Hills:
7.0% (53)
Texas:
4.0% (36,393)
Aggregate household income in North Richland Hills in 2022: $71,079,500
Median family income in North Richland Hills in 2022:
North Richland Hills:
$91,814
State:
$60,064
Number of families with income $10k - 20k:
North Richland Hills:
6.1% (37)
State:
6.0% (41,763)
Number of families with income $20k - 30k:
North Richland Hills:
5.8% (34)
Texas:
9.9% (68,761)
Number of families with income $30k - 40k:
North Richland Hills:
15.4% (92)
Texas:
9.7% (67,685)
Number of families with income $40k - 50k:
North Richland Hills:
3.0% (18)
State:
9.0% (62,441)
Number of families with income $50k - 60k:
North Richland Hills:
4.5% (27)
Texas:
8.5% (59,321)
Number of families with income $60k - 75k:
North Richland Hills:
1.2% (7)
State:
11.2% (77,588)
Number of families with income $75k - 100k:
North Richland Hills:
19.4% (116)
State:
14.5% (101,032)
Number of families with income $100k - 125k:
North Richland Hills:
4.9% (29)
State:
8.8% (61,439)
Number of families with income $125k - 150k:
North Richland Hills:
7.5% (45)
Texas:
5.1% (35,727)
Number of families with income $150k - 200k:
North Richland Hills:
24.4% (146)
State:
5.9% (41,211)
Number of families with income > $200k:
North Richland Hills:
7.9% (47)
Texas:
4.5% (31,243)
Median non-family income in North Richland Hills in 2022:
North Richland Hills:
$43,203
State:
$38,690
Change in median non-family income between 2000 and 2022:: -38.3%
North Richland Hills, Texas:
-38.3%
State:
+90.2%
Median per capita income in North Richland Hills in 2022:
North Richland Hills:
$20,567
Texas:
$23,899
Change in median per capita income between 2000 and 2022:
North Richland Hills, Texas:
+7.0%
Texas:
+135.2%
Discuss North Richland Hills, Texas (TX) on our hugely popular Texas forum.