The median household income in North Myrtle Beach, SC in 2022 was $71,170, which was 9.9% greater than the median annual income of $64,115 across the entire state of South Carolina. Compared to the median income of $38,787 in 2000 this represents an increase of 45.5%. The per capita income in 2022 was $52,406, which means an increase of 48.5% compared to 2000 when it was $27,006.
Whole page based on the data from 2000 / 2022 when the population of North Myrtle Beach, South Carolina was 10,974 / 20,252
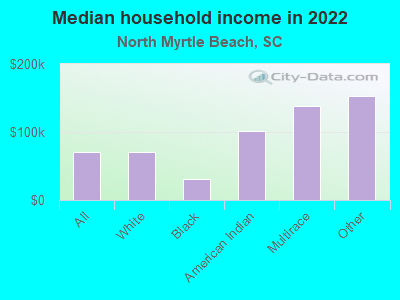
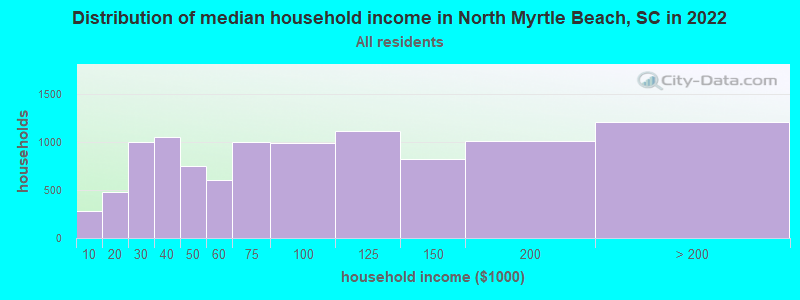
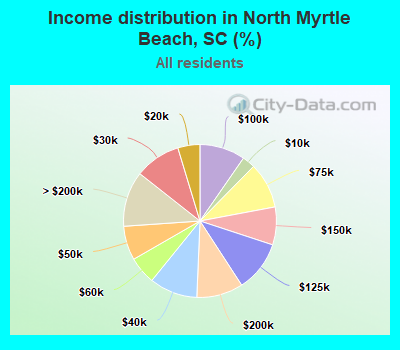
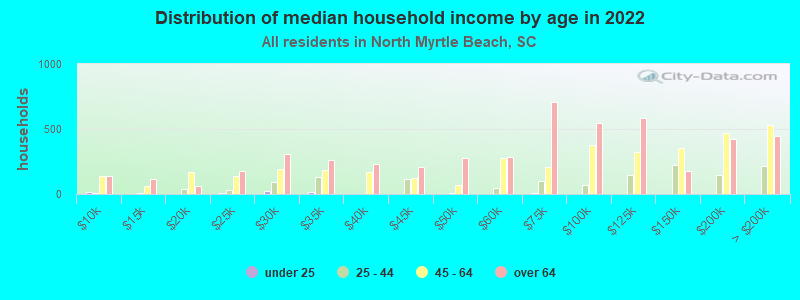
Income statistics for all residents
Median household income in North Myrtle Beach, SC in 2022:
North Myrtle Beach:
$71,171
State:
$64,115
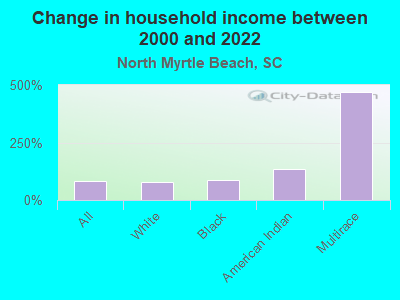
Change in median household income between 2000 and 2022:
North Myrtle Beach, South Carolina:
+83.5%
State:
+72.9%
Number of households with income < $10k:
North Myrtle Beach:
2.7% (279)
State:
6.1% (130,922)
Number of households with income $10k - 20k:
North Myrtle Beach:
4.7% (482)
State:
7.9% (168,918)
Number of households with income $20k - 30k:
North Myrtle Beach:
9.7% (1,001)
South Carolina:
8.0% (171,564)
Number of households with income $30k - 40k:
North Myrtle Beach:
10.2% (1,049)
South Carolina:
9.2% (195,662)
Number of households with income $40k - 50k:
North Myrtle Beach:
7.2% (746)
State:
8.2% (176,179)
Number of households with income $50k - 60k:
North Myrtle Beach:
5.8% (602)
State:
7.5% (159,159)
Number of households with income $60k - 75k:
North Myrtle Beach:
9.7% (1,001)
South Carolina:
9.9% (211,862)
Number of households with income $75k - 100k:
North Myrtle Beach:
9.6% (994)
South Carolina:
13.5% (287,601)
Number of households with income $100k - 125k:
North Myrtle Beach:
10.8% (1,111)
State:
9.3% (199,068)
Number of households with income $125k - 150k:
North Myrtle Beach:
8.0% (826)
State:
6.2% (133,330)
Number of households with income $150k - 200k:
North Myrtle Beach:
9.8% (1,015)
State:
6.6% (141,363)
Number of households with income > $200k:
North Myrtle Beach:
11.7% (1,208)
State:
7.5% (160,452)
Aggregate household income in North Myrtle Beach in 2022: $1,066,973,913
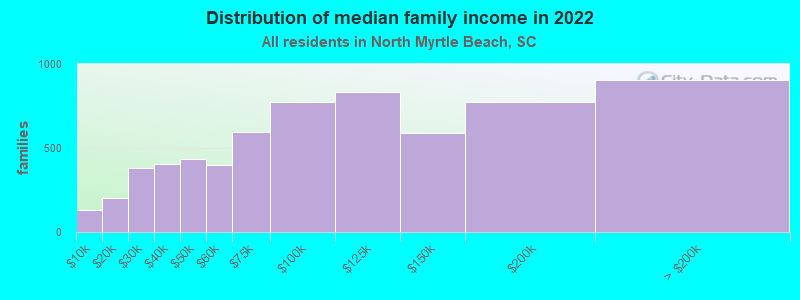
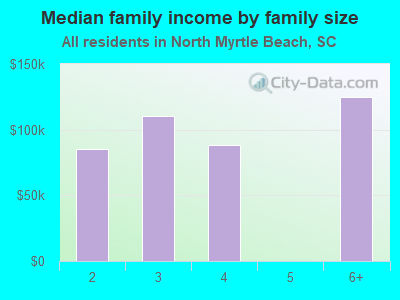
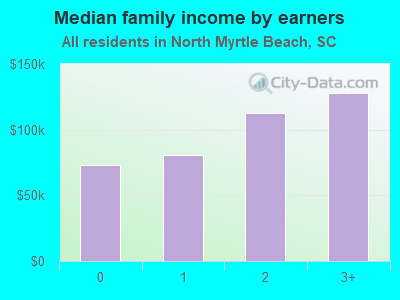
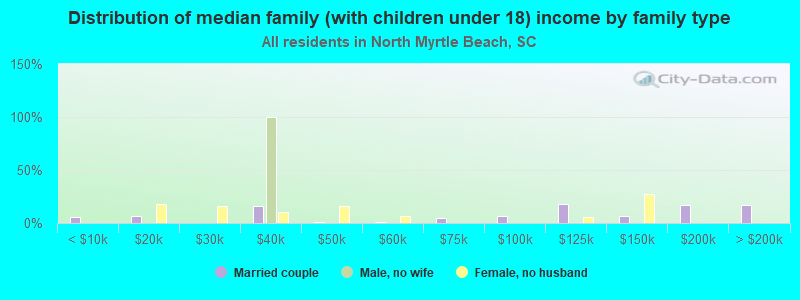
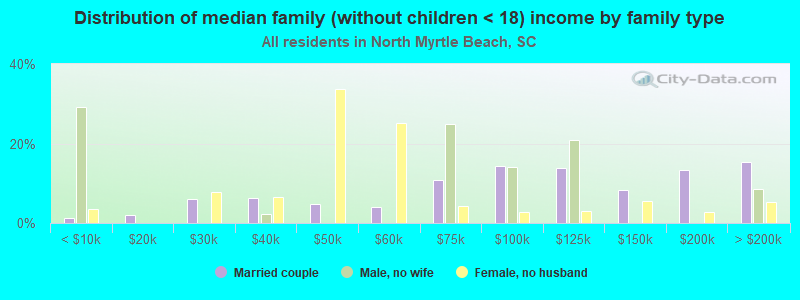
Median family income in North Myrtle Beach in 2022:
North Myrtle Beach:
$92,879
State:
$79,886
Number of families with income < $10k:
North Myrtle Beach:
2.0% (130)
State:
3.7% (51,214)
Number of families with income $10k - 20k:
North Myrtle Beach:
3.2% (202)
State:
4.5% (63,460)
Number of families with income $20k - 30k:
North Myrtle Beach:
5.9% (379)
State:
5.9% (82,415)
Number of families with income $30k - 40k:
North Myrtle Beach:
6.3% (402)
South Carolina:
7.5% (105,475)
Number of families with income $40k - 50k:
North Myrtle Beach:
6.8% (436)
State:
7.7% (107,666)
Number of families with income $50k - 60k:
North Myrtle Beach:
6.2% (397)
State:
7.1% (98,803)
Number of families with income $60k - 75k:
North Myrtle Beach:
9.3% (595)
State:
9.9% (138,412)
Number of families with income $75k - 100k:
North Myrtle Beach:
12.0% (771)
South Carolina:
15.4% (214,716)
Number of families with income $100k - 125k:
North Myrtle Beach:
13.0% (831)
State:
11.4% (159,999)
Number of families with income $125k - 150k:
North Myrtle Beach:
9.2% (588)
State:
8.0% (112,152)
Number of families with income $150k - 200k:
North Myrtle Beach:
12.1% (774)
South Carolina:
8.8% (123,525)
Number of families with income > $200k:
North Myrtle Beach:
14.1% (904)
South Carolina:
10.1% (140,575)
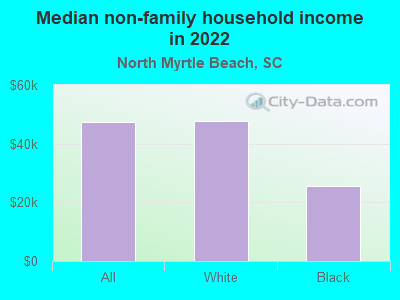
Median non-family income in North Myrtle Beach in 2022:
North Myrtle Beach:
$47,543
South Carolina:
$38,426
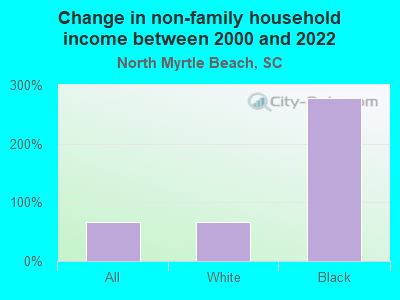
Change in median non-family income between 2000 and 2022:
North Myrtle Beach, South Carolina:
+67.2%
State:
+78.7%
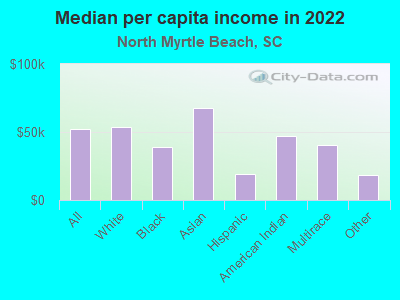
Median per capita income in North Myrtle Beach in 2022:
North Myrtle Beach:
$52,407
South Carolina:
$36,675
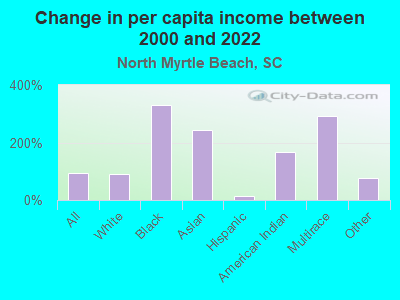
Change in median per capita income between 2000 and 2022:
North Myrtle Beach, South Carolina:
+94.1%
State:
+95.1%
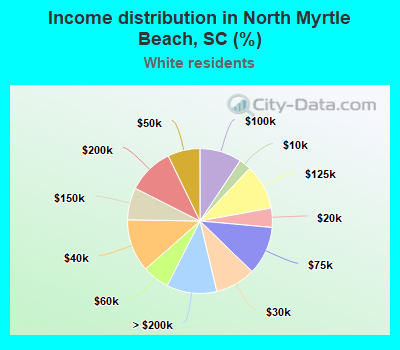
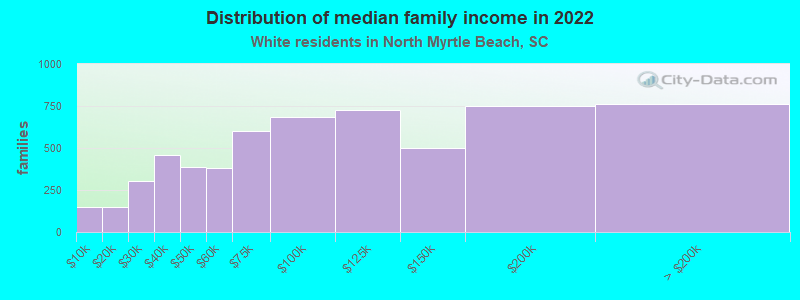
Income statistics for White residents
Median household income in North Myrtle Beach, SC in 2022:
North Myrtle Beach:
$70,016
South Carolina:
$73,516
Change in median household income between 2000 and 2022:
North Myrtle Beach, South Carolina:
+78.1%
State:
+74.8%
Number of households with income < $10k:
North Myrtle Beach:
2.7% (253)
State:
4.8% (68,379)
Number of households with income $10k - 20k:
North Myrtle Beach:
4.3% (406)
State:
5.9% (85,105)
Number of households with income $20k - 30k:
North Myrtle Beach:
9.0% (849)
State:
7.1% (101,178)
Number of households with income $30k - 40k:
North Myrtle Beach:
11.7% (1,108)
State:
8.0% (114,877)
Number of households with income $40k - 50k:
North Myrtle Beach:
7.2% (681)
South Carolina:
7.9% (112,749)
Number of households with income $50k - 60k:
North Myrtle Beach:
6.0% (570)
State:
7.1% (101,835)
Number of households with income $60k - 75k:
North Myrtle Beach:
10.8% (1,022)
State:
10.2% (145,879)
Number of households with income $75k - 100k:
North Myrtle Beach:
9.4% (885)
South Carolina:
14.0% (200,068)
Number of households with income $100k - 125k:
North Myrtle Beach:
10.1% (949)
State:
10.4% (148,542)
Number of households with income $125k - 150k:
North Myrtle Beach:
7.2% (677)
State:
7.3% (105,118)
Number of households with income $150k - 200k:
North Myrtle Beach:
10.3% (974)
State:
8.0% (114,506)
Number of households with income > $200k:
North Myrtle Beach:
11.2% (1,056)
State:
9.3% (133,550)
Aggregate household income in North Myrtle Beach in 2022: $945,543,279
Median family income in North Myrtle Beach in 2022:
North Myrtle Beach:
$87,692
State:
$90,709
Number of families with income < $10k:
North Myrtle Beach:
2.5% (148)
State:
2.4% (22,376)
Number of families with income $10k - 20k:
North Myrtle Beach:
2.5% (146)
South Carolina:
3.0% (28,325)
Number of families with income $20k - 30k:
North Myrtle Beach:
5.2% (305)
State:
4.4% (42,131)
Number of families with income $30k - 40k:
North Myrtle Beach:
7.9% (459)
State:
6.1% (57,510)
Number of families with income $40k - 50k:
North Myrtle Beach:
6.6% (385)
State:
7.0% (66,712)
Number of families with income $50k - 60k:
North Myrtle Beach:
6.5% (380)
South Carolina:
6.6% (62,489)
Number of families with income $60k - 75k:
North Myrtle Beach:
10.3% (601)
State:
10.0% (94,724)
Number of families with income $75k - 100k:
North Myrtle Beach:
11.7% (685)
State:
15.5% (147,207)
Number of families with income $100k - 125k:
North Myrtle Beach:
12.4% (725)
South Carolina:
12.5% (118,160)
Number of families with income $125k - 150k:
North Myrtle Beach:
8.6% (501)
State:
9.5% (90,395)
Number of families with income $150k - 200k:
North Myrtle Beach:
12.8% (748)
State:
10.6% (100,043)
Number of families with income > $200k:
North Myrtle Beach:
13.1% (764)
South Carolina:
12.4% (117,500)
Median non-family income in North Myrtle Beach in 2022:
North Myrtle Beach:
$47,793
State:
$42,596
Change in median non-family income between 2000 and 2022:
North Myrtle Beach, South Carolina:
+65.8%
South Carolina:
+74.9%
Median per capita income in North Myrtle Beach in 2022:
North Myrtle Beach:
$53,362
State:
$42,728
Change in median per capita income between 2000 and 2022:
North Myrtle Beach, South Carolina:
+92.1%
South Carolina:
+93.4%
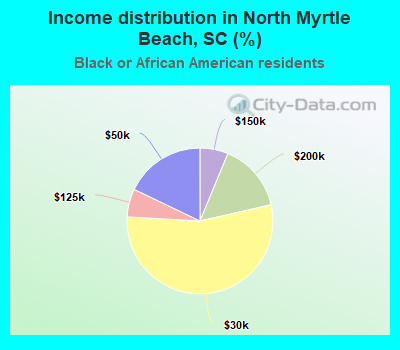
Income statistics for Black or African American residents
Median household income in North Myrtle Beach, SC in 2022:
North Myrtle Beach:
$30,229
South Carolina:
$44,187
Change in median household income between 2000 and 2022:
North Myrtle Beach, South Carolina:
+88.4%
State:
+76.5%
Number of households with income < $10k:
North Myrtle Beach:
0.0% (0)
State:
10.0% (52,303)
Number of households with income $10k - 20k:
North Myrtle Beach:
0.0% (0)
State:
13.4% (69,913)
Number of households with income $20k - 30k:
North Myrtle Beach:
54.5% (61)
South Carolina:
10.4% (54,216)
Number of households with income $30k - 40k:
North Myrtle Beach:
0.0% (0)
State:
12.0% (62,722)
Number of households with income $40k - 50k:
North Myrtle Beach:
17.9% (20)
State:
9.2% (47,773)
Number of households with income $50k - 60k:
North Myrtle Beach:
0.0% (0)
South Carolina:
8.3% (43,083)
Number of households with income $60k - 75k:
North Myrtle Beach:
0.0% (0)
State:
9.3% (48,640)
Number of households with income $75k - 100k:
North Myrtle Beach:
0.0% (0)
State:
12.2% (63,723)
Number of households with income $100k - 125k:
North Myrtle Beach:
6.2% (7)
South Carolina:
6.4% (33,117)
Number of households with income $125k - 150k:
North Myrtle Beach:
6.2% (7)
South Carolina:
3.2% (16,465)
Number of households with income $150k - 200k:
North Myrtle Beach:
15.2% (17)
State:
3.2% (16,672)
Number of households with income > $200k:
North Myrtle Beach:
0.0% (0)
State:
2.3% (12,213)
Aggregate household income in North Myrtle Beach in 2022: $6,744,026
Median non-family income in North Myrtle Beach in 2022:
North Myrtle Beach:
$25,727
South Carolina:
$28,585
Median per capita income in North Myrtle Beach in 2022:
North Myrtle Beach:
$39,159
South Carolina:
$24,863
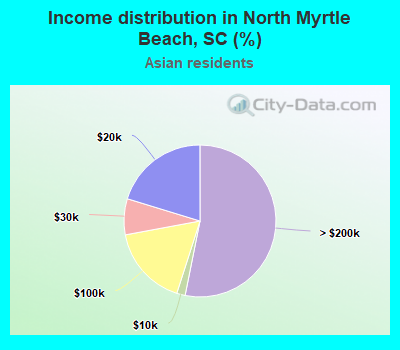
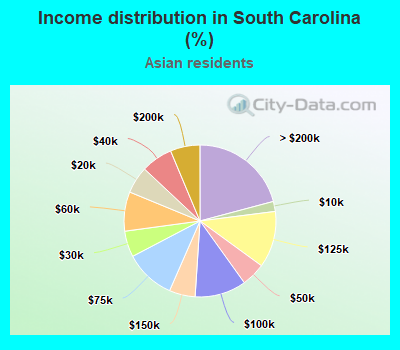
Income statistics for Asian residents
Number of households with income < $10k:
North Myrtle Beach:
1.8% (4)
South Carolina:
2.1% (676)
Number of households with income $10k - 20k:
North Myrtle Beach:
20.3% (45)
South Carolina:
5.8% (1,818)
Number of households with income $20k - 30k:
North Myrtle Beach:
7.7% (17)
South Carolina:
5.5% (1,750)
Number of households with income $30k - 40k:
North Myrtle Beach:
0.0% (0)
State:
6.7% (2,113)
Number of households with income $40k - 50k:
North Myrtle Beach:
0.0% (0)
State:
5.1% (1,605)
Number of households with income $50k - 60k:
North Myrtle Beach:
0.0% (0)
State:
8.4% (2,643)
Number of households with income $60k - 75k:
North Myrtle Beach:
0.0% (0)
South Carolina:
10.8% (3,393)
Number of households with income $75k - 100k:
North Myrtle Beach:
17.1% (38)
State:
10.9% (3,450)
Number of households with income $100k - 125k:
North Myrtle Beach:
0.0% (0)
State:
12.0% (3,796)
Number of households with income $125k - 150k:
North Myrtle Beach:
0.0% (0)
South Carolina:
5.5% (1,742)
Number of households with income $150k - 200k:
North Myrtle Beach:
0.0% (0)
South Carolina:
6.3% (1,990)
Number of households with income > $200k:
North Myrtle Beach:
53.2% (118)
State:
20.9% (6,581)
Aggregate household income in North Myrtle Beach in 2022: $40,171,616
Median per capita income in North Myrtle Beach in 2022:
North Myrtle Beach:
$67,475
South Carolina:
$48,909
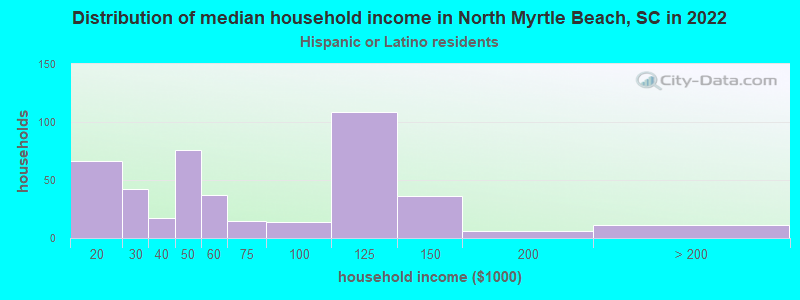
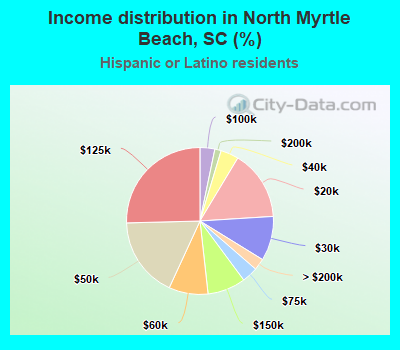
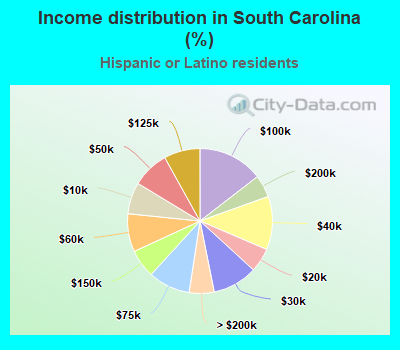
Income statistics for Hispanic or Latino residents
Number of households with income < $10k:
North Myrtle Beach:
0.0% (0)
South Carolina:
7.1% (7,036)
Number of households with income $10k - 20k:
North Myrtle Beach:
15.4% (66)
State:
5.4% (5,379)
Number of households with income $20k - 30k:
North Myrtle Beach:
9.8% (42)
State:
10.0% (9,993)
Number of households with income $30k - 40k:
North Myrtle Beach:
4.0% (17)
State:
11.9% (11,872)
Number of households with income $40k - 50k:
North Myrtle Beach:
17.7% (76)
South Carolina:
8.3% (8,239)
Number of households with income $50k - 60k:
North Myrtle Beach:
8.6% (37)
State:
8.5% (8,475)
Number of households with income $60k - 75k:
North Myrtle Beach:
3.5% (15)
State:
9.4% (9,330)
Number of households with income $75k - 100k:
North Myrtle Beach:
3.3% (14)
State:
14.5% (14,491)
Number of households with income $100k - 125k:
North Myrtle Beach:
25.4% (109)
State:
8.1% (8,026)
Number of households with income $125k - 150k:
North Myrtle Beach:
8.4% (36)
State:
6.3% (6,313)
Number of households with income $150k - 200k:
North Myrtle Beach:
1.4% (6)
State:
5.0% (4,963)
Number of households with income > $200k:
North Myrtle Beach:
2.6% (11)
South Carolina:
5.6% (5,548)
Aggregate household income in North Myrtle Beach in 2022: $32,309,918
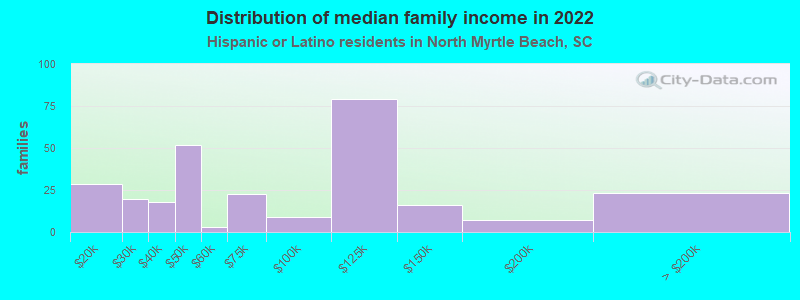
Median family income in North Myrtle Beach in 2022:
North Myrtle Beach:
$78,865
State:
$62,837
Number of families with income $10k - 20k:
North Myrtle Beach:
10.2% (28)
South Carolina:
4.8% (3,459)
Number of families with income $20k - 30k:
North Myrtle Beach:
7.2% (20)
State:
8.4% (6,079)
Number of families with income $30k - 40k:
North Myrtle Beach:
6.5% (18)
State:
12.3% (8,946)
Number of families with income $40k - 50k:
North Myrtle Beach:
18.5% (52)
State:
8.9% (6,476)
Number of families with income $50k - 60k:
North Myrtle Beach:
1.1% (3)
State:
7.1% (5,144)
Number of families with income $60k - 75k:
North Myrtle Beach:
8.2% (23)
State:
9.5% (6,918)
Number of families with income $75k - 100k:
North Myrtle Beach:
3.1% (9)
South Carolina:
15.0% (10,886)
Number of families with income $100k - 125k:
North Myrtle Beach:
28.5% (79)
South Carolina:
9.5% (6,862)
Number of families with income $125k - 150k:
North Myrtle Beach:
5.9% (16)
State:
6.7% (4,870)
Number of families with income $150k - 200k:
North Myrtle Beach:
2.5% (7)
South Carolina:
6.0% (4,384)
Number of families with income > $200k:
North Myrtle Beach:
8.3% (23)
South Carolina:
5.6% (4,034)
Median per capita income in North Myrtle Beach in 2022:
North Myrtle Beach:
$19,016
South Carolina:
$23,692
Change in median per capita income between 2000 and 2022:
North Myrtle Beach, South Carolina:
+14.8%
State:
+95.1%
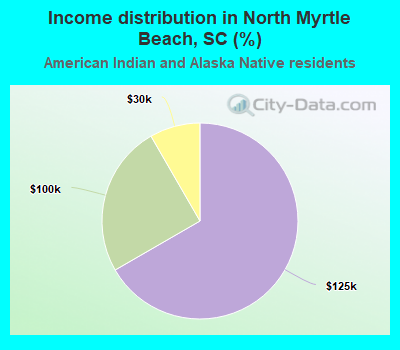
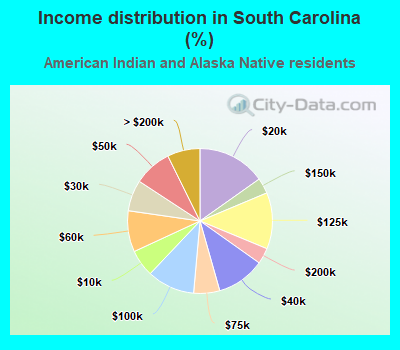
Income statistics for American Indian and Alaska Native residents
Median household income in North Myrtle Beach, SC in 2022:
North Myrtle Beach:
$101,485
South Carolina:
$52,847
Change in median household income between 2000 and 2022:
North Myrtle Beach, South Carolina:
+134.6%
State:
+63.4%
Number of households with income < $10k:
North Myrtle Beach:
0.0% (0)
State:
6.0% (394)
Number of households with income $10k - 20k:
North Myrtle Beach:
0.0% (0)
South Carolina:
15.2% (994)
Number of households with income $20k - 30k:
North Myrtle Beach:
8.3% (2)
South Carolina:
6.9% (454)
Number of households with income $30k - 40k:
North Myrtle Beach:
0.0% (0)
State:
10.8% (705)
Number of households with income $40k - 50k:
North Myrtle Beach:
0.0% (0)
South Carolina:
8.5% (555)
Number of households with income $50k - 60k:
North Myrtle Beach:
0.0% (0)
State:
9.2% (601)
Number of households with income $60k - 75k:
North Myrtle Beach:
0.0% (0)
State:
5.8% (380)
Number of households with income $75k - 100k:
North Myrtle Beach:
25.0% (6)
State:
10.7% (697)
Number of households with income $100k - 125k:
North Myrtle Beach:
66.7% (16)
State:
12.6% (822)
Number of households with income $125k - 150k:
North Myrtle Beach:
0.0% (0)
State:
3.5% (228)
Number of households with income $150k - 200k:
North Myrtle Beach:
0.0% (0)
State:
3.6% (234)
Number of households with income > $200k:
North Myrtle Beach:
0.0% (0)
South Carolina:
7.3% (477)
Aggregate household income in North Myrtle Beach in 2022: $1,469,012
Median per capita income in North Myrtle Beach in 2022:
North Myrtle Beach:
$47,373
State:
$26,654
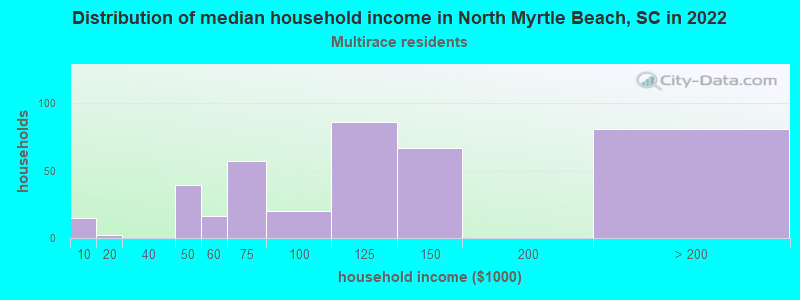
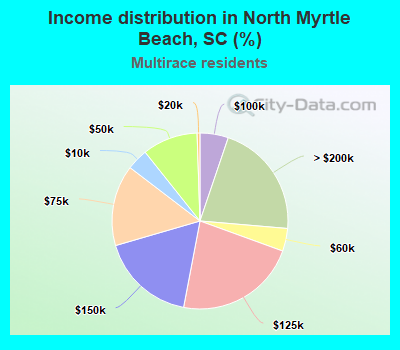
Income statistics for Multirace residents
Median household income in North Myrtle Beach, SC in 2022:
North Myrtle Beach:
$138,606
South Carolina:
$61,314
Number of households with income < $10k:
North Myrtle Beach:
3.9% (15)
South Carolina:
6.9% (6,974)
Number of households with income $10k - 20k:
North Myrtle Beach:
0.5% (2)
South Carolina:
8.0% (8,052)
Number of households with income $20k - 30k:
North Myrtle Beach:
0.0% (0)
South Carolina:
9.9% (9,972)
Number of households with income $30k - 40k:
North Myrtle Beach:
0.0% (0)
South Carolina:
10.0% (10,121)
Number of households with income $40k - 50k:
North Myrtle Beach:
10.2% (39)
South Carolina:
8.1% (8,188)
Number of households with income $50k - 60k:
North Myrtle Beach:
4.2% (16)
State:
6.5% (6,530)
Number of households with income $60k - 75k:
North Myrtle Beach:
14.9% (57)
South Carolina:
8.9% (9,021)
Number of households with income $75k - 100k:
North Myrtle Beach:
5.2% (20)
State:
13.4% (13,544)
Number of households with income $100k - 125k:
North Myrtle Beach:
22.5% (86)
State:
9.8% (9,916)
Number of households with income $125k - 150k:
North Myrtle Beach:
17.5% (67)
State:
6.6% (6,657)
Number of households with income $150k - 200k:
North Myrtle Beach:
0.0% (0)
South Carolina:
5.9% (5,979)
Number of households with income > $200k:
North Myrtle Beach:
21.1% (81)
South Carolina:
6.2% (6,266)
Aggregate household income in North Myrtle Beach in 2022: $66,166,442
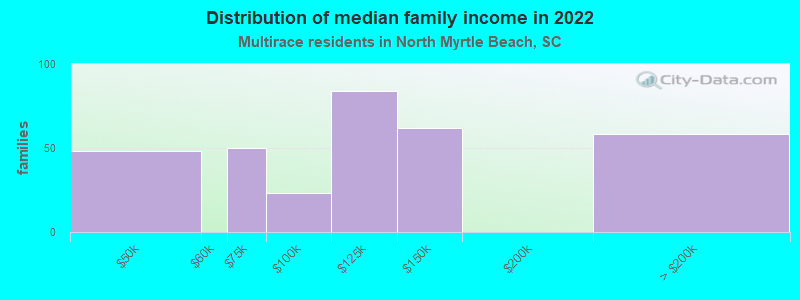
Median family income in North Myrtle Beach in 2022:
North Myrtle Beach:
$167,765
State:
$72,647
Number of families with income $40k - 50k:
North Myrtle Beach:
14.7% (48)
State:
8.5% (5,751)
Number of families with income $60k - 75k:
North Myrtle Beach:
15.3% (50)
South Carolina:
9.9% (6,674)
Number of families with income $75k - 100k:
North Myrtle Beach:
7.2% (23)
South Carolina:
15.0% (10,101)
Number of families with income $100k - 125k:
North Myrtle Beach:
25.8% (84)
State:
11.6% (7,846)
Number of families with income $125k - 150k:
North Myrtle Beach:
19.0% (62)
State:
7.0% (4,709)
Number of families with income > $200k:
North Myrtle Beach:
18.0% (59)
State:
7.0% (4,727)
Median per capita income in North Myrtle Beach in 2022:
North Myrtle Beach:
$40,769
South Carolina:
$26,391
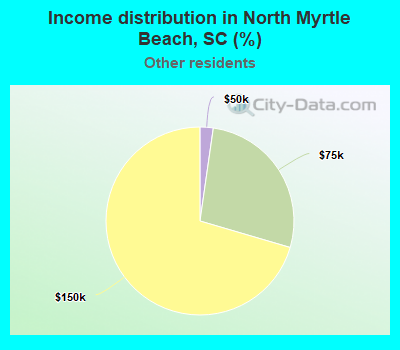
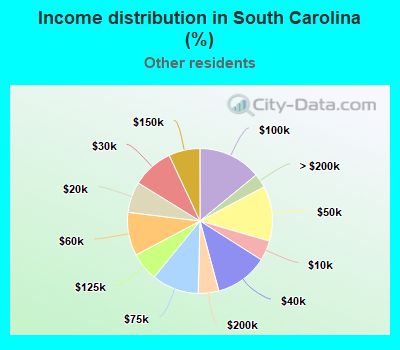
Income statistics for other residents
Median household income in North Myrtle Beach, SC in 2022:
North Myrtle Beach:
$152,227
State:
$54,421
Number of households with income < $10k:
North Myrtle Beach:
0.0% (0)
South Carolina:
4.5% (1,945)
Number of households with income $10k - 20k:
North Myrtle Beach:
0.0% (0)
State:
6.9% (2,977)
Number of households with income $20k - 30k:
North Myrtle Beach:
0.0% (0)
State:
9.2% (3,988)
Number of households with income $30k - 40k:
North Myrtle Beach:
0.0% (0)
State:
11.8% (5,124)
Number of households with income $40k - 50k:
North Myrtle Beach:
2.3% (1)
State:
12.3% (5,309)
Number of households with income $50k - 60k:
North Myrtle Beach:
0.0% (0)
State:
9.7% (4,196)
Number of households with income $60k - 75k:
North Myrtle Beach:
27.3% (12)
State:
10.5% (4,549)
Number of households with income $75k - 100k:
North Myrtle Beach:
0.0% (0)
South Carolina:
14.1% (6,099)
Number of households with income $100k - 125k:
North Myrtle Beach:
0.0% (0)
South Carolina:
6.3% (2,747)
Number of households with income $125k - 150k:
North Myrtle Beach:
70.5% (31)
State:
7.0% (3,024)
Number of households with income $150k - 200k:
North Myrtle Beach:
0.0% (0)
State:
4.6% (1,982)
Number of households with income > $200k:
North Myrtle Beach:
0.0% (0)
State:
3.2% (1,365)
Aggregate household income in North Myrtle Beach in 2022: $3,493,464
Median per capita income in North Myrtle Beach in 2022:
North Myrtle Beach:
$18,253
State:
$22,305
Change in median per capita income between 2000 and 2022:
North Myrtle Beach, South Carolina:
+78.0%
South Carolina:
+113.0%
Discuss North Myrtle Beach, South Carolina (SC) on our hugely popular South Carolina forum.