North Hurley, New Mexico (NM) income map, earnings map, and wages data

Data:
The per capita income in 2022 was $18,244, which means an increase of 20.0% compared to 2000 when it was $14,597.
Whole page based on the data from 2000 / 2022 when the population of North Hurley, New Mexico was 300 / 91
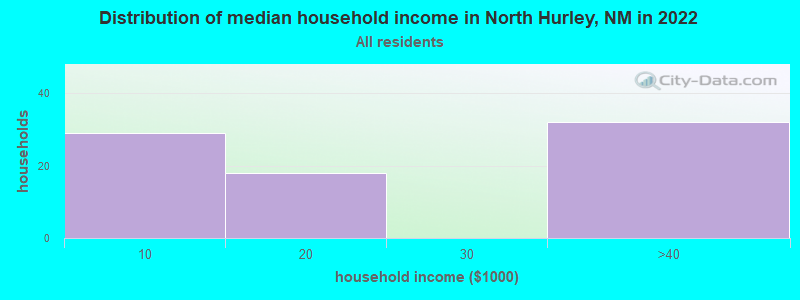
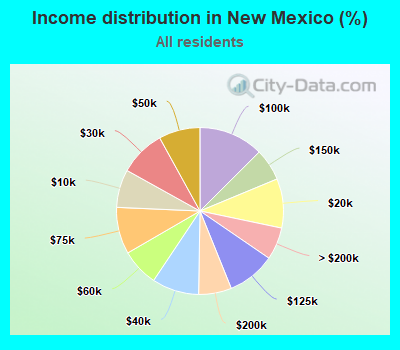
Income statistics for all residents
Number of households with income < $10k:| North Hurley: | 36.7% (29) |
| New Mexico: | 7.4% (62,451) |
Number of households with income $10k - 20k:| North Hurley: | 22.8% (18) |
| New Mexico: | 9.5% (80,886) |
Number of households with income $20k - 30k:| North Hurley: | 0.0% (0) |
| State: | 8.9% (75,578) |
Number of households with income $30k - 40k:| North Hurley: | 40.5% (32) |
| State: | 9.1% (77,319) |
Number of households with income $40k - 50k:| North Hurley: | 0.0% (0) |
| State: | 8.0% (67,979) |
Number of households with income $50k - 60k:| North Hurley: | 0.0% (0) |
| State: | 7.2% (61,477) |
Number of households with income $60k - 75k:| North Hurley: | 0.0% (0) |
| New Mexico: | 9.1% (77,047) |
Number of households with income $75k - 100k:| North Hurley: | 0.0% (0) |
| New Mexico: | 12.5% (106,292) |
Number of households with income $100k - 125k:| North Hurley: | 0.0% (0) |
| State: | 9.3% (79,200) |
Number of households with income $125k - 150k:| North Hurley: | 0.0% (0) |
| State: | 6.2% (52,769) |
Number of households with income $150k - 200k:| North Hurley: | 0.0% (0) |
| New Mexico: | 6.4% (54,020) |
Number of households with income > $200k:| North Hurley: | 0.0% (0) |
| New Mexico: | 6.3% (53,200) |
Aggregate household income in North Hurley in 2022: $1,696,406
Median per capita income in North Hurley in 2022:| North Hurley: | $18,245 |
| State: | $33,916 |
Change in median per capita income between 2000 and 2022:| North Hurley, New Mexico: | +25.0% |
| State: | +96.5% |
Income statistics for White residents
Number of households with income < $10k:| North Hurley: | 0.0% (0) |
| State: | 6.7% (30,275) |
Number of households with income $10k - 20k:| North Hurley: | 0.0% (0) |
| New Mexico: | 8.1% (36,636) |
Number of households with income $20k - 30k:| North Hurley: | 0.0% (0) |
| State: | 7.6% (34,662) |
Number of households with income $30k - 40k:| North Hurley: | 100.0% (24) |
| State: | 8.5% (38,487) |
Number of households with income $40k - 50k:| North Hurley: | 0.0% (0) |
| State: | 7.9% (35,775) |
Number of households with income $50k - 60k:| North Hurley: | 0.0% (0) |
| New Mexico: | 6.5% (29,590) |
Number of households with income $60k - 75k:| North Hurley: | 0.0% (0) |
| New Mexico: | 9.4% (42,749) |
Number of households with income $75k - 100k:| North Hurley: | 0.0% (0) |
| State: | 12.1% (54,752) |
Number of households with income $100k - 125k:| North Hurley: | 0.0% (0) |
| New Mexico: | 10.5% (47,619) |
Number of households with income $125k - 150k:| North Hurley: | 0.0% (0) |
| State: | 7.1% (32,441) |
Number of households with income $150k - 200k:| North Hurley: | 0.0% (0) |
| New Mexico: | 7.6% (34,408) |
Number of households with income > $200k:| North Hurley: | 0.0% (0) |
| State: | 8.0% (36,335) |
Aggregate household income in North Hurley in 2022: $1,245,985
Median per capita income in North Hurley in 2022:| North Hurley: | $16,227 |
| State: | $42,438 |
Change in median per capita income between 2000 and 2022:| North Hurley, New Mexico: | +2.0% |
| New Mexico: | +109.0% |
Income statistics for Asian residents
Number of households with income < $10k:| North Hurley: | 0.0% (0) |
| State: | 6.9% (867) |
Number of households with income $10k - 20k:| North Hurley: | 100.0% (38) |
| New Mexico: | 7.5% (942) |
Number of households with income $20k - 30k:| North Hurley: | 0.0% (0) |
| State: | 8.0% (1,007) |
Number of households with income $30k - 40k:| North Hurley: | 0.0% (0) |
| State: | 5.9% (746) |
Number of households with income $40k - 50k:| North Hurley: | 0.0% (0) |
| New Mexico: | 6.2% (777) |
Number of households with income $50k - 60k:| North Hurley: | 0.0% (0) |
| New Mexico: | 3.4% (422) |
Number of households with income $60k - 75k:| North Hurley: | 0.0% (0) |
| State: | 9.7% (1,224) |
Number of households with income $75k - 100k:| North Hurley: | 0.0% (0) |
| State: | 10.0% (1,259) |
Number of households with income $100k - 125k:| North Hurley: | 0.0% (0) |
| New Mexico: | 8.6% (1,076) |
Number of households with income $125k - 150k:| North Hurley: | 0.0% (0) |
| New Mexico: | 3.7% (466) |
Number of households with income $150k - 200k:| North Hurley: | 0.0% (0) |
| State: | 8.2% (1,030) |
Number of households with income > $200k:| North Hurley: | 0.0% (0) |
| State: | 22.0% (2,766) |
Aggregate household income in North Hurley in 2022: $3,338,281
Median per capita income in North Hurley in 2022:| North Hurley: | $24,227 |
| State: | $50,238 |
Change in median per capita income between 2000 and 2022:| North Hurley, New Mexico: | +116.5% |
| State: | +134.4% |
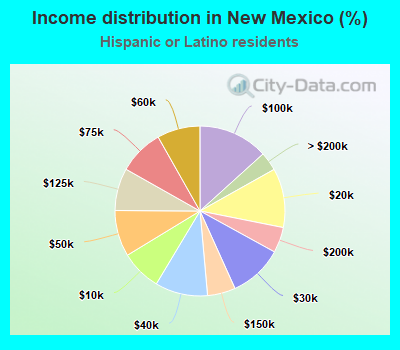
Income statistics for Hispanic or Latino residents
Number of households with income < $10k:| North Hurley: | 45.9% (28) |
| State: | 7.7% (28,825) |
Number of households with income $10k - 20k:| North Hurley: | 0.0% (0) |
| State: | 11.3% (42,162) |
Number of households with income $20k - 30k:| North Hurley: | 0.0% (0) |
| State: | 10.3% (38,397) |
Number of households with income $30k - 40k:| North Hurley: | 54.1% (33) |
| State: | 10.0% (37,425) |
Number of households with income $40k - 50k:| North Hurley: | 0.0% (0) |
| New Mexico: | 8.8% (32,925) |
Number of households with income $50k - 60k:| North Hurley: | 0.0% (0) |
| State: | 8.2% (30,606) |
Number of households with income $60k - 75k:| North Hurley: | 0.0% (0) |
| State: | 8.6% (32,270) |
Number of households with income $75k - 100k:| North Hurley: | 0.0% (0) |
| State: | 13.3% (49,793) |
Number of households with income $100k - 125k:| North Hurley: | 0.0% (0) |
| State: | 8.1% (30,306) |
Number of households with income $125k - 150k:| North Hurley: | 0.0% (0) |
| State: | 5.3% (19,926) |
Number of households with income $150k - 200k:| North Hurley: | 0.0% (0) |
| State: | 4.9% (18,186) |
Number of households with income > $200k:| North Hurley: | 0.0% (0) |
| New Mexico: | 3.6% (13,321) |
Aggregate household income in North Hurley in 2022: $1,187,900
Median per capita income in North Hurley in 2022:| North Hurley: | $24,468 |
| New Mexico: | $25,400 |
Change in median per capita income between 2000 and 2022:| North Hurley, New Mexico: | +127.6% |
| State: | +110.9% |
Income statistics for other residents
Number of households with income < $10k:| North Hurley: | 100.0% (38) |
| State: | 8.9% (10,041) |
Number of households with income $10k - 20k:| North Hurley: | 0.0% (0) |
| State: | 11.6% (13,195) |
Number of households with income $20k - 30k:| North Hurley: | 0.0% (0) |
| New Mexico: | 10.7% (12,163) |
Number of households with income $30k - 40k:| North Hurley: | 0.0% (0) |
| State: | 11.4% (12,903) |
Number of households with income $40k - 50k:| North Hurley: | 0.0% (0) |
| New Mexico: | 10.3% (11,698) |
Number of households with income $50k - 60k:| North Hurley: | 0.0% (0) |
| New Mexico: | 6.8% (7,753) |
Number of households with income $60k - 75k:| North Hurley: | 0.0% (0) |
| State: | 8.4% (9,473) |
Number of households with income $75k - 100k:| North Hurley: | 0.0% (0) |
| State: | 13.7% (15,509) |
Number of households with income $100k - 125k:| North Hurley: | 0.0% (0) |
| State: | 6.6% (7,461) |
Number of households with income $125k - 150k:| North Hurley: | 0.0% (0) |
| State: | 5.3% (6,039) |
Number of households with income $150k - 200k:| North Hurley: | 0.0% (0) |
| New Mexico: | 3.9% (4,404) |
Number of households with income > $200k:| North Hurley: | 0.0% (0) |
| New Mexico: | 2.4% (2,687) |
Aggregate household income in North Hurley in 2022: $873,747
Median per capita income in North Hurley in 2022:| North Hurley: | $23,092 |
| New Mexico: | $23,871 |
Change in median per capita income between 2000 and 2022:| North Hurley, New Mexico: | +124.1% |
| State: | +110.4% |