North Harding, New Mexico (NM) income map, earnings map, and wages data
The median household income in North Harding, NM in 2022 was $48,921, which was 22.1% less than the median annual income of $59,726 across the entire state of New Mexico. Compared to the median income of $27,750 in 2000 this represents an increase of 43.3%. The per capita income in 2022 was $33,181, which means an increase of 49.9% compared to 2000 when it was $16,636.
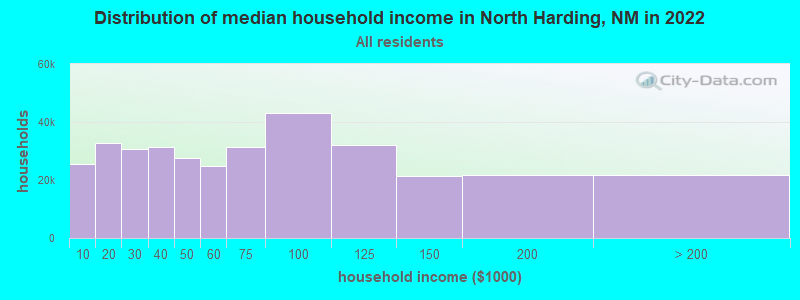
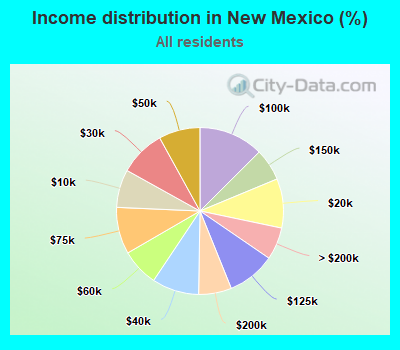
Income statistics for all residents
Median household income in North Harding, NM in 2022:| North Harding: | $48,922 |
| State: | $59,726 |
Change in median household income between 2000 and 2022:| North Harding, New Mexico: | +76.3% |
| State: | +75.0% |
Number of households with income < $10k:| North Harding: | 7.4% (25,377) |
| State: | 7.4% (62,451) |
Number of households with income $10k - 20k:| North Harding: | 9.5% (32,930) |
| State: | 9.5% (80,886) |
Number of households with income $20k - 30k:| North Harding: | 8.9% (30,746) |
| State: | 8.9% (75,578) |
Number of households with income $30k - 40k:| North Harding: | 9.1% (31,407) |
| New Mexico: | 9.1% (77,319) |
Number of households with income $40k - 50k:| North Harding: | 8.0% (27,736) |
| State: | 8.0% (67,979) |
Number of households with income $50k - 60k:| North Harding: | 7.2% (24,983) |
| State: | 7.2% (61,477) |
Number of households with income $60k - 75k:| North Harding: | 9.1% (31,377) |
| State: | 9.1% (77,047) |
Number of households with income $75k - 100k:| North Harding: | 12.5% (43,187) |
| New Mexico: | 12.5% (106,292) |
Number of households with income $100k - 125k:| North Harding: | 9.3% (32,232) |
| New Mexico: | 9.3% (79,200) |
Number of households with income $125k - 150k:| North Harding: | 6.2% (21,425) |
| State: | 6.2% (52,769) |
Number of households with income $150k - 200k:| North Harding: | 6.3% (21,890) |
| State: | 6.4% (54,020) |
Number of households with income > $200k:| North Harding: | 6.3% (21,645) |
| New Mexico: | 6.3% (53,200) |
Aggregate household income in North Harding in 2022: $198,272,191
Median family income in North Harding in 2022:| North Harding: | $73,066 |
| New Mexico: | $74,341 |
Median non-family income in North Harding in 2022:| North Harding: | $28,028 |
| New Mexico: | $36,532 |
Change in median non-family income between 2000 and 2022:| North Harding, New Mexico: | +72.5% |
| State: | +67.6% |
Median per capita income in North Harding in 2022:| North Harding: | $33,182 |
| New Mexico: | $33,916 |
Change in median per capita income between 2000 and 2022:| North Harding, New Mexico: | +99.5% |
| State: | +96.5% |
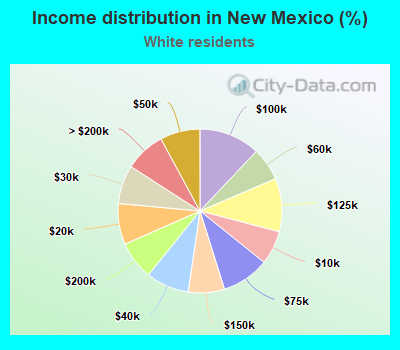
Income statistics for White residents
Median household income in North Harding, NM in 2022:| North Harding: | $52,980 |
| State: | $66,903 |
Change in median household income between 2000 and 2022:| North Harding, New Mexico: | +82.7% |
| State: | +80.9% |
Number of households with income < $10k:| North Harding: | 6.7% (11,869) |
| State: | 6.7% (30,275) |
Number of households with income $10k - 20k:| North Harding: | 8.1% (14,366) |
| New Mexico: | 8.1% (36,636) |
Number of households with income $20k - 30k:| North Harding: | 7.6% (13,593) |
| State: | 7.6% (34,662) |
Number of households with income $30k - 40k:| North Harding: | 8.5% (15,087) |
| State: | 8.5% (38,487) |
Number of households with income $40k - 50k:| North Harding: | 7.9% (14,035) |
| New Mexico: | 7.9% (35,775) |
Number of households with income $50k - 60k:| North Harding: | 6.5% (11,597) |
| State: | 6.5% (29,590) |
Number of households with income $60k - 75k:| North Harding: | 9.4% (16,775) |
| New Mexico: | 9.4% (42,749) |
Number of households with income $75k - 100k:| North Harding: | 12.1% (21,476) |
| State: | 12.1% (54,752) |
Number of households with income $100k - 125k:| North Harding: | 10.5% (18,676) |
| New Mexico: | 10.5% (47,619) |
Number of households with income $125k - 150k:| North Harding: | 7.1% (12,717) |
| New Mexico: | 7.1% (32,441) |
Number of households with income $150k - 200k:| North Harding: | 7.6% (13,487) |
| State: | 7.6% (34,408) |
Number of households with income > $200k:| North Harding: | 8.0% (14,260) |
| New Mexico: | 8.0% (36,335) |
Aggregate household income in North Harding in 2022: $105,416,970
Median family income in North Harding in 2022:| North Harding: | $83,340 |
| State: | $86,441 |
Number of families with income < $10k:| North Harding: | 5.6% (6) |
| State: | 3.2% (8,287) |
Number of families with income $10k - 20k:| North Harding: | 3.9% (4) |
| State: | 3.8% (9,892) |
Number of families with income $20k - 30k:| North Harding: | 6.7% (8) |
| New Mexico: | 4.9% (12,813) |
Number of families with income $30k - 40k:| North Harding: | 9.0% (10) |
| State: | 7.9% (20,670) |
Number of families with income $40k - 50k:| North Harding: | 9.2% (10) |
| State: | 7.4% (19,396) |
Number of families with income $50k - 60k:| North Harding: | 11.0% (12) |
| New Mexico: | 6.0% (15,747) |
Number of families with income $60k - 75k:| North Harding: | 20.2% (23) |
| State: | 10.0% (26,136) |
Number of families with income $75k - 100k:| North Harding: | 6.6% (7) |
| New Mexico: | 13.6% (35,677) |
Number of families with income $100k - 125k:| North Harding: | 7.3% (8) |
| State: | 11.9% (31,166) |
Number of families with income $125k - 150k:| North Harding: | 20.5% (23) |
| State: | 9.4% (24,562) |
Median non-family income in North Harding in 2022:| North Harding: | $31,240 |
| State: | $41,946 |
Change in median non-family income between 2000 and 2022:| North Harding, New Mexico: | +77.5% |
| State: | +80.4% |
Median per capita income in North Harding in 2022:| North Harding: | $36,523 |
| State: | $42,438 |
Change in median per capita income between 2000 and 2022:| North Harding, New Mexico: | +111.5% |
| New Mexico: | +109.0% |
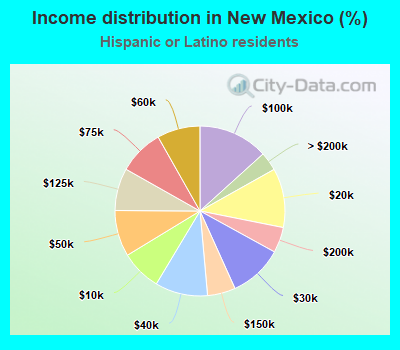
Income statistics for Hispanic or Latino residents
Median household income in North Harding, NM in 2022:| North Harding: | $43,079 |
| New Mexico: | $52,568 |
Change in median household income between 2000 and 2022:| North Harding, New Mexico: | +89.4% |
| State: | +84.9% |
Number of households with income < $10k:| North Harding: | 7.7% (11,494) |
| New Mexico: | 7.7% (28,825) |
Number of households with income $10k - 20k:| North Harding: | 11.3% (16,863) |
| New Mexico: | 11.3% (42,162) |
Number of households with income $20k - 30k:| North Harding: | 10.3% (15,388) |
| State: | 10.3% (38,397) |
Number of households with income $30k - 40k:| North Harding: | 10.0% (14,971) |
| State: | 10.0% (37,425) |
Number of households with income $40k - 50k:| North Harding: | 8.8% (13,212) |
| State: | 8.8% (32,925) |
Number of households with income $50k - 60k:| North Harding: | 8.2% (12,251) |
| State: | 8.2% (30,606) |
Number of households with income $60k - 75k:| North Harding: | 8.6% (12,924) |
| New Mexico: | 8.6% (32,270) |
Number of households with income $75k - 100k:| North Harding: | 13.3% (19,923) |
| New Mexico: | 13.3% (49,793) |
Number of households with income $100k - 125k:| North Harding: | 8.1% (12,158) |
| State: | 8.1% (30,306) |
Number of households with income $125k - 150k:| North Harding: | 5.3% (7,966) |
| State: | 5.3% (19,926) |
Number of households with income $150k - 200k:| North Harding: | 4.9% (7,269) |
| New Mexico: | 4.9% (18,186) |
Number of households with income > $200k:| North Harding: | 3.6% (5,343) |
| New Mexico: | 3.6% (13,321) |
Aggregate household income in North Harding in 2022: $29,353,053
Median family income in North Harding in 2022:| North Harding: | $70,582 |
| State: | $61,248 |
Number of families with income < $10k:| North Harding: | 14.3% (14) |
| State: | 5.3% (12,979) |
Number of families with income $10k - 20k:| North Harding: | 4.5% (5) |
| State: | 7.5% (18,298) |
Number of families with income $20k - 30k:| North Harding: | 9.2% (9) |
| New Mexico: | 8.9% (21,661) |
Number of families with income $30k - 40k:| North Harding: | 10.8% (11) |
| State: | 9.3% (22,776) |
Number of families with income $40k - 50k:| North Harding: | 8.6% (9) |
| State: | 10.0% (24,418) |
Number of families with income $50k - 60k:| North Harding: | 18.3% (18) |
| State: | 8.1% (19,722) |
Number of families with income $60k - 75k:| North Harding: | 14.0% (14) |
| New Mexico: | 9.5% (23,251) |
Number of families with income $75k - 100k:| North Harding: | 3.5% (4) |
| New Mexico: | 14.4% (35,090) |
Number of families with income $100k - 125k:| North Harding: | 3.6% (4) |
| State: | 9.8% (23,976) |
Number of families with income $125k - 150k:| North Harding: | 13.2% (13) |
| New Mexico: | 6.8% (16,727) |
Median non-family income in North Harding in 2022:| North Harding: | $20,957 |
| State: | $31,429 |
Change in median non-family income between 2000 and 2022:| North Harding, New Mexico: | +104.5% |
| New Mexico: | +86.7% |
Median per capita income in North Harding in 2022:| North Harding: | $28,725 |
| State: | $25,400 |
Change in median per capita income between 2000 and 2022:| North Harding, New Mexico: | +117.2% |
| State: | +110.9% |
Income statistics for American Indian and Alaska Native residents
Median household income in North Harding, NM in 2022:| North Harding: | $20,640 |
| New Mexico: | $43,317 |
Change in median household income between 2000 and 2022:| North Harding, New Mexico: | +83.5% |
| State: | +84.8% |
Number of households with income < $10k:| North Harding: | 13.1% (1,898) |
| New Mexico: | 12.8% (7,750) |
Number of households with income $10k - 20k:| North Harding: | 14.1% (2,042) |
| State: | 14.0% (8,481) |
Number of households with income $20k - 30k:| North Harding: | 9.6% (1,397) |
| State: | 9.4% (5,714) |
Number of households with income $30k - 40k:| North Harding: | 10.0% (1,456) |
| New Mexico: | 10.2% (6,190) |
Number of households with income $40k - 50k:| North Harding: | 7.7% (1,121) |
| New Mexico: | 7.8% (4,765) |
Number of households with income $50k - 60k:| North Harding: | 8.5% (1,232) |
| State: | 8.6% (5,205) |
Number of households with income $60k - 75k:| North Harding: | 8.3% (1,204) |
| State: | 8.3% (5,073) |
Number of households with income $75k - 100k:| North Harding: | 11.1% (1,608) |
| New Mexico: | 11.3% (6,847) |
Number of households with income $100k - 125k:| North Harding: | 7.5% (1,085) |
| New Mexico: | 7.4% (4,504) |
Number of households with income $125k - 150k:| North Harding: | 4.2% (610) |
| State: | 4.3% (2,588) |
Number of households with income $150k - 200k:| North Harding: | 3.5% (512) |
| State: | 3.5% (2,146) |
Number of households with income > $200k:| North Harding: | 2.4% (353) |
| State: | 2.5% (1,505) |
Aggregate household income in North Harding in 2022: $117,018
Median family income in North Harding in 2022:| North Harding: | $31,247 |
| State: | $49,129 |
Median non-family income in North Harding in 2022:| North Harding: | $15,104 |
| State: | $27,367 |
Change in median non-family income between 2000 and 2022:| North Harding, New Mexico: | +141.7% |
| State: | +143.4% |
Median per capita income in North Harding in 2022:| North Harding: | $24,090 |
| State: | $20,119 |
Change in median per capita income between 2000 and 2022:| North Harding, New Mexico: | +128.3% |
| State: | +131.8% |
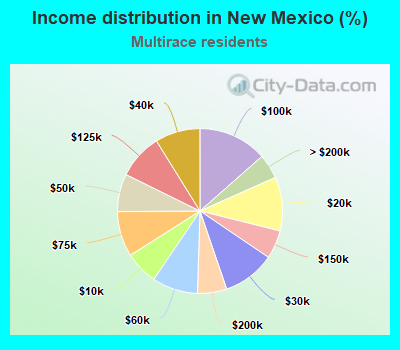
Income statistics for Multirace residents
Median household income in North Harding, NM in 2022:| North Harding: | $64,086 |
| New Mexico: | $56,942 |
Change in median household income between 2000 and 2022:| North Harding, New Mexico: | +90.8% |
| State: | +94.8% |
Number of households with income < $10k:| North Harding: | 6.5% (7,088) |
| State: | 6.5% (12,332) |
Number of households with income $10k - 20k:| North Harding: | 10.6% (11,471) |
| State: | 10.6% (19,977) |
Number of households with income $20k - 30k:| North Harding: | 10.3% (11,176) |
| State: | 10.3% (19,459) |
Number of households with income $30k - 40k:| North Harding: | 8.8% (9,601) |
| State: | 8.8% (16,721) |
Number of households with income $40k - 50k:| North Harding: | 7.4% (8,036) |
| State: | 7.4% (14,003) |
Number of households with income $50k - 60k:| North Harding: | 9.0% (9,761) |
| New Mexico: | 9.0% (16,994) |
Number of households with income $60k - 75k:| North Harding: | 8.9% (9,688) |
| New Mexico: | 8.9% (16,866) |
Number of households with income $75k - 100k:| North Harding: | 13.5% (14,690) |
| State: | 13.5% (25,577) |
Number of households with income $100k - 125k:| North Harding: | 8.9% (9,645) |
| State: | 8.9% (16,792) |
Number of households with income $125k - 150k:| North Harding: | 5.6% (6,079) |
| State: | 5.6% (10,584) |
Number of households with income $150k - 200k:| North Harding: | 5.7% (6,234) |
| New Mexico: | 5.7% (10,849) |
Number of households with income > $200k:| North Harding: | 4.8% (5,260) |
| State: | 4.8% (9,158) |
Aggregate household income in North Harding in 2022: $10,086,180
Median family income in North Harding in 2022:| North Harding: | $64,595 |
| New Mexico: | $69,202 |
Number of families with income $20k - 30k:| North Harding: | 36.3% (12) |
| New Mexico: | 8.5% (10,234) |
Number of families with income $30k - 40k:| North Harding: | 63.7% (21) |
| State: | 6.8% (8,199) |
Median non-family income in North Harding in 2022:| North Harding: | $60,269 |
| State: | $31,862 |
Change in median non-family income between 2000 and 2022:| North Harding, New Mexico: | +83.1% |
| State: | +72.1% |
Median per capita income in North Harding in 2022:| North Harding: | $43,486 |
| State: | $28,327 |
Change in median per capita income between 2000 and 2022:| North Harding, New Mexico: | +139.2% |
| New Mexico: | +141.7% |
Income statistics for other residents
Number of households with income < $10k:| North Harding: | 9.4% (3) |
| New Mexico: | 8.9% (10,041) |
Number of households with income $10k - 20k:| North Harding: | 12.5% (4) |
| New Mexico: | 11.6% (13,195) |
Number of households with income $20k - 30k:| North Harding: | 9.4% (3) |
| State: | 10.7% (12,163) |
Number of households with income $30k - 40k:| North Harding: | 9.4% (3) |
| State: | 11.4% (12,903) |
Number of households with income $40k - 50k:| North Harding: | 12.5% (4) |
| State: | 10.3% (11,698) |
Number of households with income $50k - 60k:| North Harding: | 6.2% (2) |
| State: | 6.8% (7,753) |
Number of households with income $60k - 75k:| North Harding: | 9.4% (3) |
| State: | 8.4% (9,473) |
Number of households with income $75k - 100k:| North Harding: | 12.5% (4) |
| New Mexico: | 13.7% (15,509) |
Number of households with income $100k - 125k:| North Harding: | 6.2% (2) |
| State: | 6.6% (7,461) |
Number of households with income $125k - 150k:| North Harding: | 6.2% (2) |
| New Mexico: | 5.3% (6,039) |
Number of households with income $150k - 200k:| North Harding: | 3.1% (1) |
| New Mexico: | 3.9% (4,404) |
Number of households with income > $200k:| North Harding: | 3.1% (1) |
| New Mexico: | 2.4% (2,687) |
Aggregate household income in North Harding in 2022: $1,963,649
Median family income in North Harding in 2022:| North Harding: | $51,306 |
| New Mexico: | $56,709 |
Number of families with income < $10k:| North Harding: | 6.1% (1) |
| State: | 5.8% (4,399) |
Number of families with income $10k - 20k:| North Harding: | 14.3% (2) |
| State: | 8.1% (6,127) |
Number of families with income $20k - 30k:| North Harding: | 12.1% (2) |
| New Mexico: | 9.6% (7,269) |
Number of families with income $30k - 40k:| North Harding: | 8.9% (1) |
| New Mexico: | 10.8% (8,195) |
Number of families with income $40k - 50k:| North Harding: | 15.9% (3) |
| State: | 11.6% (8,800) |
Number of families with income $50k - 60k:| North Harding: | 26.2% (4) |
| State: | 7.1% (5,371) |
Number of families with income $60k - 75k:| North Harding: | 16.5% (3) |
| State: | 9.4% (7,169) |
Median non-family income in North Harding in 2022:| North Harding: | $18,094 |
| State: | $30,209 |
Change in median non-family income between 2000 and 2022:| North Harding, New Mexico: | +122.7% |
| State: | +84.1% |
Median per capita income in North Harding in 2022:| North Harding: | $23,663 |
| State: | $23,871 |
Change in median per capita income between 2000 and 2022:| North Harding, New Mexico: | +113.6% |
| New Mexico: | +110.4% |