The median household income in North Brentwood, MD in 2022 was $86,889, which was 9.3% less than the median annual income of $94,991 across the entire state of Maryland. Compared to the median income of $37,188 in 2000 this represents an increase of 57.2%. The per capita income in 2022 was $34,616, which means an increase of 46.4% compared to 2000 when it was $18,547.
Whole page based on the data from 2000 / 2022 when the population of North Brentwood, Maryland was 469 / 758
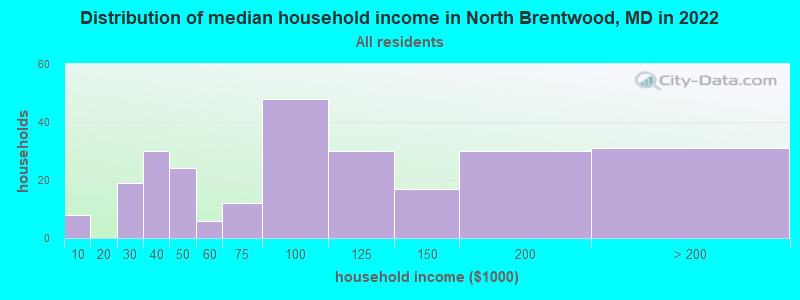
Income statistics for all residents
Median household income in North Brentwood, MD in 2022:
North Brentwood:
$86,889
Maryland:
$94,991
Change in median household income between 2000 and 2022:
North Brentwood, Maryland:
+133.6%
State:
+79.7%
Number of households with income < $10k:
North Brentwood:
3.1% (8)
State:
4.8% (114,450)
Number of households with income $10k - 20k:
North Brentwood:
0.0% (0)
Maryland:
5.0% (117,883)
Number of households with income $20k - 30k:
North Brentwood:
7.5% (19)
Maryland:
5.2% (123,350)
Number of households with income $30k - 40k:
North Brentwood:
11.8% (30)
State:
5.6% (134,104)
Number of households with income $40k - 50k:
North Brentwood:
9.4% (24)
State:
5.6% (132,932)
Number of households with income $50k - 60k:
North Brentwood:
2.4% (6)
State:
5.6% (132,707)
Number of households with income $60k - 75k:
North Brentwood:
4.7% (12)
State:
7.9% (188,335)
Number of households with income $75k - 100k:
North Brentwood:
18.8% (48)
State:
12.5% (297,873)
Number of households with income $100k - 125k:
North Brentwood:
11.8% (30)
Maryland:
10.5% (250,497)
Number of households with income $125k - 150k:
North Brentwood:
6.7% (17)
Maryland:
8.1% (193,208)
Number of households with income $150k - 200k:
North Brentwood:
11.8% (30)
Maryland:
11.6% (274,905)
Number of households with income > $200k:
North Brentwood:
12.2% (31)
State:
17.5% (415,740)
Aggregate household income in North Brentwood in 2022: $26,329,870
Median family income in North Brentwood in 2022:
North Brentwood:
$89,822
State:
$117,294
Number of families with income < $10k:
North Brentwood:
3.1% (6)
State:
2.7% (41,433)
Number of families with income $20k - 30k:
North Brentwood:
9.8% (18)
State:
3.4% (52,891)
Number of families with income $30k - 40k:
North Brentwood:
16.5% (30)
State:
4.5% (70,252)
Number of families with income $40k - 50k:
North Brentwood:
2.5% (4)
State:
4.8% (74,112)
Number of families with income $60k - 75k:
North Brentwood:
3.9% (7)
Maryland:
7.1% (109,924)
Number of families with income $75k - 100k:
North Brentwood:
20.2% (37)
State:
12.0% (185,255)
Number of families with income $100k - 125k:
North Brentwood:
16.0% (29)
Maryland:
11.2% (173,203)
Number of families with income $125k - 150k:
North Brentwood:
6.7% (12)
State:
9.3% (143,453)
Number of families with income $150k - 200k:
North Brentwood:
7.9% (14)
State:
14.2% (218,861)
Number of families with income > $200k:
North Brentwood:
13.4% (24)
Maryland:
23.2% (359,182)
Median non-family income in North Brentwood in 2022:
North Brentwood:
$66,525
State:
$57,179
Median per capita income in North Brentwood in 2022:
North Brentwood:
$34,617
State:
$49,236
Change in median per capita income between 2000 and 2022:
North Brentwood, Maryland:
+86.6%
Maryland:
+92.2%
Income statistics for White residents
Median household income in North Brentwood, MD in 2022:
North Brentwood:
$188,624
Maryland:
$107,160
Number of households with income < $10k:
North Brentwood:
0.0% (0)
State:
3.7% (47,387)
Number of households with income $10k - 20k:
North Brentwood:
0.0% (0)
Maryland:
4.1% (52,102)
Number of households with income $20k - 30k:
North Brentwood:
0.0% (0)
State:
4.6% (58,758)
Number of households with income $30k - 40k:
North Brentwood:
0.0% (0)
State:
4.7% (59,745)
Number of households with income $40k - 50k:
North Brentwood:
0.0% (0)
State:
5.0% (62,576)
Number of households with income $50k - 60k:
North Brentwood:
8.3% (2)
Maryland:
5.1% (64,484)
Number of households with income $60k - 75k:
North Brentwood:
12.5% (3)
State:
7.7% (97,019)
Number of households with income $75k - 100k:
North Brentwood:
4.2% (1)
Maryland:
11.8% (149,205)
Number of households with income $100k - 125k:
North Brentwood:
8.3% (2)
State:
10.6% (134,231)
Number of households with income $125k - 150k:
North Brentwood:
8.3% (2)
Maryland:
8.8% (111,081)
Number of households with income $150k - 200k:
North Brentwood:
16.7% (4)
Maryland:
12.9% (162,966)
Number of households with income > $200k:
North Brentwood:
41.7% (10)
State:
20.9% (264,377)
Aggregate household income in North Brentwood in 2022: $4,679,284
Median family income in North Brentwood in 2022:
North Brentwood:
$191,237
State:
$134,708
Number of families with income $20k - 30k:
North Brentwood:
11.0% (2)
State:
2.2% (18,018)
Number of families with income $60k - 75k:
North Brentwood:
4.6% (1)
State:
6.6% (53,501)
Number of families with income $75k - 100k:
North Brentwood:
4.5% (1)
State:
11.3% (91,779)
Number of families with income $125k - 150k:
North Brentwood:
13.3% (2)
Maryland:
9.9% (80,832)
Number of families with income $150k - 200k:
North Brentwood:
30.5% (5)
State:
16.0% (130,295)
Number of families with income > $200k:
North Brentwood:
36.0% (5)
Maryland:
28.1% (228,324)
Median non-family income in North Brentwood in 2022:
North Brentwood:
$242,504
Maryland:
$61,991
Median per capita income in North Brentwood in 2022:
North Brentwood:
$68,000
State:
$59,750
Income statistics for Black or African American residents
Median household income in North Brentwood, MD in 2022:
North Brentwood:
$87,470
State:
$77,368
Change in median household income between 2000 and 2022:
North Brentwood, Maryland:
+115.3%
Maryland:
+85.7%
Number of households with income < $10k:
North Brentwood:
0.0% (0)
State:
7.0% (50,093)
Number of households with income $10k - 20k:
North Brentwood:
0.0% (0)
Maryland:
7.2% (51,849)
Number of households with income $20k - 30k:
North Brentwood:
9.2% (13)
State:
5.8% (41,510)
Number of households with income $30k - 40k:
North Brentwood:
8.5% (12)
Maryland:
6.9% (49,466)
Number of households with income $40k - 50k:
North Brentwood:
15.6% (22)
State:
6.6% (47,557)
Number of households with income $50k - 60k:
North Brentwood:
2.8% (4)
Maryland:
6.2% (44,818)
Number of households with income $60k - 75k:
North Brentwood:
3.5% (5)
Maryland:
8.6% (61,728)
Number of households with income $75k - 100k:
North Brentwood:
22.0% (31)
State:
13.2% (95,107)
Number of households with income $100k - 125k:
North Brentwood:
17.0% (24)
State:
10.2% (73,579)
Number of households with income $125k - 150k:
North Brentwood:
5.0% (7)
State:
7.2% (51,970)
Number of households with income $150k - 200k:
North Brentwood:
7.1% (10)
State:
9.4% (67,623)
Number of households with income > $200k:
North Brentwood:
9.2% (13)
Maryland:
11.7% (83,862)
Aggregate household income in North Brentwood in 2022: $13,202,357
Median family income in North Brentwood in 2022:
North Brentwood:
$89,954
State:
$96,241
Number of families with income $20k - 30k:
North Brentwood:
4.3% (4)
State:
4.3% (18,629)
Number of families with income $30k - 40k:
North Brentwood:
13.7% (12)
Maryland:
6.1% (26,770)
Number of families with income $40k - 50k:
North Brentwood:
4.0% (4)
State:
6.2% (27,138)
Number of families with income $60k - 75k:
North Brentwood:
3.5% (3)
Maryland:
8.0% (35,163)
Number of families with income $75k - 100k:
North Brentwood:
27.2% (25)
Maryland:
12.8% (55,976)
Number of families with income $100k - 125k:
North Brentwood:
28.6% (26)
State:
11.4% (49,778)
Number of families with income $125k - 150k:
North Brentwood:
4.1% (4)
State:
8.8% (38,547)
Number of families with income $150k - 200k:
North Brentwood:
2.0% (2)
State:
11.8% (51,381)
Number of families with income > $200k:
North Brentwood:
12.5% (11)
State:
16.5% (71,997)
Median non-family income in North Brentwood in 2022:
North Brentwood:
$51,751
State:
$49,944
Median per capita income in North Brentwood in 2022:
North Brentwood:
$39,368
State:
$40,756
Change in median per capita income between 2000 and 2022:
North Brentwood, Maryland:
+127.7%
State:
+113.5%
Income statistics for Asian residents
Median household income in North Brentwood, MD in 2022:
North Brentwood:
$90,402
Maryland:
$117,771
Change in median household income between 2000 and 2022:
North Brentwood, Maryland:
+35.2%
Maryland:
+97.6%
Aggregate household income in North Brentwood in 2022: $868,411
Median per capita income in North Brentwood in 2022:
North Brentwood:
$44,296
State:
$53,546
Change in median per capita income between 2000 and 2022:
North Brentwood, Maryland:
+100.2%
State:
+122.9%
Income statistics for Hispanic or Latino residents
Median household income in North Brentwood, MD in 2022:
North Brentwood:
$75,605
State:
$82,138
Change in median household income between 2000 and 2022:: -62.2%
North Brentwood, Maryland:
-62.2%
State:
+70.2%
Number of households with income < $10k:
North Brentwood:
7.9% (7)
Maryland:
3.7% (6,871)
Number of households with income $10k - 20k:
North Brentwood:
0.0% (0)
State:
2.9% (5,465)
Number of households with income $20k - 30k:
North Brentwood:
6.7% (6)
Maryland:
5.9% (11,012)
Number of households with income $30k - 40k:
North Brentwood:
19.1% (17)
Maryland:
7.9% (14,668)
Number of households with income $40k - 50k:
North Brentwood:
0.0% (0)
State:
7.6% (14,074)
Number of households with income $50k - 60k:
North Brentwood:
2.2% (2)
Maryland:
7.6% (14,166)
Number of households with income $60k - 75k:
North Brentwood:
10.1% (9)
Maryland:
9.9% (18,486)
Number of households with income $75k - 100k:
North Brentwood:
23.6% (21)
Maryland:
16.1% (30,032)
Number of households with income $100k - 125k:
North Brentwood:
2.2% (2)
State:
9.4% (17,432)
Number of households with income $125k - 150k:
North Brentwood:
2.2% (2)
State:
7.5% (13,963)
Number of households with income $150k - 200k:
North Brentwood:
20.2% (18)
State:
10.1% (18,750)
Number of households with income > $200k:
North Brentwood:
5.6% (5)
Maryland:
11.4% (21,133)
Aggregate household income in North Brentwood in 2022: $7,447,451
Median family income in North Brentwood in 2022:
North Brentwood:
$68,247
State:
$80,127
Number of families with income < $10k:
North Brentwood:
4.0% (3)
Maryland:
3.1% (4,499)
Number of families with income $20k - 30k:
North Brentwood:
26.9% (22)
State:
6.8% (10,000)
Number of families with income $30k - 40k:
North Brentwood:
20.4% (17)
State:
7.6% (11,123)
Number of families with income $60k - 75k:
North Brentwood:
5.1% (4)
State:
10.2% (15,051)
Number of families with income $75k - 100k:
North Brentwood:
17.9% (15)
State:
14.6% (21,440)
Number of families with income $100k - 125k:
North Brentwood:
3.4% (3)
Maryland:
9.6% (14,146)
Number of families with income $125k - 150k:
North Brentwood:
1.9% (2)
State:
6.9% (10,202)
Number of families with income $150k - 200k:
North Brentwood:
13.0% (11)
State:
10.7% (15,752)
Number of families with income > $200k:
North Brentwood:
7.3% (6)
State:
11.6% (17,028)
Median per capita income in North Brentwood in 2022:
North Brentwood:
$21,379
State:
$29,024
Change in median per capita income between 2000 and 2022:: -57.3%
North Brentwood, Maryland:
-57.3%
State:
+79.2%
Income statistics for Multirace residents
Aggregate household income in North Brentwood in 2022: $143,311
Median per capita income in North Brentwood in 2022:
North Brentwood:
$37,125
State:
$35,630
Income statistics for other residents
Median household income in North Brentwood, MD in 2022:
North Brentwood:
$73,064
State:
$72,980
Number of households with income < $10k:
North Brentwood:
8.6% (7)
Maryland:
3.4% (3,746)
Number of households with income $10k - 20k:
North Brentwood:
0.0% (0)
Maryland:
3.5% (3,842)
Number of households with income $20k - 30k:
North Brentwood:
8.6% (7)
State:
7.6% (8,343)
Number of households with income $30k - 40k:
North Brentwood:
22.2% (18)
Maryland:
7.5% (8,251)
Number of households with income $40k - 50k:
North Brentwood:
0.0% (0)
State:
8.6% (9,414)
Number of households with income $50k - 60k:
North Brentwood:
0.0% (0)
State:
10.0% (11,048)
Number of households with income $60k - 75k:
North Brentwood:
7.4% (6)
State:
11.2% (12,339)
Number of households with income $75k - 100k:
North Brentwood:
23.5% (19)
State:
17.5% (19,277)
Number of households with income $100k - 125k:
North Brentwood:
2.5% (2)
State:
8.9% (9,813)
Number of households with income $125k - 150k:
North Brentwood:
0.0% (0)
State:
6.3% (6,907)
Number of households with income $150k - 200k:
North Brentwood:
19.8% (16)
State:
8.2% (9,023)
Number of households with income > $200k:
North Brentwood:
7.4% (6)
Maryland:
7.3% (8,036)
Aggregate household income in North Brentwood in 2022: $7,074,302
Median family income in North Brentwood in 2022:
North Brentwood:
$66,215
State:
$69,179
Number of families with income < $10k:
North Brentwood:
3.3% (3)
Maryland:
3.0% (2,713)
Number of families with income $20k - 30k:
North Brentwood:
26.5% (20)
State:
9.4% (8,390)
Number of families with income $30k - 40k:
North Brentwood:
21.9% (17)
State:
7.3% (6,474)
Number of families with income $60k - 75k:
North Brentwood:
4.8% (4)
Maryland:
11.0% (9,850)
Number of families with income $75k - 100k:
North Brentwood:
17.9% (13)
State:
15.9% (14,199)
Number of families with income $100k - 125k:
North Brentwood:
2.9% (2)
Maryland:
8.6% (7,698)
Number of families with income $150k - 200k:
North Brentwood:
12.8% (10)
Maryland:
7.9% (7,065)
Number of families with income > $200k:
North Brentwood:
9.8% (7)
State:
6.7% (6,005)
Median per capita income in North Brentwood in 2022:
North Brentwood:
$21,353
State:
$24,415
Change in median per capita income between 2000 and 2022:: -61.2%
North Brentwood, Maryland:
-61.2%
State:
+73.6%
Discuss North Brentwood, Maryland (MD) on our hugely popular Maryland forum.