The median household income in New Market, VA in 2022 was $47,100, which was 82.3% less than the median annual income of $85,873 across the entire state of Virginia. Compared to the median income of $32,365 in 2000 this represents an increase of 31.3%. The per capita income in 2022 was $35,662, which means an increase of 42.6% compared to 2000 when it was $20,480.
Whole page based on the data from 2000 / 2022 when the population of New Market, Virginia was 1,637 / 2,177
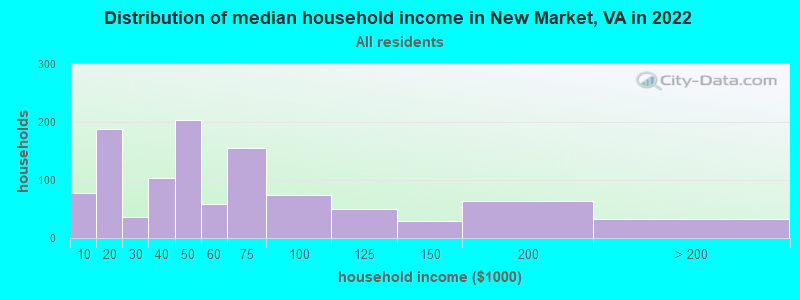
Income statistics for all residents
Median household income in New Market, VA in 2022:
New Market:
$47,100
State:
$85,873
Change in median household income between 2000 and 2022:
New Market, Virginia:
+45.5%
State:
+84.0%
Number of households with income < $10k:
New Market:
7.2% (78)
State:
4.9% (165,315)
Number of households with income $10k - 20k:
New Market:
17.5% (188)
State:
5.9% (199,380)
Number of households with income $20k - 30k:
New Market:
3.3% (36)
State:
6.0% (202,243)
Number of households with income $30k - 40k:
New Market:
9.7% (104)
State:
6.1% (205,967)
Number of households with income $40k - 50k:
New Market:
18.9% (203)
Virginia:
6.4% (215,648)
Number of households with income $50k - 60k:
New Market:
5.5% (59)
State:
6.2% (210,516)
Number of households with income $60k - 75k:
New Market:
14.5% (156)
Virginia:
8.6% (292,112)
Number of households with income $75k - 100k:
New Market:
7.0% (75)
State:
12.2% (412,198)
Number of households with income $100k - 125k:
New Market:
4.6% (50)
State:
10.3% (348,998)
Number of households with income $125k - 150k:
New Market:
2.8% (30)
State:
7.7% (261,236)
Number of households with income $150k - 200k:
New Market:
5.9% (64)
State:
10.3% (347,282)
Number of households with income > $200k:
New Market:
3.1% (33)
State:
15.4% (519,712)
Aggregate household income in New Market in 2022: $73,243,958
Median family income in New Market in 2022:
New Market:
$59,864
Virginia:
$107,101
Number of families with income < $10k:
New Market:
2.8% (15)
Virginia:
2.8% (61,637)
Number of families with income $10k - 20k:
New Market:
1.8% (9)
State:
3.3% (71,807)
Number of families with income $20k - 30k:
New Market:
5.8% (31)
State:
4.0% (87,860)
Number of families with income $30k - 40k:
New Market:
11.6% (62)
State:
4.7% (103,002)
Number of families with income $40k - 50k:
New Market:
22.4% (119)
Virginia:
5.4% (118,579)
Number of families with income $50k - 60k:
New Market:
5.8% (31)
Virginia:
5.5% (120,924)
Number of families with income $60k - 75k:
New Market:
10.1% (54)
State:
8.2% (180,564)
Number of families with income $75k - 100k:
New Market:
11.2% (60)
State:
12.6% (277,221)
Number of families with income $100k - 125k:
New Market:
5.4% (29)
State:
11.3% (248,485)
Number of families with income $125k - 150k:
New Market:
5.7% (30)
State:
9.0% (197,999)
Number of families with income $150k - 200k:
New Market:
12.0% (64)
State:
12.7% (278,323)
Number of families with income > $200k:
New Market:
5.5% (29)
State:
20.3% (445,515)
Median non-family income in New Market in 2022:
New Market:
$37,128
Virginia:
$51,436
Change in median non-family income between 2000 and 2022:
New Market, Virginia:
+132.7%
Virginia:
+73.5%
Median per capita income in New Market in 2022:
New Market:
$35,663
Virginia:
$47,199
Change in median per capita income between 2000 and 2022:
New Market, Virginia:
+74.1%
Virginia:
+96.9%
Income statistics for White residents
Median household income in New Market, VA in 2022:
New Market:
$47,167
State:
$91,924
Change in median household income between 2000 and 2022:
New Market, Virginia:
+44.0%
State:
+81.9%
Number of households with income < $10k:
New Market:
6.4% (62)
State:
4.1% (90,549)
Number of households with income $10k - 20k:
New Market:
15.7% (151)
State:
5.2% (114,324)
Number of households with income $20k - 30k:
New Market:
3.7% (36)
Virginia:
5.7% (125,676)
Number of households with income $30k - 40k:
New Market:
10.4% (100)
Virginia:
5.5% (121,220)
Number of households with income $40k - 50k:
New Market:
20.4% (197)
Virginia:
6.0% (133,011)
Number of households with income $50k - 60k:
New Market:
6.1% (59)
State:
6.2% (136,856)
Number of households with income $60k - 75k:
New Market:
15.4% (148)
State:
8.4% (186,094)
Number of households with income $75k - 100k:
New Market:
6.0% (58)
State:
12.5% (277,077)
Number of households with income $100k - 125k:
New Market:
3.6% (35)
State:
10.8% (237,562)
Number of households with income $125k - 150k:
New Market:
3.0% (29)
Virginia:
8.0% (177,532)
Number of households with income $150k - 200k:
New Market:
6.3% (61)
Virginia:
11.0% (242,106)
Number of households with income > $200k:
New Market:
2.9% (28)
State:
16.6% (366,064)
Aggregate household income in New Market in 2022: $66,550,578
Median family income in New Market in 2022:
New Market:
$58,057
State:
$114,708
Number of families with income < $10k:
New Market:
2.7% (14)
Virginia:
1.9% (27,415)
Number of families with income $10k - 20k:
New Market:
1.6% (8)
State:
2.5% (35,529)
Number of families with income $20k - 30k:
New Market:
6.4% (32)
Virginia:
3.5% (49,027)
Number of families with income $30k - 40k:
New Market:
11.5% (58)
Virginia:
3.8% (53,514)
Number of families with income $40k - 50k:
New Market:
22.2% (112)
Virginia:
4.7% (66,206)
Number of families with income $50k - 60k:
New Market:
5.9% (30)
Virginia:
5.2% (74,438)
Number of families with income $60k - 75k:
New Market:
10.5% (53)
State:
8.2% (116,265)
Number of families with income $75k - 100k:
New Market:
10.6% (53)
State:
12.9% (183,581)
Number of families with income $100k - 125k:
New Market:
5.5% (28)
Virginia:
11.9% (168,950)
Number of families with income $125k - 150k:
New Market:
5.7% (29)
State:
9.5% (134,452)
Number of families with income $150k - 200k:
New Market:
12.3% (62)
State:
13.8% (195,800)
Number of families with income > $200k:
New Market:
5.0% (25)
Virginia:
22.1% (313,072)
Median non-family income in New Market in 2022:
New Market:
$37,291
State:
$53,785
Change in median non-family income between 2000 and 2022:
New Market, Virginia:
+139.1%
Virginia:
+70.5%
Median per capita income in New Market in 2022:
New Market:
$36,351
State:
$53,456
Change in median per capita income between 2000 and 2022:
New Market, Virginia:
+74.8%
State:
+99.2%
Income statistics for Black or African American residents
Number of households with income < $10k:
New Market:
0.0% (0)
State:
8.3% (52,649)
Number of households with income $10k - 20k:
New Market:
57.8% (26)
State:
9.6% (60,583)
Number of households with income $20k - 30k:
New Market:
0.0% (0)
Virginia:
8.1% (51,220)
Number of households with income $30k - 40k:
New Market:
0.0% (0)
State:
8.6% (54,185)
Number of households with income $40k - 50k:
New Market:
0.0% (0)
State:
8.1% (51,156)
Number of households with income $50k - 60k:
New Market:
0.0% (0)
Virginia:
7.0% (44,637)
Number of households with income $60k - 75k:
New Market:
0.0% (0)
State:
9.8% (62,332)
Number of households with income $75k - 100k:
New Market:
13.3% (6)
Virginia:
11.4% (72,479)
Number of households with income $100k - 125k:
New Market:
28.9% (13)
Virginia:
8.5% (53,997)
Number of households with income $125k - 150k:
New Market:
0.0% (0)
Virginia:
6.3% (40,032)
Number of households with income $150k - 200k:
New Market:
0.0% (0)
State:
6.9% (43,513)
Number of households with income > $200k:
New Market:
0.0% (0)
State:
7.4% (46,851)
Aggregate household income in New Market in 2022: $2,316,581
Median per capita income in New Market in 2022:
New Market:
$47,996
Virginia:
$34,599
Income statistics for Asian residents
Median per capita income in New Market in 2022:
New Market:
$38,239
State:
$56,055
Income statistics for Hispanic or Latino residents
Number of households with income < $10k:
New Market:
40.9% (9)
State:
4.6% (11,664)
Number of households with income $10k - 20k:
New Market:
0.0% (0)
Virginia:
4.9% (12,443)
Number of households with income $20k - 30k:
New Market:
0.0% (0)
State:
5.9% (14,859)
Number of households with income $30k - 40k:
New Market:
0.0% (0)
Virginia:
6.8% (17,059)
Number of households with income $40k - 50k:
New Market:
22.7% (5)
Virginia:
6.4% (16,261)
Number of households with income $50k - 60k:
New Market:
0.0% (0)
Virginia:
6.9% (17,468)
Number of households with income $60k - 75k:
New Market:
0.0% (0)
State:
9.6% (24,193)
Number of households with income $75k - 100k:
New Market:
22.7% (5)
State:
13.2% (33,405)
Number of households with income $100k - 125k:
New Market:
0.0% (0)
State:
10.5% (26,356)
Number of households with income $125k - 150k:
New Market:
0.0% (0)
State:
8.1% (20,494)
Number of households with income $150k - 200k:
New Market:
0.0% (0)
State:
9.5% (23,943)
Number of households with income > $200k:
New Market:
13.6% (3)
Virginia:
13.5% (33,987)
Aggregate household income in New Market in 2022: $1,387,430
Median per capita income in New Market in 2022:
New Market:
$31,042
Virginia:
$32,277
Income statistics for American Indian and Alaska Native residents
Median per capita income in New Market in 2022:
New Market:
$29,092
State:
$34,188
Change in median per capita income between 2000 and 2022:
New Market, Virginia:
+73.2%
State:
+70.3%
Income statistics for Multirace residents
Number of households with income < $10k:
New Market:
25.0% (8)
Virginia:
4.1% (9,125)
Number of households with income $10k - 20k:
New Market:
37.5% (12)
Virginia:
5.9% (12,969)
Number of households with income $20k - 30k:
New Market:
0.0% (0)
State:
4.8% (10,563)
Number of households with income $30k - 40k:
New Market:
0.0% (0)
State:
6.6% (14,553)
Number of households with income $40k - 50k:
New Market:
0.0% (0)
State:
5.2% (11,391)
Number of households with income $50k - 60k:
New Market:
0.0% (0)
Virginia:
6.8% (14,994)
Number of households with income $60k - 75k:
New Market:
0.0% (0)
State:
8.8% (19,323)
Number of households with income $75k - 100k:
New Market:
37.5% (12)
State:
12.1% (26,729)
Number of households with income $100k - 125k:
New Market:
0.0% (0)
State:
10.4% (22,807)
Number of households with income $125k - 150k:
New Market:
0.0% (0)
State:
8.1% (17,881)
Number of households with income $150k - 200k:
New Market:
0.0% (0)
Virginia:
10.4% (22,979)
Number of households with income > $200k:
New Market:
0.0% (0)
State:
16.7% (36,748)
Aggregate household income in New Market in 2022: $1,078,990
Median per capita income in New Market in 2022:
New Market:
$13,777
State:
$34,385
Change in median per capita income between 2000 and 2022:: -85.6%
New Market, Virginia:
-85.6%
Virginia:
+130.2%
Income statistics for other residents
Median household income in New Market, VA in 2022:
New Market:
$2,561
State:
$74,720
Number of households with income < $10k:
New Market:
56.2% (9)
State:
5.1% (5,333)
Number of households with income $10k - 20k:
New Market:
0.0% (0)
State:
4.3% (4,478)
Number of households with income $20k - 30k:
New Market:
0.0% (0)
State:
7.3% (7,629)
Number of households with income $30k - 40k:
New Market:
0.0% (0)
State:
7.8% (8,201)
Number of households with income $40k - 50k:
New Market:
12.5% (2)
State:
10.1% (10,533)
Number of households with income $50k - 60k:
New Market:
0.0% (0)
State:
5.4% (5,653)
Number of households with income $60k - 75k:
New Market:
0.0% (0)
State:
10.2% (10,650)
Number of households with income $75k - 100k:
New Market:
0.0% (0)
State:
12.9% (13,493)
Number of households with income $100k - 125k:
New Market:
0.0% (0)
State:
9.7% (10,131)
Number of households with income $125k - 150k:
New Market:
0.0% (0)
State:
8.2% (8,624)
Number of households with income $150k - 200k:
New Market:
0.0% (0)
State:
8.2% (8,609)
Number of households with income > $200k:
New Market:
31.2% (5)
State:
10.8% (11,336)
Aggregate household income in New Market in 2022: $978,824
Median per capita income in New Market in 2022:
New Market:
$35,359
State:
$29,023
Discuss New Market, Virginia (VA) on our hugely popular Virginia forum.