The median household income in New Castle Northwest, PA in 2022 was $71,259, which was about the same as the median annual income of $71,798 across the entire state of Pennsylvania. Compared to the median income of $28,500 in 2000 this represents an increase of 60.0%. The per capita income in 2022 was $31,951, which means an increase of 34.0% compared to 2000 when it was $21,085.
Whole page based on the data from 2000 / 2022 when the population of New Castle Northwest, Pennsylvania was 1,535 / 1,422
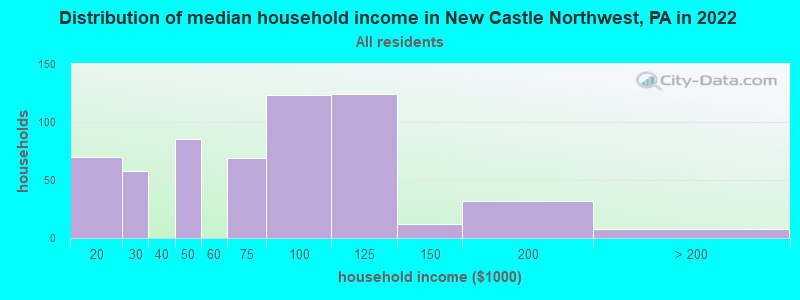
Income statistics for all residents
Median household income in New Castle Northwest, PA in 2022:
New Castle Northwest:
$71,259
State:
$71,798
Number of households with income < $10k:
New Castle Northwest:
0.0% (0)
Pennsylvania:
5.5% (291,562)
Number of households with income $10k - 20k:
New Castle Northwest:
12.0% (70)
State:
7.3% (384,726)
Number of households with income $20k - 30k:
New Castle Northwest:
10.0% (58)
State:
7.4% (389,464)
Number of households with income $30k - 40k:
New Castle Northwest:
0.0% (0)
Pennsylvania:
7.6% (402,138)
Number of households with income $40k - 50k:
New Castle Northwest:
14.6% (85)
State:
7.3% (387,945)
Number of households with income $50k - 60k:
New Castle Northwest:
0.0% (0)
State:
7.0% (372,468)
Number of households with income $60k - 75k:
New Castle Northwest:
11.9% (69)
State:
9.9% (524,786)
Number of households with income $75k - 100k:
New Castle Northwest:
21.2% (123)
State:
12.6% (666,253)
Number of households with income $100k - 125k:
New Castle Northwest:
21.3% (124)
State:
9.9% (526,402)
Number of households with income $125k - 150k:
New Castle Northwest:
2.1% (12)
State:
6.9% (362,702)
Number of households with income $150k - 200k:
New Castle Northwest:
5.5% (32)
Pennsylvania:
8.3% (440,827)
Number of households with income > $200k:
New Castle Northwest:
1.4% (8)
Pennsylvania:
10.3% (544,792)
Aggregate household income in New Castle Northwest in 2022: $44,866,929
Median family income in New Castle Northwest in 2022:
New Castle Northwest:
$93,599
State:
$93,029
Number of families with income $20k - 30k:
New Castle Northwest:
2.6% (10)
Pennsylvania:
4.8% (156,521)
Number of families with income $40k - 50k:
New Castle Northwest:
22.6% (90)
Pennsylvania:
6.4% (211,380)
Number of families with income $60k - 75k:
New Castle Northwest:
10.3% (41)
State:
9.7% (318,991)
Number of families with income $75k - 100k:
New Castle Northwest:
34.1% (136)
State:
14.0% (461,021)
Number of families with income $100k - 125k:
New Castle Northwest:
20.6% (82)
State:
12.2% (400,961)
Number of families with income $150k - 200k:
New Castle Northwest:
8.1% (32)
Pennsylvania:
11.2% (367,642)
Number of families with income > $200k:
New Castle Northwest:
1.8% (7)
State:
14.3% (470,863)
Median per capita income in New Castle Northwest in 2022:
New Castle Northwest:
$31,951
Pennsylvania:
$41,489
Change in median per capita income between 2000 and 2022:
New Castle Northwest, Pennsylvania:
+51.5%
State:
+98.7%
Income statistics for White residents
Median household income in New Castle Northwest, PA in 2022:
New Castle Northwest:
$70,846
State:
$76,765
Change in median household income between 2000 and 2022:
New Castle Northwest, Pennsylvania:
+148.6%
State:
+84.3%
Number of households with income < $10k:
New Castle Northwest:
0.0% (0)
Pennsylvania:
4.3% (179,792)
Number of households with income $10k - 20k:
New Castle Northwest:
12.1% (70)
State:
6.5% (268,738)
Number of households with income $20k - 30k:
New Castle Northwest:
9.5% (55)
Pennsylvania:
7.0% (288,138)
Number of households with income $30k - 40k:
New Castle Northwest:
0.0% (0)
State:
7.2% (300,208)
Number of households with income $40k - 50k:
New Castle Northwest:
15.1% (87)
State:
7.2% (298,756)
Number of households with income $50k - 60k:
New Castle Northwest:
0.0% (0)
State:
6.8% (283,251)
Number of households with income $60k - 75k:
New Castle Northwest:
12.0% (69)
Pennsylvania:
9.9% (408,159)
Number of households with income $75k - 100k:
New Castle Northwest:
21.3% (123)
State:
13.2% (547,809)
Number of households with income $100k - 125k:
New Castle Northwest:
21.7% (125)
Pennsylvania:
10.5% (436,652)
Number of households with income $125k - 150k:
New Castle Northwest:
2.3% (13)
Pennsylvania:
7.3% (304,132)
Number of households with income $150k - 200k:
New Castle Northwest:
4.9% (28)
State:
9.0% (374,658)
Number of households with income > $200k:
New Castle Northwest:
1.2% (7)
State:
10.9% (452,618)
Aggregate household income in New Castle Northwest in 2022: $44,244,297
Median family income in New Castle Northwest in 2022:
New Castle Northwest:
$94,658
State:
$99,396
Number of families with income $20k - 30k:
New Castle Northwest:
2.2% (9)
State:
3.9% (100,065)
Number of families with income $40k - 50k:
New Castle Northwest:
23.6% (93)
Pennsylvania:
6.0% (154,327)
Number of families with income $60k - 75k:
New Castle Northwest:
10.2% (40)
State:
9.6% (249,292)
Number of families with income $75k - 100k:
New Castle Northwest:
34.2% (135)
State:
14.7% (379,316)
Number of families with income $100k - 125k:
New Castle Northwest:
20.8% (82)
Pennsylvania:
12.9% (333,626)
Number of families with income $150k - 200k:
New Castle Northwest:
7.2% (29)
State:
12.2% (314,926)
Number of families with income > $200k:
New Castle Northwest:
1.7% (7)
State:
15.1% (390,885)
Median per capita income in New Castle Northwest in 2022:
New Castle Northwest:
$31,672
State:
$45,306
Change in median per capita income between 2000 and 2022:
New Castle Northwest, Pennsylvania:
+50.2%
State:
+105.4%
Discuss New Castle Northwest, Pennsylvania (PA) on our hugely popular Pennsylvania forum.