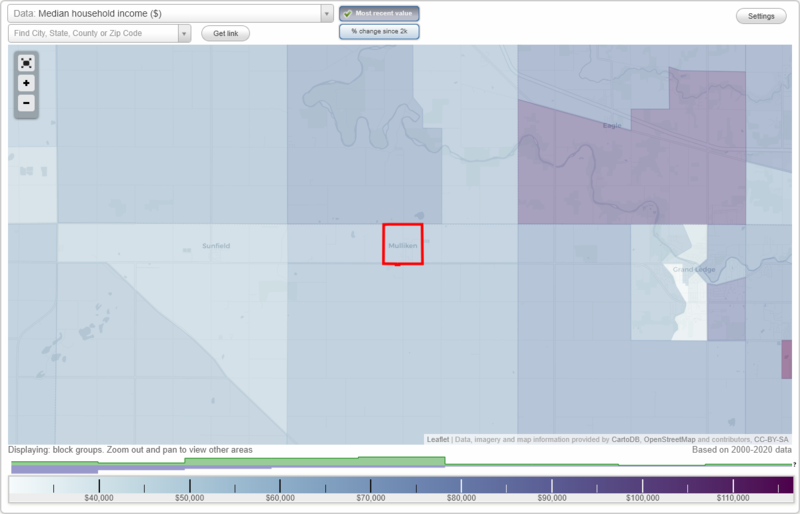
The median household income in Mulliken, MI in 2022 was $68,164, which was about the same as the median annual income of $66,986 across the entire state of Michigan. Compared to the median income of $50,391 in 2000 this represents an increase of 26.1%. The per capita income in 2022 was $31,072, which means an increase of 41.5% compared to 2000 when it was $18,181.
Whole page based on the data from 2000 / 2022 when the population of Mulliken, Michigan was 557 / 525
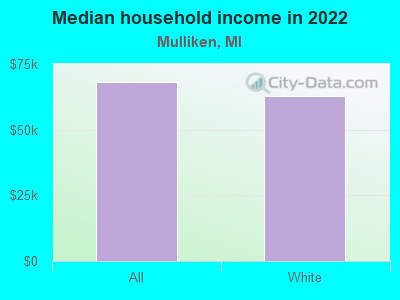
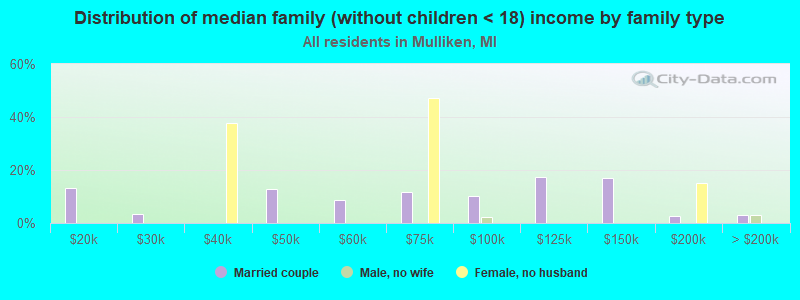
Income statistics for all residents
Median household income in Mulliken, MI in 2022:
Mulliken:
$68,164
State:
$66,986
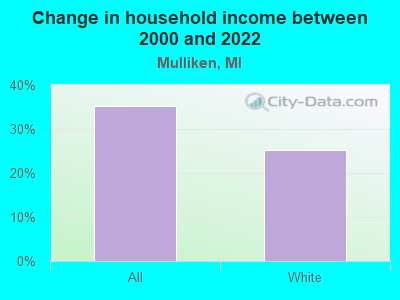
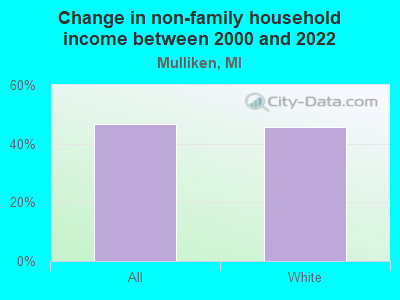
Change in median household income between 2000 and 2022:
Mulliken, Michigan:
+35.3%
State:
+50.0%
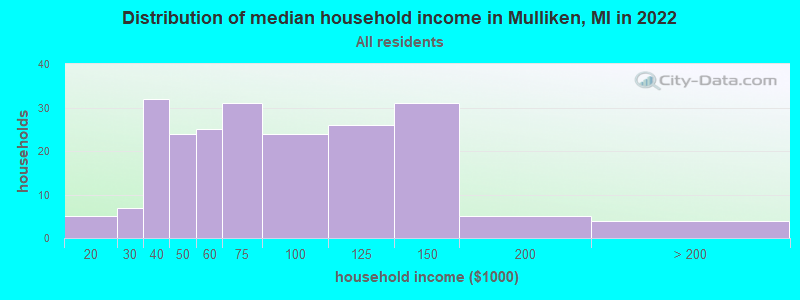
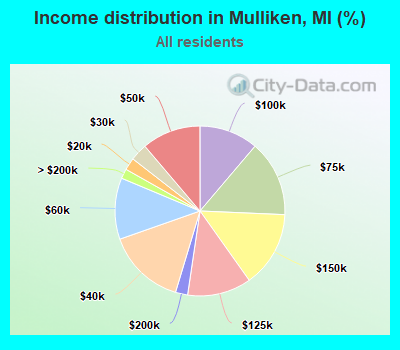
Number of households with income < $10k:
Mulliken:
0.0% (0)
State:
5.7% (231,223)
Number of households with income $10k - 20k:
Mulliken:
2.3% (5)
State:
7.5% (306,955)
Number of households with income $20k - 30k:
Mulliken:
3.3% (7)
State:
7.9% (324,153)
Number of households with income $30k - 40k:
Mulliken:
15.0% (32)
State:
8.3% (341,408)
Number of households with income $40k - 50k:
Mulliken:
11.2% (24)
State:
7.9% (322,255)
Number of households with income $50k - 60k:
Mulliken:
11.7% (25)
Michigan:
7.5% (305,914)
Number of households with income $60k - 75k:
Mulliken:
14.5% (31)
State:
10.1% (414,440)
Number of households with income $75k - 100k:
Mulliken:
11.2% (24)
Michigan:
13.2% (538,299)
Number of households with income $100k - 125k:
Mulliken:
12.1% (26)
State:
9.7% (396,282)
Number of households with income $125k - 150k:
Mulliken:
14.5% (31)
State:
6.7% (273,144)
Number of households with income $150k - 200k:
Mulliken:
2.3% (5)
Michigan:
7.5% (305,077)
Number of households with income > $200k:
Mulliken:
1.9% (4)
State:
8.1% (330,644)
Aggregate household income in Mulliken in 2022: $16,636,455
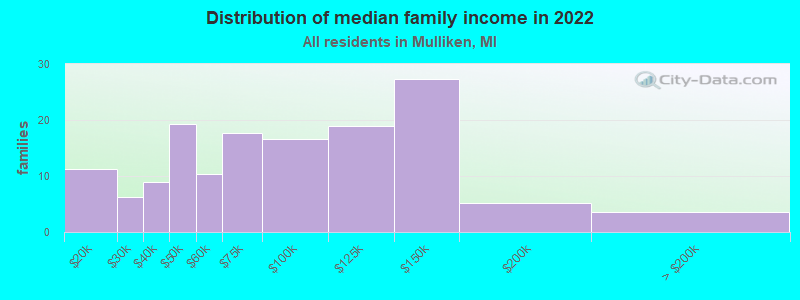
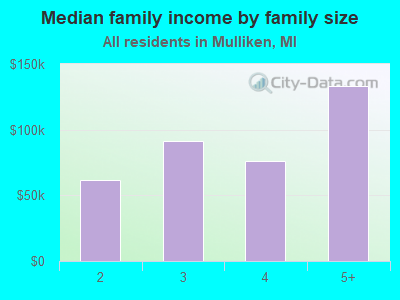
Median family income in Mulliken in 2022:
Mulliken:
$83,684
Michigan:
$85,865
Number of families with income $10k - 20k:
Mulliken:
7.7% (11)
Michigan:
3.9% (100,567)
Number of families with income $20k - 30k:
Mulliken:
4.3% (6)
State:
5.0% (127,320)
Number of families with income $30k - 40k:
Mulliken:
6.2% (9)
State:
6.4% (163,565)
Number of families with income $40k - 50k:
Mulliken:
13.2% (19)
State:
6.8% (172,384)
Number of families with income $50k - 60k:
Mulliken:
7.2% (10)
State:
7.1% (179,870)
Number of families with income $60k - 75k:
Mulliken:
12.1% (18)
Michigan:
10.3% (263,723)
Number of families with income $75k - 100k:
Mulliken:
11.4% (17)
Michigan:
15.0% (383,364)
Number of families with income $100k - 125k:
Mulliken:
13.1% (19)
State:
11.8% (301,751)
Number of families with income $125k - 150k:
Mulliken:
18.8% (27)
State:
8.6% (220,338)
Number of families with income $150k - 200k:
Mulliken:
3.6% (5)
State:
10.2% (259,462)
Number of families with income > $200k:
Mulliken:
2.5% (4)
State:
11.3% (287,206)
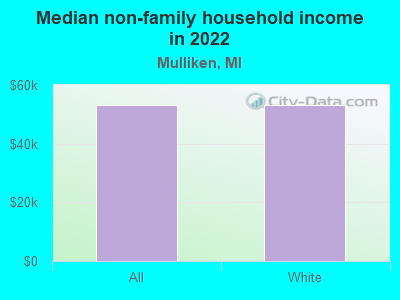
Median non-family income in Mulliken in 2022:
Mulliken:
$53,123
Michigan:
$40,459
Change in median non-family income between 2000 and 2022:
Mulliken, Michigan:
+46.5%
Michigan:
+54.5%
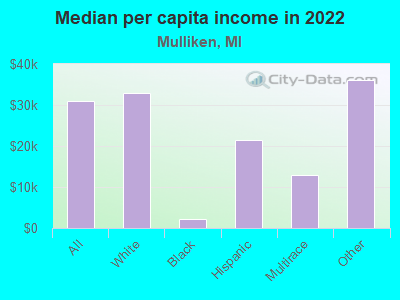
Median per capita income in Mulliken in 2022:
Mulliken:
$31,072
State:
$38,151
Change in median per capita income between 2000 and 2022:
Mulliken, Michigan:
+70.9%
Michigan:
+72.1%
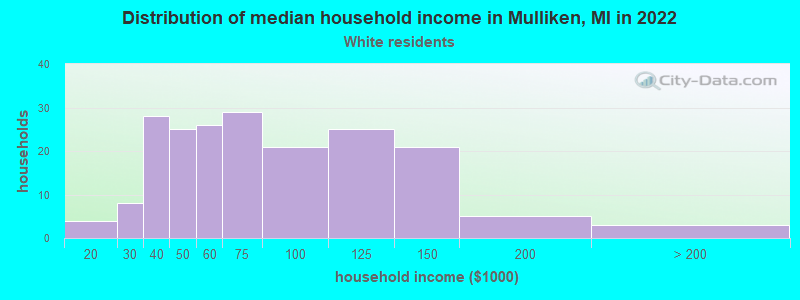
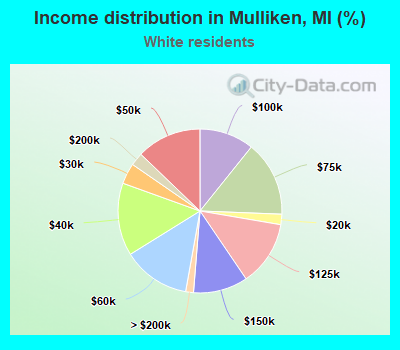
Income statistics for White residents
Median household income in Mulliken, MI in 2022:
Mulliken:
$62,836
State:
$71,609
Change in median household income between 2000 and 2022:
Mulliken, Michigan:
+25.3%
State:
+52.9%
Number of households with income < $10k:
Mulliken:
0.0% (0)
State:
4.4% (140,440)
Number of households with income $10k - 20k:
Mulliken:
2.1% (4)
State:
6.5% (205,547)
Number of households with income $20k - 30k:
Mulliken:
4.1% (8)
Michigan:
7.6% (242,254)
Number of households with income $30k - 40k:
Mulliken:
14.4% (28)
State:
8.1% (257,175)
Number of households with income $40k - 50k:
Mulliken:
12.8% (25)
State:
7.8% (246,839)
Number of households with income $50k - 60k:
Mulliken:
13.3% (26)
State:
7.4% (233,723)
Number of households with income $60k - 75k:
Mulliken:
14.9% (29)
State:
10.4% (328,664)
Number of households with income $75k - 100k:
Mulliken:
10.8% (21)
State:
13.6% (431,867)
Number of households with income $100k - 125k:
Mulliken:
12.8% (25)
Michigan:
10.3% (325,164)
Number of households with income $125k - 150k:
Mulliken:
10.8% (21)
Michigan:
7.1% (226,232)
Number of households with income $150k - 200k:
Mulliken:
2.6% (5)
State:
8.1% (255,445)
Number of households with income > $200k:
Mulliken:
1.5% (3)
Michigan:
8.7% (276,727)
Aggregate household income in Mulliken in 2022: $14,474,145
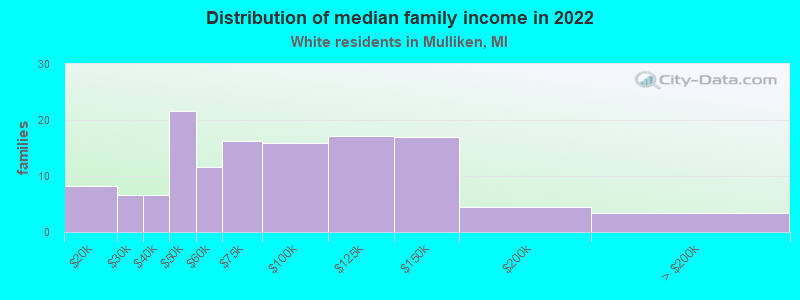
Median family income in Mulliken in 2022:
Mulliken:
$77,304
State:
$90,317
Number of families with income $10k - 20k:
Mulliken:
6.3% (8)
State:
3.2% (64,106)
Number of families with income $20k - 30k:
Mulliken:
5.1% (7)
Michigan:
4.6% (91,551)
Number of families with income $30k - 40k:
Mulliken:
5.1% (7)
State:
5.9% (117,356)
Number of families with income $40k - 50k:
Mulliken:
16.8% (22)
State:
6.4% (127,491)
Number of families with income $50k - 60k:
Mulliken:
9.1% (12)
State:
6.8% (135,883)
Number of families with income $60k - 75k:
Mulliken:
12.6% (16)
State:
10.5% (209,130)
Number of families with income $75k - 100k:
Mulliken:
12.3% (16)
State:
15.5% (309,815)
Number of families with income $100k - 125k:
Mulliken:
13.4% (17)
State:
12.4% (248,235)
Number of families with income $125k - 150k:
Mulliken:
13.1% (17)
State:
9.2% (182,895)
Number of families with income $150k - 200k:
Mulliken:
3.5% (4)
State:
11.0% (218,573)
Number of families with income > $200k:
Mulliken:
2.6% (3)
State:
12.0% (239,713)
Median non-family income in Mulliken in 2022:
Mulliken:
$53,235
State:
$42,438
Change in median non-family income between 2000 and 2022:
Mulliken, Michigan:
+45.6%
State:
+56.8%
Median per capita income in Mulliken in 2022:
Mulliken:
$33,047
Michigan:
$41,514
Change in median per capita income between 2000 and 2022:
Mulliken, Michigan:
+77.3%
State:
+75.2%
Income statistics for Black or African American residents
Median per capita income in Mulliken in 2022:
Mulliken:
$2,092
State:
$25,207
Change in median per capita income between 2000 and 2022:: -83.1%
Mulliken, Michigan:
-83.1%
State:
+60.4%
Income statistics for Hispanic or Latino residents
Aggregate household income in Mulliken in 2022: $1,246,241
Median per capita income in Mulliken in 2022:
Mulliken:
$21,434
State:
$25,462
Change in median per capita income between 2000 and 2022:
Mulliken, Michigan:
+38.0%
State:
+83.3%
Income statistics for Multirace residents
Aggregate household income in Mulliken in 2022: $1,801,246
Median per capita income in Mulliken in 2022:
Mulliken:
$12,976
Michigan:
$26,098
Change in median per capita income between 2000 and 2022:
Mulliken, Michigan:
+5.7%
Michigan:
+106.5%
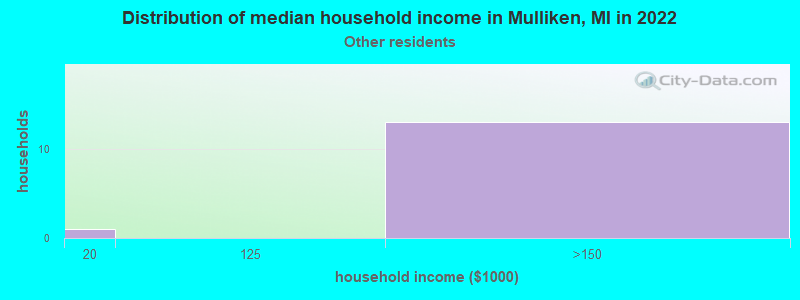
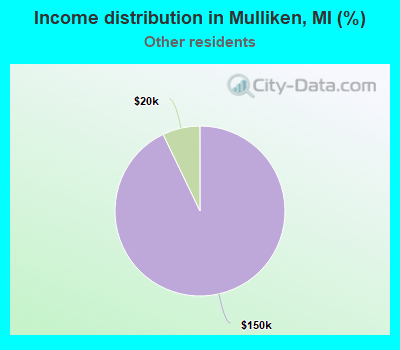
Income statistics for other residents
Number of households with income < $10k:
Mulliken:
0.0% (0)
Michigan:
7.8% (4,680)
Number of households with income $10k - 20k:
Mulliken:
7.1% (1)
Michigan:
6.4% (3,815)
Number of households with income $20k - 30k:
Mulliken:
0.0% (0)
State:
9.4% (5,582)
Number of households with income $30k - 40k:
Mulliken:
0.0% (0)
Michigan:
7.3% (4,338)
Number of households with income $40k - 50k:
Mulliken:
0.0% (0)
State:
10.2% (6,092)
Number of households with income $50k - 60k:
Mulliken:
0.0% (0)
Michigan:
8.2% (4,875)
Number of households with income $60k - 75k:
Mulliken:
0.0% (0)
Michigan:
11.6% (6,923)
Number of households with income $75k - 100k:
Mulliken:
0.0% (0)
State:
16.3% (9,741)
Number of households with income $100k - 125k:
Mulliken:
0.0% (0)
State:
8.5% (5,050)
Number of households with income $125k - 150k:
Mulliken:
92.9% (13)
State:
4.7% (2,776)
Number of households with income $150k - 200k:
Mulliken:
0.0% (0)
State:
4.5% (2,682)
Number of households with income > $200k:
Mulliken:
0.0% (0)
State:
5.2% (3,111)
Median per capita income in Mulliken in 2022:
Mulliken:
$36,166
State:
$27,114
Discuss Mulliken, Michigan (MI) on our hugely popular Michigan forum.