The median household income in Mound City, IL in 2022 was $36,675, which was 109.2% less than the median annual income of $76,708 across the entire state of Illinois. Compared to the median income of $16,607 in 2000 this represents an increase of 54.7%. The per capita income in 2022 was $20,276, which means an increase of 50.6% compared to 2000 when it was $10,020.
Whole page based on the data from 2000 / 2022 when the population of Mound City, Illinois was 692 / 787
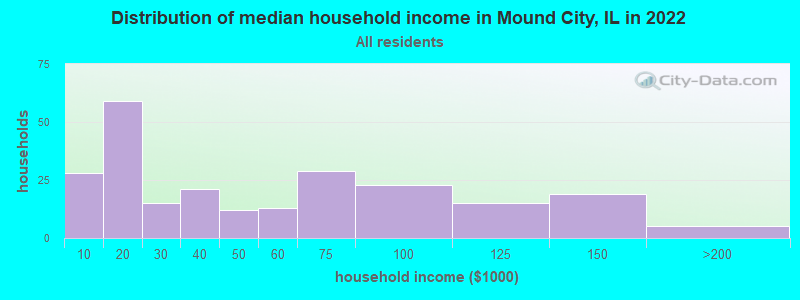
Income statistics for all residents
Median household income in Mound City, IL in 2022:
Mound City:
$36,675
State:
$76,708
Change in median household income between 2000 and 2022:
Mound City, Illinois:
+120.8%
State:
+64.6%
Number of households with income < $10k:
Mound City:
11.7% (28)
State:
5.9% (296,090)
Number of households with income $10k - 20k:
Mound City:
24.7% (59)
State:
6.6% (333,259)
Number of households with income $20k - 30k:
Mound City:
6.3% (15)
State:
6.8% (342,921)
Number of households with income $30k - 40k:
Mound City:
8.8% (21)
State:
7.0% (355,254)
Number of households with income $40k - 50k:
Mound City:
5.0% (12)
State:
6.7% (340,678)
Number of households with income $50k - 60k:
Mound City:
5.4% (13)
Illinois:
6.7% (339,405)
Number of households with income $60k - 75k:
Mound City:
12.1% (29)
State:
9.2% (465,709)
Number of households with income $75k - 100k:
Mound City:
9.6% (23)
State:
12.9% (651,353)
Number of households with income $100k - 125k:
Mound City:
6.3% (15)
State:
10.3% (522,359)
Number of households with income $125k - 150k:
Mound City:
7.9% (19)
Illinois:
7.3% (367,136)
Number of households with income $150k - 200k:
Mound City:
2.1% (5)
State:
9.0% (455,249)
Number of households with income > $200k:
Mound City:
0.0% (0)
State:
11.6% (586,947)
Aggregate household income in Mound City in 2022: $11,992,917
Median family income in Mound City in 2022:
Mound City:
$60,461
Illinois:
$96,948
Number of families with income < $10k:
Mound City:
17.2% (27)
State:
3.4% (105,875)
Number of families with income $10k - 20k:
Mound City:
12.1% (19)
State:
3.3% (105,017)
Number of families with income $20k - 30k:
Mound City:
6.1% (10)
State:
4.7% (146,403)
Number of families with income $30k - 40k:
Mound City:
7.5% (12)
Illinois:
5.3% (167,069)
Number of families with income $40k - 50k:
Mound City:
1.8% (3)
Illinois:
5.8% (181,164)
Number of families with income $50k - 60k:
Mound City:
5.1% (8)
State:
6.1% (191,561)
Number of families with income $60k - 75k:
Mound City:
15.9% (25)
State:
9.0% (282,985)
Number of families with income $75k - 100k:
Mound City:
10.9% (17)
Illinois:
13.8% (432,725)
Number of families with income $100k - 125k:
Mound City:
9.0% (14)
State:
11.9% (373,296)
Number of families with income $125k - 150k:
Mound City:
11.4% (18)
Illinois:
8.9% (279,791)
Number of families with income $150k - 200k:
Mound City:
3.0% (5)
State:
11.9% (372,004)
Median income for families with 0 earners:
Mound City:
$0
State:
$51,619
Median income for families with 1 earner:
Mound City:
$0
Illinois:
$64,303
Median income for families with 2 earners:
Mound City:
$107,814
State:
$122,565
Median income for families with 3+ earners:
Mound City:
$0
State:
$145,010
Median per capita income in Mound City in 2022:
Mound City:
$20,277
State:
$43,317
Change in median per capita income between 2000 and 2022:
Mound City, Illinois:
+102.4%
State:
+87.5%
Income statistics for White residents
Median household income in Mound City, IL in 2022:
Mound City:
$51,749
Illinois:
$83,346
Number of households with income < $10k:
Mound City:
0.0% (0)
Illinois:
4.5% (149,895)
Number of households with income $10k - 20k:
Mound City:
26.3% (26)
State:
5.5% (184,529)
Number of households with income $20k - 30k:
Mound City:
4.0% (4)
State:
6.1% (205,767)
Number of households with income $30k - 40k:
Mound City:
7.1% (7)
Illinois:
6.7% (225,572)
Number of households with income $40k - 50k:
Mound City:
6.1% (6)
State:
6.5% (216,965)
Number of households with income $50k - 60k:
Mound City:
13.1% (13)
State:
6.6% (222,841)
Number of households with income $60k - 75k:
Mound City:
24.2% (24)
State:
9.3% (312,758)
Number of households with income $75k - 100k:
Mound City:
11.1% (11)
State:
12.9% (433,180)
Number of households with income $100k - 125k:
Mound City:
0.0% (0)
Illinois:
10.7% (360,753)
Number of households with income $125k - 150k:
Mound City:
8.1% (8)
State:
7.9% (266,532)
Number of households with income $150k - 200k:
Mound City:
0.0% (0)
State:
10.0% (337,357)
Number of households with income > $200k:
Mound City:
0.0% (0)
Illinois:
13.3% (446,069)
Aggregate household income in Mound City in 2022: $5,265,305
Median family income in Mound City in 2022:
Mound City:
$68,808
State:
$107,938
Number of families with income < $10k:
Mound City:
3.6% (2)
State:
2.2% (45,983)
Number of families with income $10k - 20k:
Mound City:
6.5% (4)
State:
2.5% (50,574)
Number of families with income $20k - 30k:
Mound City:
14.5% (9)
State:
3.5% (70,927)
Number of families with income $30k - 40k:
Mound City:
1.6% (1)
Illinois:
4.4% (90,563)
Number of families with income $40k - 50k:
Mound City:
1.6% (1)
Illinois:
5.0% (102,597)
Number of families with income $50k - 60k:
Mound City:
12.7% (8)
State:
5.8% (119,129)
Number of families with income $60k - 75k:
Mound City:
38.6% (24)
Illinois:
8.8% (179,665)
Number of families with income $75k - 100k:
Mound City:
9.1% (6)
State:
13.5% (276,887)
Number of families with income $125k - 150k:
Mound City:
11.8% (7)
State:
9.8% (199,855)
Median per capita income in Mound City in 2022:
Mound City:
$20,407
State:
$50,738
Change in median per capita income between 2000 and 2022:
Mound City, Illinois:
+84.3%
State:
+95.5%
Income statistics for Black or African American residents
Median household income in Mound City, IL in 2022:
Mound City:
$26,768
State:
$45,019
Change in median household income between 2000 and 2022:
Mound City, Illinois:
+88.1%
State:
+42.0%
Number of households with income < $10k:
Mound City:
23.2% (29)
Illinois:
13.3% (92,224)
Number of households with income $10k - 20k:
Mound City:
24.8% (31)
State:
13.5% (93,732)
Number of households with income $20k - 30k:
Mound City:
8.8% (11)
Illinois:
9.9% (68,453)
Number of households with income $30k - 40k:
Mound City:
6.4% (8)
Illinois:
8.5% (59,072)
Number of households with income $40k - 50k:
Mound City:
4.8% (6)
Illinois:
7.9% (55,033)
Number of households with income $50k - 60k:
Mound City:
0.0% (0)
Illinois:
7.2% (49,556)
Number of households with income $60k - 75k:
Mound City:
2.4% (3)
Illinois:
7.8% (53,726)
Number of households with income $75k - 100k:
Mound City:
9.6% (12)
Illinois:
11.6% (80,439)
Number of households with income $100k - 125k:
Mound City:
12.0% (15)
Illinois:
7.5% (52,244)
Number of households with income $125k - 150k:
Mound City:
8.0% (10)
State:
3.9% (27,058)
Number of households with income $150k - 200k:
Mound City:
0.0% (0)
State:
4.6% (32,057)
Number of households with income > $200k:
Mound City:
0.0% (0)
State:
4.1% (28,731)
Aggregate household income in Mound City in 2022: $5,215,239
Median non-family income in Mound City in 2022:
Mound City:
$19,936
Illinois:
$29,966
Median per capita income in Mound City in 2022:
Mound City:
$21,496
State:
$28,045
Change in median per capita income between 2000 and 2022:
Mound City, Illinois:
+144.3%
State:
+90.2%
Income statistics for Multirace residents
Aggregate household income in Mound City in 2022: $1,302,067
Median per capita income in Mound City in 2022:
Mound City:
$29,890
State:
$29,285
Change in median per capita income between 2000 and 2022:
Mound City, Illinois:
+100.6%
State:
+112.9%
Discuss Mound City, Illinois (IL) on our hugely popular Illinois forum.