Moore, Texas (TX) income map, earnings map, and wages data

Data:
The per capita income in 2022 was $11,667, which means a decrease of 36.9% compared to 2000 when it was $15,975.
Whole page based on the data from 2000 / 2022 when the population of Moore, Texas was 644 / 96
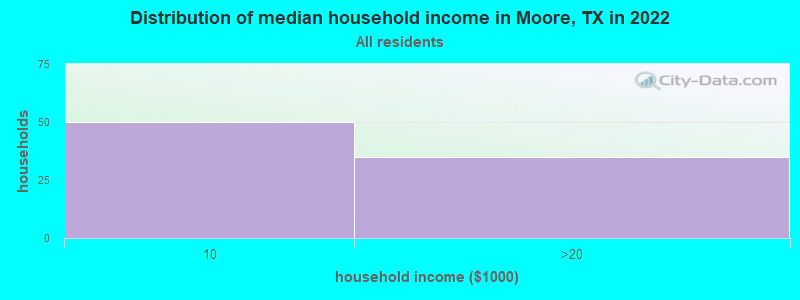
Income statistics for all residents
Number of households with income < $10k:| Moore: | 58.8% (50) |
| State: | 5.5% (611,011) |
Number of households with income $10k - 20k:| Moore: | 41.2% (35) |
| State: | 6.7% (743,157) |
Number of households with income $20k - 30k:| Moore: | 0.0% (0) |
| State: | 7.2% (803,381) |
Number of households with income $30k - 40k:| Moore: | 0.0% (0) |
| State: | 7.8% (866,080) |
Number of households with income $40k - 50k:| Moore: | 0.0% (0) |
| State: | 7.3% (810,440) |
Number of households with income $50k - 60k:| Moore: | 0.0% (0) |
| State: | 7.2% (799,783) |
Number of households with income $60k - 75k:| Moore: | 0.0% (0) |
| Texas: | 9.9% (1,095,384) |
Number of households with income $75k - 100k:| Moore: | 0.0% (0) |
| State: | 12.8% (1,419,057) |
Number of households with income $100k - 125k:| Moore: | 0.0% (0) |
| State: | 9.5% (1,054,577) |
Number of households with income $125k - 150k:| Moore: | 0.0% (0) |
| Texas: | 6.7% (741,518) |
Number of households with income $150k - 200k:| Moore: | 0.0% (0) |
| State: | 8.7% (961,776) |
Number of households with income > $200k:| Moore: | 0.0% (0) |
| State: | 10.7% (1,181,544) |
Aggregate household income in Moore in 2022: $5,697,203
Median per capita income in Moore in 2022:| Moore: | $11,667 |
| Texas: | $38,123 |
Income statistics for White residents
Number of households with income < $10k:| Moore: | 60.0% (42) |
| State: | 4.7% (273,716) |
Number of households with income $10k - 20k:| Moore: | 40.0% (28) |
| Texas: | 5.5% (322,702) |
Number of households with income $20k - 30k:| Moore: | 0.0% (0) |
| State: | 6.2% (363,947) |
Number of households with income $30k - 40k:| Moore: | 0.0% (0) |
| Texas: | 6.8% (399,275) |
Number of households with income $40k - 50k:| Moore: | 0.0% (0) |
| Texas: | 6.5% (383,417) |
Number of households with income $50k - 60k:| Moore: | 0.0% (0) |
| Texas: | 6.6% (388,535) |
Number of households with income $60k - 75k:| Moore: | 0.0% (0) |
| State: | 9.7% (566,295) |
Number of households with income $75k - 100k:| Moore: | 0.0% (0) |
| State: | 13.0% (760,276) |
Number of households with income $100k - 125k:| Moore: | 0.0% (0) |
| State: | 10.2% (597,596) |
Number of households with income $125k - 150k:| Moore: | 0.0% (0) |
| State: | 7.4% (436,830) |
Number of households with income $150k - 200k:| Moore: | 0.0% (0) |
| State: | 9.9% (583,067) |
Number of households with income > $200k:| Moore: | 0.0% (0) |
| State: | 13.5% (792,647) |
Aggregate household income in Moore in 2022: $4,906,361
Median per capita income in Moore in 2022:| Moore: | $13,751 |
| State: | $47,740 |
Income statistics for Hispanic or Latino residents
Number of households with income < $10k:| Moore: | 58.5% (48) |
| State: | 5.8% (213,953) |
Number of households with income $10k - 20k:| Moore: | 41.5% (34) |
| State: | 8.0% (297,456) |
Number of households with income $20k - 30k:| Moore: | 0.0% (0) |
| State: | 9.2% (340,166) |
Number of households with income $30k - 40k:| Moore: | 0.0% (0) |
| Texas: | 9.5% (354,336) |
Number of households with income $40k - 50k:| Moore: | 0.0% (0) |
| Texas: | 8.8% (327,013) |
Number of households with income $50k - 60k:| Moore: | 0.0% (0) |
| Texas: | 8.3% (308,818) |
Number of households with income $60k - 75k:| Moore: | 0.0% (0) |
| State: | 10.9% (405,109) |
Number of households with income $75k - 100k:| Moore: | 0.0% (0) |
| State: | 13.8% (511,639) |
Number of households with income $100k - 125k:| Moore: | 0.0% (0) |
| State: | 8.6% (319,728) |
Number of households with income $125k - 150k:| Moore: | 0.0% (0) |
| State: | 5.7% (210,932) |
Number of households with income $150k - 200k:| Moore: | 0.0% (0) |
| State: | 6.4% (236,055) |
Number of households with income > $200k:| Moore: | 0.0% (0) |
| State: | 5.1% (189,259) |
Aggregate household income in Moore in 2022: $5,402,753
Median per capita income in Moore in 2022:| Moore: | $26,941 |
| Texas: | $24,862 |
Change in median per capita income between 2000 and 2022:| Moore, Texas: | +96.3% |
| Texas: | +130.8% |