Montague, Massachusetts (MA) income map, earnings map, and wages data
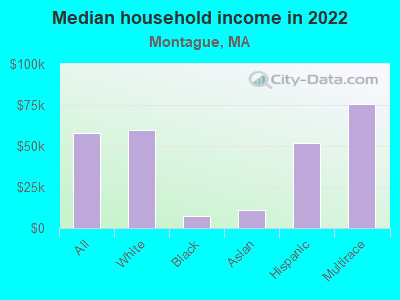
The median household income in Montague, MA in 2022 was $58,203, which was 62.3% less than the median annual income of $94,488 across the entire state of Massachusetts. Compared to the median income of $33,750 in 2000 this represents an increase of 42.0%. The per capita income in 2022 was $32,419, which means an increase of 45.1% compared to 2000 when it was $17,794.
Income statistics for all residents
Median household income in Montague, MA in 2022:| Montague: | $58,203 |
| Massachusetts: | $94,488 |
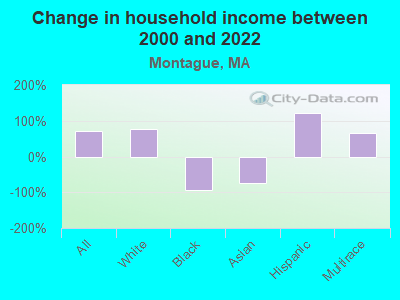
Change in median household income between 2000 and 2022:| Montague, Massachusetts: | +72.5% |
| State: | +87.1% |
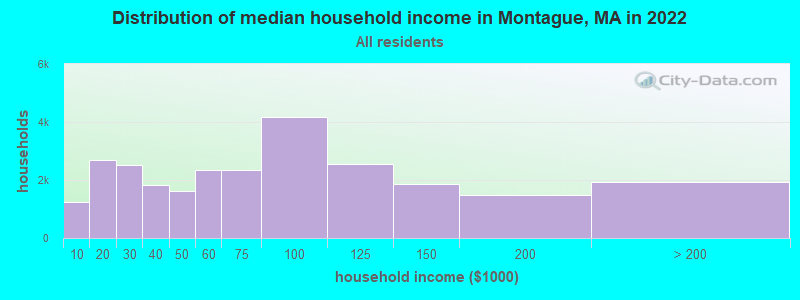
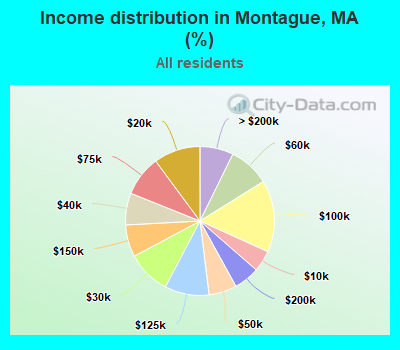
Number of households with income < $10k:| Montague: | 4.6% (1,230) |
| State: | 5.2% (146,170) |
Number of households with income $10k - 20k:| Montague: | 10.1% (2,697) |
| Massachusetts: | 6.4% (180,001) |
Number of households with income $20k - 30k:| Montague: | 9.5% (2,525) |
| Massachusetts: | 5.6% (156,667) |
Number of households with income $30k - 40k:| Montague: | 6.9% (1,842) |
| State: | 5.6% (157,168) |
Number of households with income $40k - 50k:| Montague: | 6.1% (1,614) |
| Massachusetts: | 5.4% (151,455) |
Number of households with income $50k - 60k:| Montague: | 8.9% (2,358) |
| State: | 5.1% (142,726) |
Number of households with income $60k - 75k:| Montague: | 8.8% (2,338) |
| State: | 7.6% (212,203) |
Number of households with income $75k - 100k:| Montague: | 15.6% (4,163) |
| Massachusetts: | 11.3% (317,064) |
Number of households with income $100k - 125k:| Montague: | 9.6% (2,566) |
| Massachusetts: | 9.7% (270,603) |
Number of households with income $125k - 150k:| Montague: | 7.0% (1,851) |
| State: | 8.0% (223,140) |
Number of households with income $150k - 200k:| Montague: | 5.6% (1,488) |
| State: | 11.0% (308,695) |
Number of households with income > $200k:| Montague: | 7.3% (1,937) |
| State: | 19.0% (531,884) |
Aggregate household income in Montague in 2022: $273,161,074
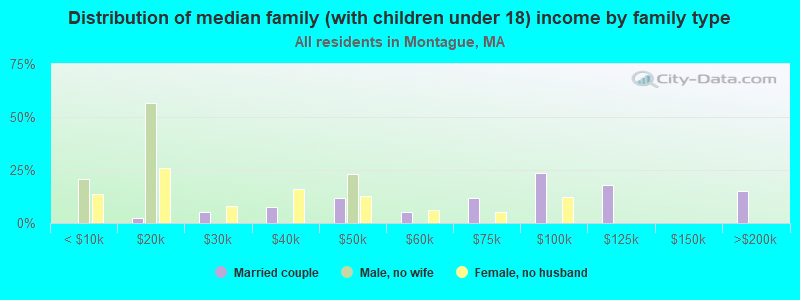
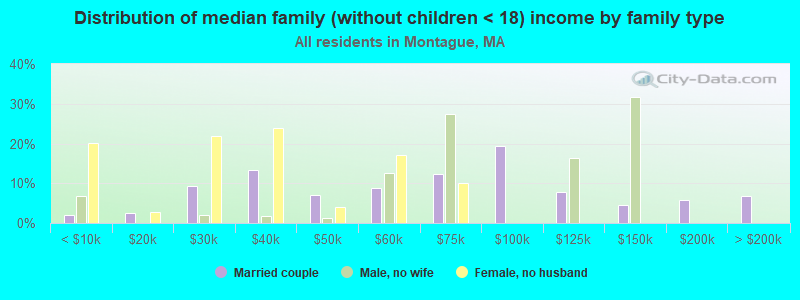
Median family income in Montague in 2022:| Montague: | $74,374 |
| Massachusetts: | $120,263 |
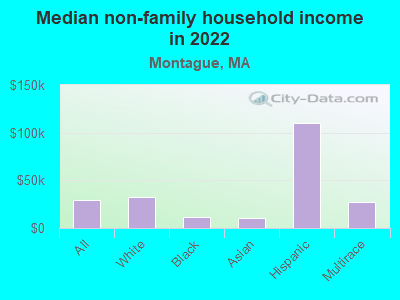
Median non-family income in Montague in 2022:| Montague: | $29,070 |
| State: | $55,979 |
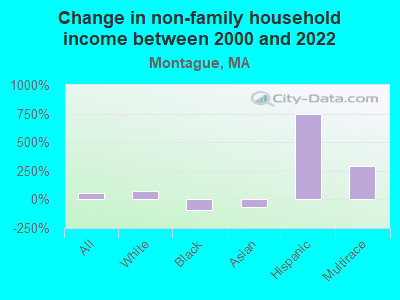
Change in median non-family income between 2000 and 2022:| Montague, Massachusetts: | +58.3% |
| Massachusetts: | +88.0% |
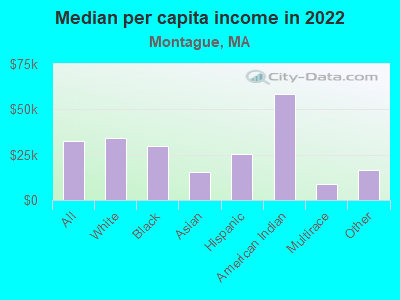
Median per capita income in Montague in 2022:| Montague: | $32,419 |
| State: | $54,025 |
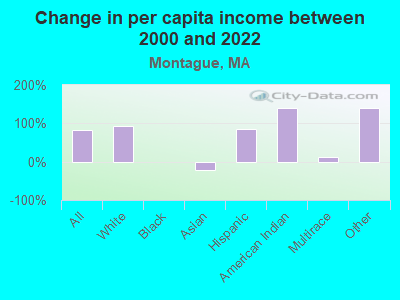
Change in median per capita income between 2000 and 2022:| Montague, Massachusetts: | +82.2% |
| State: | +108.2% |
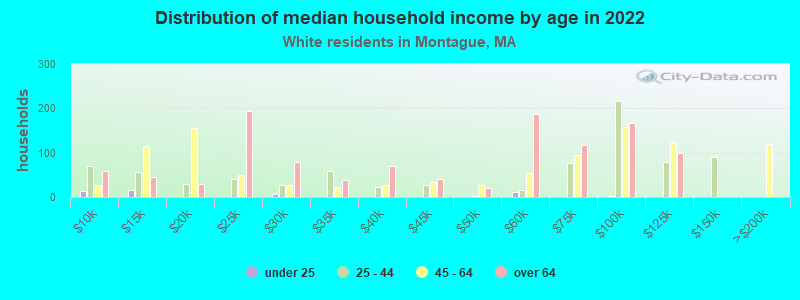
Income statistics for White residents
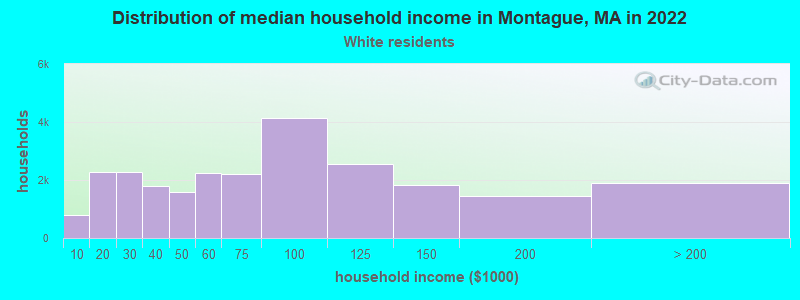
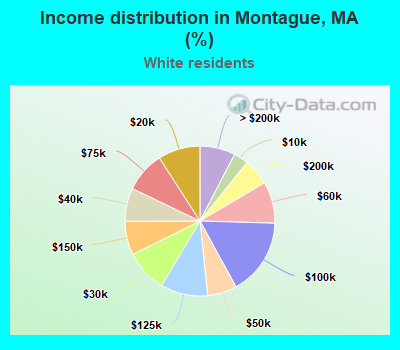
Median household income in Montague, MA in 2022:| Montague: | $59,935 |
| State: | $101,391 |
Change in median household income between 2000 and 2022:| Montague, Massachusetts: | +76.5% |
| State: | +93.3% |
Number of households with income < $10k:| Montague: | 3.1% (784) |
| State: | 4.4% (91,120) |
Number of households with income $10k - 20k:| Montague: | 9.1% (2,276) |
| State: | 5.9% (122,055) |
Number of households with income $20k - 30k:| Montague: | 9.1% (2,286) |
| Massachusetts: | 5.1% (105,311) |
Number of households with income $30k - 40k:| Montague: | 7.2% (1,794) |
| State: | 5.3% (110,239) |
Number of households with income $40k - 50k:| Montague: | 6.3% (1,583) |
| State: | 5.0% (104,636) |
Number of households with income $50k - 60k:| Montague: | 9.0% (2,243) |
| State: | 4.8% (99,486) |
Number of households with income $60k - 75k:| Montague: | 8.8% (2,200) |
| State: | 7.5% (155,124) |
Number of households with income $75k - 100k:| Montague: | 16.6% (4,148) |
| Massachusetts: | 11.4% (236,252) |
Number of households with income $100k - 125k:| Montague: | 10.2% (2,547) |
| State: | 9.9% (204,731) |
Number of households with income $125k - 150k:| Montague: | 7.3% (1,824) |
| State: | 8.5% (175,324) |
Number of households with income $150k - 200k:| Montague: | 5.7% (1,438) |
| Massachusetts: | 11.7% (242,980) |
Number of households with income > $200k:| Montague: | 7.6% (1,912) |
| State: | 20.5% (425,966) |
Aggregate household income in Montague in 2022: $264,774,600
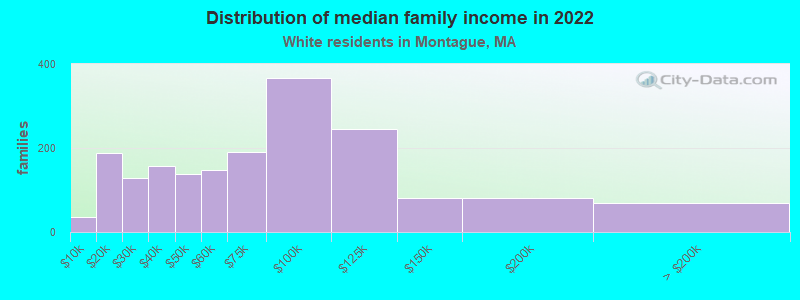
Median family income in Montague in 2022:| Montague: | $75,563 |
| State: | $133,153 |
Number of families with income < $10k:| Montague: | 2.0% (36) |
| Massachusetts: | 2.0% (25,038) |
Number of families with income $10k - 20k:| Montague: | 10.3% (188) |
| State: | 2.1% (26,403) |
Number of families with income $20k - 30k:| Montague: | 7.0% (128) |
| Massachusetts: | 2.6% (32,525) |
Number of families with income $30k - 40k:| Montague: | 8.6% (157) |
| State: | 3.9% (48,079) |
Number of families with income $40k - 50k:| Montague: | 7.6% (139) |
| Massachusetts: | 3.8% (46,908) |
Number of families with income $50k - 60k:| Montague: | 8.0% (147) |
| State: | 3.8% (46,476) |
Number of families with income $60k - 75k:| Montague: | 10.4% (191) |
| Massachusetts: | 6.4% (79,040) |
Number of families with income $75k - 100k:| Montague: | 20.0% (367) |
| State: | 11.1% (137,395) |
Number of families with income $100k - 125k:| Montague: | 13.4% (245) |
| State: | 11.1% (136,771) |
Number of families with income $125k - 150k:| Montague: | 4.5% (82) |
| Massachusetts: | 10.0% (123,709) |
Number of families with income $150k - 200k:| Montague: | 4.5% (82) |
| State: | 14.7% (181,602) |
Number of families with income > $200k:| Montague: | 3.8% (69) |
| State: | 28.5% (351,887) |
Median non-family income in Montague in 2022:| Montague: | $32,138 |
| Massachusetts: | $59,323 |
Change in median non-family income between 2000 and 2022:| Montague, Massachusetts: | +74.6% |
| Massachusetts: | +94.3% |
Median per capita income in Montague in 2022:| Montague: | $34,298 |
| State: | $60,804 |
Change in median per capita income between 2000 and 2022:| Montague, Massachusetts: | +91.7% |
| State: | +118.7% |
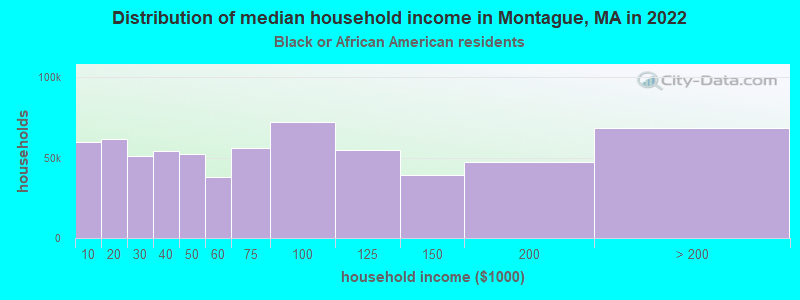
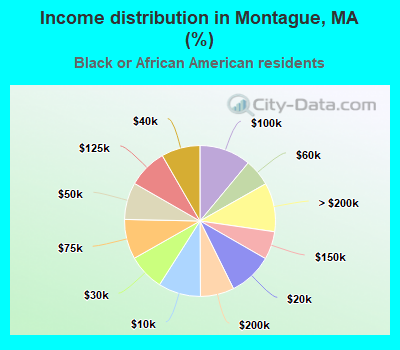
Income statistics for Black or African American residents
Median household income in Montague, MA in 2022:| Montague: | $7,597 |
| Massachusetts: | $63,189 |
Number of households with income < $10k:| Montague: | 9.1% (59,628) |
| State: | 9.1% (15,797) |
Number of households with income $10k - 20k:| Montague: | 9.4% (61,402) |
| State: | 9.4% (16,267) |
Number of households with income $20k - 30k:| Montague: | 7.8% (51,033) |
| State: | 7.8% (13,520) |
Number of households with income $30k - 40k:| Montague: | 8.3% (54,400) |
| Massachusetts: | 8.3% (14,412) |
Number of households with income $40k - 50k:| Montague: | 7.9% (52,053) |
| State: | 7.9% (13,790) |
Number of households with income $50k - 60k:| Montague: | 5.8% (37,901) |
| State: | 5.8% (10,041) |
Number of households with income $60k - 75k:| Montague: | 8.5% (55,948) |
| Massachusetts: | 8.5% (14,822) |
Number of households with income $75k - 100k:| Montague: | 11.0% (72,179) |
| State: | 11.0% (19,122) |
Number of households with income $100k - 125k:| Montague: | 8.4% (55,016) |
| State: | 8.4% (14,575) |
Number of households with income $125k - 150k:| Montague: | 6.0% (39,366) |
| State: | 6.0% (10,429) |
Number of households with income $150k - 200k:| Montague: | 7.2% (47,330) |
| State: | 7.2% (12,539) |
Number of households with income > $200k:| Montague: | 10.5% (68,642) |
| Massachusetts: | 10.5% (18,185) |
Aggregate household income in Montague in 2022: $9,022,552
Median non-family income in Montague in 2022:| Montague: | $11,066 |
| Massachusetts: | $38,934 |
Median per capita income in Montague in 2022:| Montague: | $30,055 |
| State: | $33,524 |
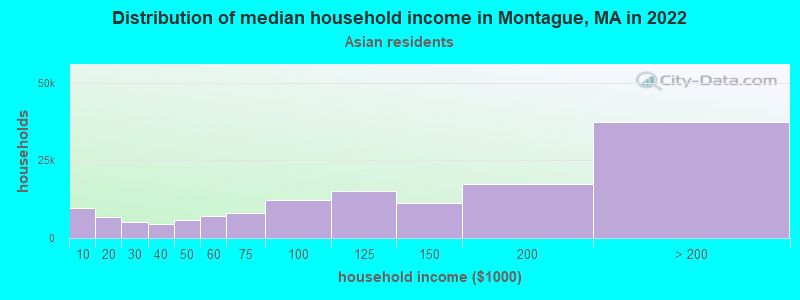
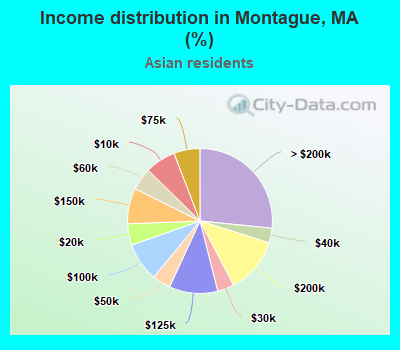
Income statistics for Asian residents
Median household income in Montague, MA in 2022:| Montague: | $11,173 |
| State: | $117,855 |
Number of households with income < $10k:| Montague: | 6.8% (9,587) |
| Massachusetts: | 6.8% (11,982) |
Number of households with income $10k - 20k:| Montague: | 4.8% (6,702) |
| State: | 4.8% (8,376) |
Number of households with income $20k - 30k:| Montague: | 3.7% (5,247) |
| Massachusetts: | 3.7% (6,558) |
Number of households with income $30k - 40k:| Montague: | 3.3% (4,599) |
| State: | 3.3% (5,748) |
Number of households with income $40k - 50k:| Montague: | 4.1% (5,754) |
| Massachusetts: | 4.1% (7,192) |
Number of households with income $50k - 60k:| Montague: | 5.0% (6,988) |
| Massachusetts: | 5.0% (8,734) |
Number of households with income $60k - 75k:| Montague: | 5.8% (8,163) |
| State: | 5.8% (10,203) |
Number of households with income $75k - 100k:| Montague: | 8.6% (12,125) |
| Massachusetts: | 8.6% (15,154) |
Number of households with income $100k - 125k:| Montague: | 10.8% (15,155) |
| Massachusetts: | 10.8% (18,942) |
Number of households with income $125k - 150k:| Montague: | 8.0% (11,231) |
| Massachusetts: | 8.0% (14,037) |
Number of households with income $150k - 200k:| Montague: | 12.5% (17,487) |
| Massachusetts: | 12.5% (21,856) |
Number of households with income > $200k:| Montague: | 26.6% (37,359) |
| Massachusetts: | 26.6% (46,694) |
Aggregate household income in Montague in 2022: $1,883,271
Median non-family income in Montague in 2022:| Montague: | $10,895 |
| Massachusetts: | $71,440 |
Median per capita income in Montague in 2022:| Montague: | $15,407 |
| State: | $58,900 |
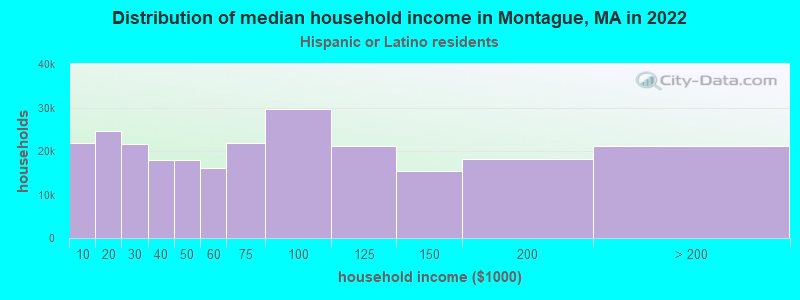
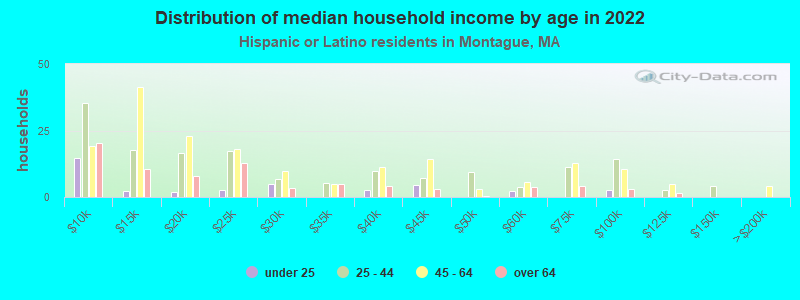
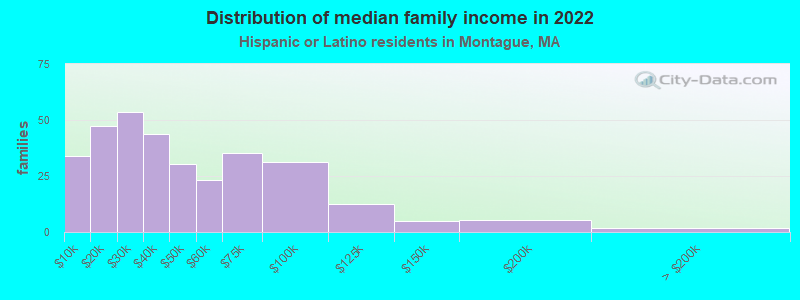
Income statistics for Hispanic or Latino residents
Median household income in Montague, MA in 2022:| Montague: | $51,870 |
| State: | $61,523 |
Change in median household income between 2000 and 2022:| Montague, Massachusetts: | +120.5% |
| State: | +125.4% |
Number of households with income < $10k:| Montague: | 8.8% (21,806) |
| State: | 8.8% (25,307) |
Number of households with income $10k - 20k:| Montague: | 10.0% (24,688) |
| State: | 10.0% (28,653) |
Number of households with income $20k - 30k:| Montague: | 8.8% (21,705) |
| Massachusetts: | 8.8% (25,189) |
Number of households with income $30k - 40k:| Montague: | 7.2% (17,941) |
| State: | 7.2% (20,822) |
Number of households with income $40k - 50k:| Montague: | 7.2% (17,937) |
| State: | 7.2% (20,817) |
Number of households with income $50k - 60k:| Montague: | 6.5% (16,154) |
| State: | 6.5% (18,748) |
Number of households with income $60k - 75k:| Montague: | 8.8% (21,877) |
| State: | 8.8% (25,390) |
Number of households with income $75k - 100k:| Montague: | 12.0% (29,717) |
| State: | 12.0% (34,488) |
Number of households with income $100k - 125k:| Montague: | 8.6% (21,196) |
| State: | 8.6% (24,599) |
Number of households with income $125k - 150k:| Montague: | 6.2% (15,288) |
| State: | 6.2% (17,743) |
Number of households with income $150k - 200k:| Montague: | 7.3% (18,109) |
| State: | 7.3% (21,017) |
Number of households with income > $200k:| Montague: | 8.6% (21,202) |
| Massachusetts: | 8.6% (24,606) |
Aggregate household income in Montague in 2022: $9,877,357
Median family income in Montague in 2022:| Montague: | $58,517 |
| State: | $66,072 |
Number of families with income < $10k:| Montague: | 10.5% (34) |
| State: | 6.2% (12,456) |
Number of families with income $10k - 20k:| Montague: | 14.7% (47) |
| Massachusetts: | 6.0% (12,071) |
Number of families with income $20k - 30k:| Montague: | 16.6% (53) |
| State: | 10.1% (20,376) |
Number of families with income $30k - 40k:| Montague: | 13.5% (44) |
| Massachusetts: | 8.2% (16,470) |
Number of families with income $40k - 50k:| Montague: | 9.4% (30) |
| State: | 7.4% (14,829) |
Number of families with income $50k - 60k:| Montague: | 7.1% (23) |
| Massachusetts: | 7.3% (14,643) |
Number of families with income $60k - 75k:| Montague: | 10.9% (35) |
| State: | 10.6% (21,252) |
Number of families with income $75k - 100k:| Montague: | 9.7% (31) |
| State: | 12.0% (24,088) |
Number of families with income $100k - 125k:| Montague: | 3.9% (13) |
| State: | 8.9% (17,954) |
Number of families with income $125k - 150k:| Montague: | 1.5% (5) |
| Massachusetts: | 6.9% (13,837) |
Number of families with income $150k - 200k:| Montague: | 1.6% (5) |
| State: | 7.3% (14,683) |
Number of families with income > $200k:| Montague: | 0.6% (2) |
| State: | 9.3% (18,741) |
Median non-family income in Montague in 2022:| Montague: | $109,982 |
| State: | $37,563 |
Median per capita income in Montague in 2022:| Montague: | $25,472 |
| Massachusetts: | $28,993 |
Change in median per capita income between 2000 and 2022:| Montague, Massachusetts: | +84.1% |
| State: | +142.4% |
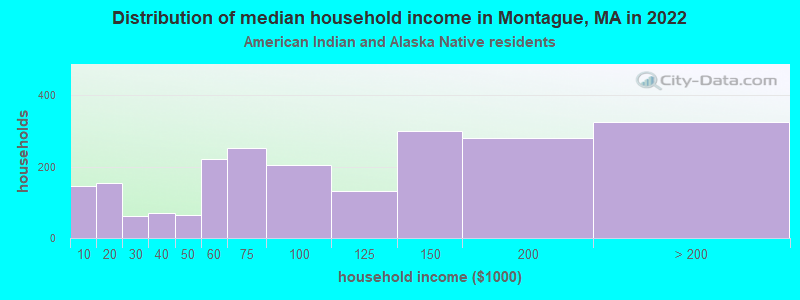
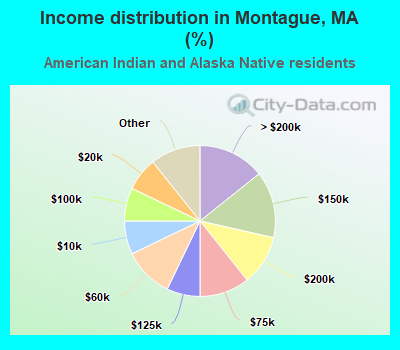
Income statistics for American Indian and Alaska Native residents
Number of households with income < $10k:| Montague: | 7.1% (2) |
| State: | 6.6% (451) |
Number of households with income $10k - 20k:| Montague: | 7.1% (2) |
| State: | 7.0% (476) |
Number of households with income $20k - 30k:| Montague: | 3.6% (1) |
| Massachusetts: | 2.8% (192) |
Number of households with income $30k - 40k:| Montague: | 3.6% (1) |
| State: | 3.2% (218) |
Number of households with income $40k - 50k:| Montague: | 3.6% (1) |
| State: | 2.9% (199) |
Number of households with income $50k - 60k:| Montague: | 10.7% (3) |
| State: | 9.9% (677) |
Number of households with income $60k - 75k:| Montague: | 10.7% (3) |
| Massachusetts: | 11.5% (781) |
Number of households with income $75k - 100k:| Montague: | 7.1% (2) |
| State: | 9.2% (629) |
Number of households with income $100k - 125k:| Montague: | 7.1% (2) |
| State: | 6.0% (406) |
Number of households with income $125k - 150k:| Montague: | 14.3% (4) |
| State: | 13.5% (921) |
Number of households with income $150k - 200k:| Montague: | 10.7% (3) |
| State: | 12.6% (859) |
Number of households with income > $200k:| Montague: | 14.3% (4) |
| Massachusetts: | 14.7% (1,003) |
Aggregate household income in Montague in 2022: $3,078,638
Median per capita income in Montague in 2022:| Montague: | $58,718 |
| Massachusetts: | $39,434 |
Change in median per capita income between 2000 and 2022:| Montague, Massachusetts: | +140.2% |
| Massachusetts: | +148.2% |
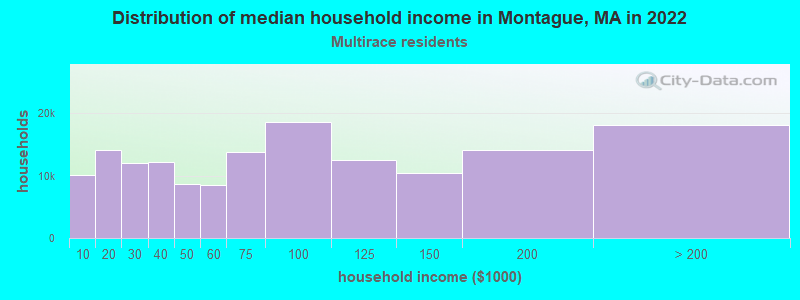
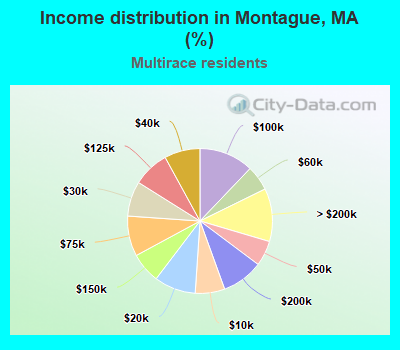
Income statistics for Multirace residents
Median household income in Montague, MA in 2022:| Montague: | $75,401 |
| State: | $71,552 |
Change in median household income between 2000 and 2022:| Montague, Massachusetts: | +66.2% |
| Massachusetts: | +109.0% |
Number of households with income < $10k:| Montague: | 6.6% (10,086) |
| State: | 6.6% (15,127) |
Number of households with income $10k - 20k:| Montague: | 9.3% (14,178) |
| Massachusetts: | 9.2% (21,158) |
Number of households with income $20k - 30k:| Montague: | 7.8% (11,950) |
| Massachusetts: | 7.8% (18,016) |
Number of households with income $30k - 40k:| Montague: | 8.0% (12,190) |
| Massachusetts: | 7.9% (18,260) |
Number of households with income $40k - 50k:| Montague: | 5.7% (8,650) |
| State: | 5.6% (13,027) |
Number of households with income $50k - 60k:| Montague: | 5.6% (8,564) |
| Massachusetts: | 5.6% (12,909) |
Number of households with income $60k - 75k:| Montague: | 9.0% (13,774) |
| State: | 9.0% (20,800) |
Number of households with income $75k - 100k:| Montague: | 12.1% (18,584) |
| Massachusetts: | 12.1% (27,875) |
Number of households with income $100k - 125k:| Montague: | 8.1% (12,417) |
| State: | 8.1% (18,754) |
Number of households with income $125k - 150k:| Montague: | 6.8% (10,347) |
| Massachusetts: | 6.8% (15,621) |
Number of households with income $150k - 200k:| Montague: | 9.2% (14,148) |
| Massachusetts: | 9.4% (21,618) |
Number of households with income > $200k:| Montague: | 11.8% (18,119) |
| State: | 12.0% (27,592) |
Aggregate household income in Montague in 2022: $2,692,353
Median family income in Montague in 2022:| Montague: | $106,347 |
| Massachusetts: | $78,380 |
Number of families with income $40k - 50k:| Montague: | 100.0% (16) |
| State: | 5.3% (8,255) |
Median non-family income in Montague in 2022:| Montague: | $27,707 |
| State: | $42,253 |
Median per capita income in Montague in 2022:| Montague: | $8,747 |
| Massachusetts: | $34,029 |
Change in median per capita income between 2000 and 2022:| Montague, Massachusetts: | +12.0% |
| State: | +132.1% |
Income statistics for other residents
Number of households with income < $10k:| Montague: | 7.1% (1) |
| State: | 8.4% (11,559) |
Number of households with income $10k - 20k:| Montague: | 7.1% (1) |
| State: | 8.4% (11,499) |
Number of households with income $20k - 30k:| Montague: | 14.3% (2) |
| Massachusetts: | 9.5% (13,070) |
Number of households with income $30k - 40k:| Montague: | 0.0% (0) |
| State: | 6.0% (8,291) |
Number of households with income $40k - 50k:| Montague: | 14.3% (2) |
| Massachusetts: | 9.2% (12,611) |
Number of households with income $50k - 60k:| Montague: | 7.1% (1) |
| State: | 7.9% (10,879) |
Number of households with income $60k - 75k:| Montague: | 7.1% (1) |
| State: | 7.5% (10,239) |
Number of households with income $75k - 100k:| Montague: | 14.3% (2) |
| Massachusetts: | 13.1% (18,032) |
Number of households with income $100k - 125k:| Montague: | 7.1% (1) |
| State: | 9.6% (13,141) |
Number of households with income $125k - 150k:| Montague: | 7.1% (1) |
| State: | 5.0% (6,808) |
Number of households with income $150k - 200k:| Montague: | 7.1% (1) |
| Massachusetts: | 6.4% (8,843) |
Number of households with income > $200k:| Montague: | 7.1% (1) |
| State: | 9.0% (12,396) |
Aggregate household income in Montague in 2022: $373,133
Median per capita income in Montague in 2022:| Montague: | $16,524 |
| Massachusetts: | $30,797 |
Change in median per capita income between 2000 and 2022:| Montague, Massachusetts: | +138.9% |
| State: | +188.5% |