Mineville-Witherbee, New York (NY) income map, earnings map, and wages data
The median household income in Mineville-Witherbee, NY in 2022 was $66,591, which was 19.5% less than the median annual income of $79,557 across the entire state of New York. Compared to the median income of $36,579 in 2000 this represents an increase of 45.1%. The per capita income in 2022 was $49,803, which means an increase of 50.9% compared to 2000 when it was $24,440.
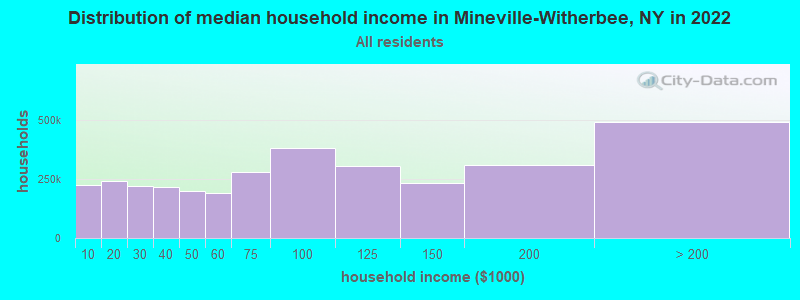
Income statistics for all residents
Median household income in Mineville-Witherbee, NY in 2022:| Mineville-Witherbee: | $66,591 |
| State: | $79,557 |
Change in median household income between 2000 and 2022:| Mineville-Witherbee, New York: | +82.0% |
| State: | +83.3% |
Number of households with income < $10k:| Mineville-Witherbee: | 6.8% (222,487) |
| State: | 6.8% (527,598) |
Number of households with income $10k - 20k:| Mineville-Witherbee: | 7.4% (242,409) |
| State: | 7.4% (574,940) |
Number of households with income $20k - 30k:| Mineville-Witherbee: | 6.7% (218,265) |
| State: | 6.7% (517,718) |
Number of households with income $30k - 40k:| Mineville-Witherbee: | 6.5% (213,592) |
| New York: | 6.5% (506,674) |
Number of households with income $40k - 50k:| Mineville-Witherbee: | 6.1% (198,304) |
| State: | 6.1% (470,439) |
Number of households with income $50k - 60k:| Mineville-Witherbee: | 5.8% (191,390) |
| New York: | 5.8% (454,042) |
Number of households with income $60k - 75k:| Mineville-Witherbee: | 8.5% (277,150) |
| New York: | 8.5% (657,508) |
Number of households with income $75k - 100k:| Mineville-Witherbee: | 11.6% (379,287) |
| State: | 11.6% (899,824) |
Number of households with income $100k - 125k:| Mineville-Witherbee: | 9.3% (305,107) |
| State: | 9.3% (723,825) |
Number of households with income $125k - 150k:| Mineville-Witherbee: | 7.1% (232,867) |
| New York: | 7.1% (552,420) |
Number of households with income $150k - 200k:| Mineville-Witherbee: | 9.4% (306,516) |
| New York: | 9.4% (727,051) |
Number of households with income > $200k:| Mineville-Witherbee: | 15.0% (490,099) |
| New York: | 15.0% (1,162,269) |
Aggregate household income in Mineville-Witherbee in 2022: $8,352,794,097
Median family income in Mineville-Witherbee in 2022:| Mineville-Witherbee: | $82,109 |
| New York: | $99,066 |
Median non-family income in Mineville-Witherbee in 2022:| Mineville-Witherbee: | $25,884 |
| New York: | $50,181 |
Change in median non-family income between 2000 and 2022:| Mineville-Witherbee, New York: | +81.3% |
| State: | +85.4% |
Median per capita income in Mineville-Witherbee in 2022:| Mineville-Witherbee: | $49,803 |
| State: | $47,421 |
Change in median per capita income between 2000 and 2022:| Mineville-Witherbee, New York: | +103.8% |
| State: | +102.7% |
Income statistics for White residents
Median household income in Mineville-Witherbee, NY in 2022:| Mineville-Witherbee: | $67,059 |
| New York: | $89,408 |
Change in median household income between 2000 and 2022:| Mineville-Witherbee, New York: | +83.3% |
| State: | +85.5% |
Number of households with income < $10k:| Mineville-Witherbee: | 4.8% (85,215) |
| New York: | 4.8% (225,550) |
Number of households with income $10k - 20k:| Mineville-Witherbee: | 6.1% (109,794) |
| State: | 6.1% (289,425) |
Number of households with income $20k - 30k:| Mineville-Witherbee: | 6.0% (106,496) |
| State: | 5.9% (280,254) |
Number of households with income $30k - 40k:| Mineville-Witherbee: | 6.1% (109,662) |
| New York: | 6.1% (288,263) |
Number of households with income $40k - 50k:| Mineville-Witherbee: | 5.9% (105,895) |
| State: | 5.9% (278,079) |
Number of households with income $50k - 60k:| Mineville-Witherbee: | 5.7% (101,945) |
| State: | 5.7% (267,554) |
Number of households with income $60k - 75k:| Mineville-Witherbee: | 8.5% (151,816) |
| State: | 8.4% (398,344) |
Number of households with income $75k - 100k:| Mineville-Witherbee: | 11.8% (211,418) |
| New York: | 11.8% (554,841) |
Number of households with income $100k - 125k:| Mineville-Witherbee: | 10.0% (178,503) |
| State: | 10.0% (469,794) |
Number of households with income $125k - 150k:| Mineville-Witherbee: | 7.7% (136,890) |
| New York: | 7.6% (360,467) |
Number of households with income $150k - 200k:| Mineville-Witherbee: | 10.1% (180,317) |
| State: | 10.1% (477,078) |
Number of households with income > $200k:| Mineville-Witherbee: | 17.4% (311,035) |
| State: | 17.6% (829,233) |
Aggregate household income in Mineville-Witherbee in 2022: $5,652,941,326
Median family income in Mineville-Witherbee in 2022:| Mineville-Witherbee: | $83,913 |
| State: | $115,170 |
Number of families with income < $10k:| Mineville-Witherbee: | 2.8% (9) |
| State: | 2.5% (68,851) |
Number of families with income $10k - 20k:| Mineville-Witherbee: | 4.0% (13) |
| New York: | 3.0% (83,127) |
Number of families with income $20k - 30k:| Mineville-Witherbee: | 7.8% (25) |
| New York: | 3.5% (97,578) |
Number of families with income $30k - 40k:| Mineville-Witherbee: | 6.5% (21) |
| New York: | 4.1% (114,108) |
Number of families with income $40k - 50k:| Mineville-Witherbee: | 10.7% (34) |
| State: | 4.7% (130,902) |
Number of families with income $50k - 60k:| Mineville-Witherbee: | 4.8% (15) |
| State: | 4.9% (135,118) |
Number of families with income $60k - 75k:| Mineville-Witherbee: | 8.7% (28) |
| State: | 7.8% (216,254) |
Number of families with income $75k - 100k:| Mineville-Witherbee: | 18.3% (58) |
| State: | 12.4% (342,382) |
Number of families with income $125k - 150k:| Mineville-Witherbee: | 5.2% (16) |
| New York: | 9.4% (260,489) |
Number of families with income > $200k:| Mineville-Witherbee: | 31.2% (99) |
| State: | 23.2% (642,319) |
Median non-family income in Mineville-Witherbee in 2022:| Mineville-Witherbee: | $26,255 |
| New York: | $54,783 |
Change in median non-family income between 2000 and 2022:| Mineville-Witherbee, New York: | +83.9% |
| State: | +87.9% |
Median per capita income in Mineville-Witherbee in 2022:| Mineville-Witherbee: | $53,616 |
| State: | $57,640 |
Change in median per capita income between 2000 and 2022:| Mineville-Witherbee, New York: | +111.0% |
| State: | +111.6% |
Income statistics for Black or African American residents
Number of households with income < $10k:| Mineville-Witherbee: | 12.0% (56,221) |
| New York: | 12.0% (128,500) |
Number of households with income $10k - 20k:| Mineville-Witherbee: | 10.0% (47,052) |
| State: | 10.0% (107,541) |
Number of households with income $20k - 30k:| Mineville-Witherbee: | 8.4% (39,461) |
| State: | 8.4% (90,192) |
Number of households with income $30k - 40k:| Mineville-Witherbee: | 7.4% (34,818) |
| State: | 7.4% (79,579) |
Number of households with income $40k - 50k:| Mineville-Witherbee: | 6.8% (31,716) |
| State: | 6.8% (72,491) |
Number of households with income $50k - 60k:| Mineville-Witherbee: | 6.7% (31,201) |
| New York: | 6.7% (71,309) |
Number of households with income $60k - 75k:| Mineville-Witherbee: | 8.9% (41,586) |
| State: | 8.9% (95,050) |
Number of households with income $75k - 100k:| Mineville-Witherbee: | 11.5% (54,066) |
| New York: | 11.5% (123,569) |
Number of households with income $100k - 125k:| Mineville-Witherbee: | 8.1% (37,905) |
| State: | 8.1% (86,632) |
Number of households with income $125k - 150k:| Mineville-Witherbee: | 6.0% (28,346) |
| State: | 6.0% (64,788) |
Number of households with income $150k - 200k:| Mineville-Witherbee: | 7.2% (33,535) |
| New York: | 7.2% (76,644) |
Number of households with income > $200k:| Mineville-Witherbee: | 7.0% (32,844) |
| State: | 7.0% (75,062) |
Median per capita income in Mineville-Witherbee in 2022:| Mineville-Witherbee: | $27,039 |
| New York: | $31,947 |
Change in median per capita income between 2000 and 2022:| Mineville-Witherbee, New York: | +99.4% |
| New York: | +106.1% |
Income statistics for Hispanic or Latino residents
Number of households with income < $10k:| Mineville-Witherbee: | 10.0% (76,793) |
| State: | 9.9% (127,185) |
Number of households with income $10k - 20k:| Mineville-Witherbee: | 10.7% (82,595) |
| State: | 10.7% (136,699) |
Number of households with income $20k - 30k:| Mineville-Witherbee: | 8.1% (62,213) |
| State: | 8.1% (102,991) |
Number of households with income $30k - 40k:| Mineville-Witherbee: | 7.8% (60,390) |
| New York: | 7.8% (100,149) |
Number of households with income $40k - 50k:| Mineville-Witherbee: | 6.9% (52,883) |
| State: | 6.9% (87,760) |
Number of households with income $50k - 60k:| Mineville-Witherbee: | 6.3% (48,870) |
| State: | 6.3% (80,968) |
Number of households with income $60k - 75k:| Mineville-Witherbee: | 8.6% (66,701) |
| State: | 8.7% (110,631) |
Number of households with income $75k - 100k:| Mineville-Witherbee: | 11.2% (86,092) |
| State: | 11.2% (142,787) |
Number of households with income $100k - 125k:| Mineville-Witherbee: | 8.2% (63,159) |
| State: | 8.2% (104,850) |
Number of households with income $125k - 150k:| Mineville-Witherbee: | 6.3% (48,402) |
| State: | 6.3% (80,274) |
Number of households with income $150k - 200k:| Mineville-Witherbee: | 7.4% (57,292) |
| State: | 7.4% (95,117) |
Number of households with income > $200k:| Mineville-Witherbee: | 8.6% (66,014) |
| State: | 8.6% (109,514) |
Median per capita income in Mineville-Witherbee in 2022:| Mineville-Witherbee: | $35,095 |
| New York: | $29,761 |
Change in median per capita income between 2000 and 2022:| Mineville-Witherbee, New York: | +127.3% |
| State: | +132.7% |
Income statistics for Multirace residents
Number of households with income < $10k:| Mineville-Witherbee: | 8.9% (27,807) |
| State: | 8.9% (57,924) |
Number of households with income $10k - 20k:| Mineville-Witherbee: | 8.7% (27,173) |
| State: | 8.7% (56,590) |
Number of households with income $20k - 30k:| Mineville-Witherbee: | 7.1% (22,227) |
| New York: | 7.1% (46,287) |
Number of households with income $30k - 40k:| Mineville-Witherbee: | 6.9% (21,675) |
| State: | 6.9% (45,132) |
Number of households with income $40k - 50k:| Mineville-Witherbee: | 5.8% (18,229) |
| State: | 5.8% (37,946) |
Number of households with income $50k - 60k:| Mineville-Witherbee: | 5.6% (17,488) |
| New York: | 5.6% (36,410) |
Number of households with income $60k - 75k:| Mineville-Witherbee: | 7.8% (24,411) |
| State: | 7.8% (50,819) |
Number of households with income $75k - 100k:| Mineville-Witherbee: | 11.7% (36,510) |
| State: | 11.7% (76,024) |
Number of households with income $100k - 125k:| Mineville-Witherbee: | 9.3% (29,128) |
| State: | 9.3% (60,635) |
Number of households with income $125k - 150k:| Mineville-Witherbee: | 6.2% (19,466) |
| New York: | 6.2% (40,533) |
Number of households with income $150k - 200k:| Mineville-Witherbee: | 8.6% (27,091) |
| New York: | 8.6% (56,409) |
Number of households with income > $200k:| Mineville-Witherbee: | 13.4% (41,987) |
| State: | 13.4% (87,442) |
Median per capita income in Mineville-Witherbee in 2022:| Mineville-Witherbee: | $35,241 |
| New York: | $36,931 |
Income statistics for other residents
Number of households with income < $10k:| Mineville-Witherbee: | 10.3% (65,720) |
| New York: | 10.3% (69,252) |
Number of households with income $10k - 20k:| Mineville-Witherbee: | 11.0% (70,197) |
| State: | 11.0% (73,890) |
Number of households with income $20k - 30k:| Mineville-Witherbee: | 8.8% (56,189) |
| New York: | 8.8% (59,096) |
Number of households with income $30k - 40k:| Mineville-Witherbee: | 8.1% (51,725) |
| New York: | 8.1% (54,418) |
Number of households with income $40k - 50k:| Mineville-Witherbee: | 7.3% (46,541) |
| State: | 7.3% (49,042) |
Number of households with income $50k - 60k:| Mineville-Witherbee: | 6.5% (41,796) |
| State: | 6.5% (43,945) |
Number of households with income $60k - 75k:| Mineville-Witherbee: | 9.5% (60,867) |
| State: | 9.5% (64,087) |
Number of households with income $75k - 100k:| Mineville-Witherbee: | 10.9% (69,344) |
| State: | 10.9% (73,094) |
Number of households with income $100k - 125k:| Mineville-Witherbee: | 7.9% (50,272) |
| State: | 7.9% (53,055) |
Number of households with income $125k - 150k:| Mineville-Witherbee: | 5.9% (37,490) |
| New York: | 5.9% (39,446) |
Number of households with income $150k - 200k:| Mineville-Witherbee: | 7.2% (46,025) |
| State: | 7.2% (48,653) |
Number of households with income > $200k:| Mineville-Witherbee: | 6.6% (42,378) |
| New York: | 6.6% (44,703) |
Median per capita income in Mineville-Witherbee in 2022:| Mineville-Witherbee: | $48,780 |
| New York: | $26,975 |
Change in median per capita income between 2000 and 2022:| Mineville-Witherbee, New York: | +132.7% |
| New York: | +144.6% |