The median household income in Millerton, PA in 2022 was $70,867, which was about the same as the median annual income of $71,798 across the entire state of Pennsylvania. Compared to the median income of $32,020 in 2000 this represents an increase of 54.8%. The per capita income in 2022 was $33,732, which means an increase of 53.9% compared to 2000 when it was $15,549.
Whole page based on the data from 2000 / 2022 when the population of Millerton, Pennsylvania was 316 / 385
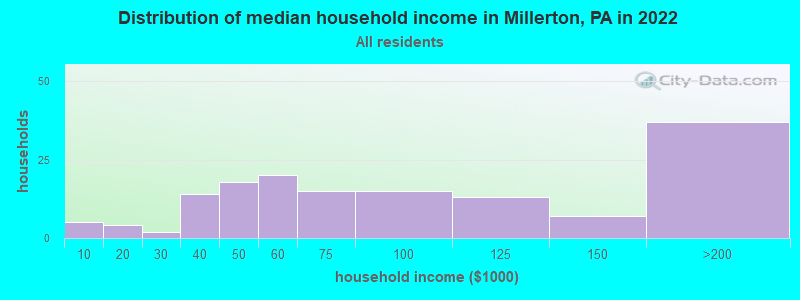
Income statistics for all residents
Median household income in Millerton, PA in 2022:
Millerton:
$70,868
State:
$71,798
Change in median household income between 2000 and 2022:
Millerton, Pennsylvania:
+121.3%
State:
+79.0%
Number of households with income < $10k:
Millerton:
3.3% (5)
Pennsylvania:
5.5% (291,562)
Number of households with income $10k - 20k:
Millerton:
2.7% (4)
Pennsylvania:
7.3% (384,726)
Number of households with income $20k - 30k:
Millerton:
1.3% (2)
State:
7.4% (389,464)
Number of households with income $30k - 40k:
Millerton:
9.3% (14)
State:
7.6% (402,138)
Number of households with income $40k - 50k:
Millerton:
12.0% (18)
Pennsylvania:
7.3% (387,945)
Number of households with income $50k - 60k:
Millerton:
13.3% (20)
Pennsylvania:
7.0% (372,468)
Number of households with income $60k - 75k:
Millerton:
10.0% (15)
State:
9.9% (524,786)
Number of households with income $75k - 100k:
Millerton:
10.0% (15)
Pennsylvania:
12.6% (666,253)
Number of households with income $100k - 125k:
Millerton:
8.7% (13)
State:
9.9% (526,402)
Number of households with income $125k - 150k:
Millerton:
4.7% (7)
State:
6.9% (362,702)
Number of households with income $150k - 200k:
Millerton:
24.7% (37)
Pennsylvania:
8.3% (440,827)
Number of households with income > $200k:
Millerton:
0.0% (0)
State:
10.3% (544,792)
Aggregate household income in Millerton in 2022: $13,394,592
Median family income in Millerton in 2022:
Millerton:
$80,267
Pennsylvania:
$93,029
Number of families with income $10k - 20k:
Millerton:
3.2% (4)
State:
3.5% (115,881)
Number of families with income $20k - 30k:
Millerton:
1.7% (2)
State:
4.8% (156,521)
Number of families with income $30k - 40k:
Millerton:
10.9% (14)
State:
5.8% (191,305)
Number of families with income $40k - 50k:
Millerton:
9.1% (11)
State:
6.4% (211,380)
Number of families with income $50k - 60k:
Millerton:
11.0% (14)
State:
6.4% (209,910)
Number of families with income $60k - 75k:
Millerton:
11.6% (15)
State:
9.7% (318,991)
Number of families with income $75k - 100k:
Millerton:
7.8% (10)
State:
14.0% (461,021)
Number of families with income $100k - 125k:
Millerton:
10.3% (13)
State:
12.2% (400,961)
Number of families with income $125k - 150k:
Millerton:
5.4% (7)
Pennsylvania:
8.8% (288,471)
Number of families with income $150k - 200k:
Millerton:
29.1% (37)
State:
11.2% (367,642)
Median non-family income in Millerton in 2022:
Millerton:
$47,613
State:
$42,203
Median per capita income in Millerton in 2022:
Millerton:
$33,732
Pennsylvania:
$41,489
Change in median per capita income between 2000 and 2022:
Millerton, Pennsylvania:
+116.9%
State:
+98.7%
Income statistics for White residents
Median household income in Millerton, PA in 2022:
Millerton:
$70,430
State:
$76,765
Change in median household income between 2000 and 2022:
Millerton, Pennsylvania:
+119.6%
Pennsylvania:
+84.3%
Number of households with income < $10k:
Millerton:
3.6% (5)
Pennsylvania:
4.3% (179,792)
Number of households with income $10k - 20k:
Millerton:
2.2% (3)
State:
6.5% (268,738)
Number of households with income $20k - 30k:
Millerton:
1.4% (2)
State:
7.0% (288,138)
Number of households with income $30k - 40k:
Millerton:
9.4% (13)
State:
7.2% (300,208)
Number of households with income $40k - 50k:
Millerton:
12.9% (18)
Pennsylvania:
7.2% (298,756)
Number of households with income $50k - 60k:
Millerton:
13.7% (19)
State:
6.8% (283,251)
Number of households with income $60k - 75k:
Millerton:
10.1% (14)
Pennsylvania:
9.9% (408,159)
Number of households with income $75k - 100k:
Millerton:
7.2% (10)
State:
13.2% (547,809)
Number of households with income $100k - 125k:
Millerton:
8.6% (12)
Pennsylvania:
10.5% (436,652)
Number of households with income $125k - 150k:
Millerton:
5.0% (7)
State:
7.3% (304,132)
Number of households with income $150k - 200k:
Millerton:
25.9% (36)
State:
9.0% (374,658)
Number of households with income > $200k:
Millerton:
0.0% (0)
State:
10.9% (452,618)
Aggregate household income in Millerton in 2022: $12,514,272
Median non-family income in Millerton in 2022:
Millerton:
$41,544
Pennsylvania:
$44,251
Change in median non-family income between 2000 and 2022:
Millerton, Pennsylvania:
+135.4%
State:
+94.2%
Median per capita income in Millerton in 2022:
Millerton:
$33,492
State:
$45,306
Change in median per capita income between 2000 and 2022:
Millerton, Pennsylvania:
+114.4%
Pennsylvania:
+105.4%
Income statistics for Asian residents
Aggregate household income in Millerton in 2022: $14,102,567
Median per capita income in Millerton in 2022:
Millerton:
$42,017
State:
$48,341
Change in median per capita income between 2000 and 2022:
Millerton, Pennsylvania:
+124.7%
State:
+140.6%
Income statistics for American Indian and Alaska Native residents
Aggregate household income in Millerton in 2022: $6,030,726
Median per capita income in Millerton in 2022:
Millerton:
$60,428
State:
$22,548
Change in median per capita income between 2000 and 2022:
Millerton, Pennsylvania:
+60.1%
State:
+45.8%
Income statistics for Multirace residents
Aggregate household income in Millerton in 2022: $33,407,358
Median per capita income in Millerton in 2022:
Millerton:
$17,453
Pennsylvania:
$27,581
Change in median per capita income between 2000 and 2022:
Millerton, Pennsylvania:
+144.8%
State:
+139.6%
Discuss Millerton, Pennsylvania (PA) on our hugely popular Pennsylvania forum.