The median household income in Marland, OK in 2022 was $24,093, which was 147.7% less than the median annual income of $59,673 across the entire state of Oklahoma. Compared to the median income of $27,188 in 2000 this represents a decrease of 12.8%. The per capita income in 2022 was $14,299, which means an increase of 37.6% compared to 2000 when it was $8,918.
Whole page based on the data from 2000 / 2022 when the population of Marland, Oklahoma was 280 / 302
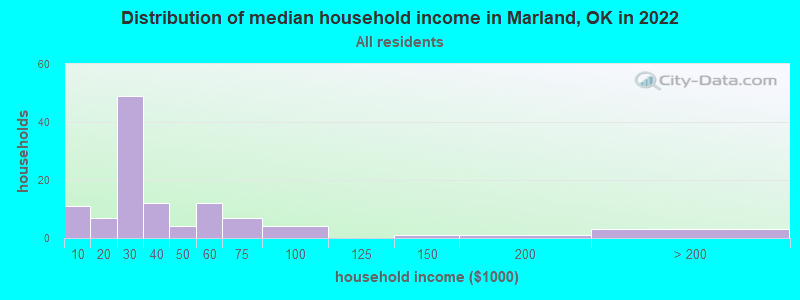
Income statistics for all residents
Median household income in Marland, OK in 2022:
Marland:
$24,093
State:
$59,673
Change in median household income between 2000 and 2022:: -11.4%
Marland, Oklahoma:
-11.4%
Oklahoma:
+78.7%
Number of households with income < $10k:
Marland:
9.9% (11)
State:
6.4% (100,950)
Number of households with income $10k - 20k:
Marland:
6.3% (7)
State:
8.8% (137,709)
Number of households with income $20k - 30k:
Marland:
44.1% (49)
Oklahoma:
9.1% (143,661)
Number of households with income $30k - 40k:
Marland:
10.8% (12)
State:
9.0% (141,098)
Number of households with income $40k - 50k:
Marland:
3.6% (4)
State:
8.9% (140,217)
Number of households with income $50k - 60k:
Marland:
10.8% (12)
Oklahoma:
8.1% (126,882)
Number of households with income $60k - 75k:
Marland:
6.3% (7)
Oklahoma:
10.0% (157,916)
Number of households with income $75k - 100k:
Marland:
3.6% (4)
State:
12.4% (195,015)
Number of households with income $100k - 125k:
Marland:
0.0% (0)
State:
9.0% (141,779)
Number of households with income $125k - 150k:
Marland:
0.9% (1)
Oklahoma:
5.8% (91,594)
Number of households with income $150k - 200k:
Marland:
0.9% (1)
Oklahoma:
6.3% (98,589)
Number of households with income > $200k:
Marland:
2.7% (3)
Oklahoma:
6.2% (97,770)
Aggregate household income in Marland in 2022: $4,380,697
Median family income in Marland in 2022:
Marland:
$24,046
Oklahoma:
$75,476
Number of families with income < $10k:
Marland:
1.5% (1)
Oklahoma:
4.2% (42,724)
Number of families with income $10k - 20k:
Marland:
2.8% (2)
State:
4.9% (49,571)
Number of families with income $20k - 30k:
Marland:
63.8% (50)
State:
6.3% (64,367)
Number of families with income $30k - 40k:
Marland:
5.5% (4)
State:
7.5% (76,467)
Number of families with income $40k - 50k:
Marland:
5.2% (4)
Oklahoma:
8.3% (84,578)
Number of families with income $50k - 60k:
Marland:
4.2% (3)
State:
7.8% (79,642)
Number of families with income $60k - 75k:
Marland:
8.0% (6)
State:
10.6% (108,169)
Number of families with income $75k - 100k:
Marland:
2.6% (2)
Oklahoma:
14.6% (148,857)
Number of families with income $125k - 150k:
Marland:
1.2% (1)
Oklahoma:
7.6% (77,253)
Number of families with income $150k - 200k:
Marland:
1.3% (1)
State:
8.4% (85,947)
Number of families with income > $200k:
Marland:
4.0% (3)
Oklahoma:
8.5% (86,531)
Median non-family income in Marland in 2022:
Marland:
$36,516
State:
$35,419
Change in median non-family income between 2000 and 2022:
Marland, Oklahoma:
+39.1%
State:
+83.2%
Median per capita income in Marland in 2022:
Marland:
$14,299
State:
$32,930
Change in median per capita income between 2000 and 2022:
Marland, Oklahoma:
+60.3%
State:
+86.6%
Income statistics for White residents
Median household income in Marland, OK in 2022:
Marland:
$33,009
Oklahoma:
$63,444
Change in median household income between 2000 and 2022:
Marland, Oklahoma:
+1.6%
State:
+79.3%
Number of households with income < $10k:
Marland:
27.3% (6)
Oklahoma:
5.5% (60,994)
Number of households with income $10k - 20k:
Marland:
4.5% (1)
State:
8.2% (91,263)
Number of households with income $20k - 30k:
Marland:
4.5% (1)
State:
8.7% (96,988)
Number of households with income $30k - 40k:
Marland:
22.7% (5)
State:
8.4% (93,121)
Number of households with income $40k - 50k:
Marland:
13.6% (3)
State:
8.6% (95,446)
Number of households with income $50k - 60k:
Marland:
0.0% (0)
State:
7.9% (87,723)
Number of households with income $60k - 75k:
Marland:
9.1% (2)
Oklahoma:
9.9% (109,955)
Number of households with income $75k - 100k:
Marland:
9.1% (2)
Oklahoma:
12.9% (143,880)
Number of households with income $100k - 125k:
Marland:
0.0% (0)
State:
9.7% (107,851)
Number of households with income $125k - 150k:
Marland:
0.0% (0)
Oklahoma:
6.3% (69,802)
Number of households with income $150k - 200k:
Marland:
4.5% (1)
Oklahoma:
6.9% (76,863)
Number of households with income > $200k:
Marland:
4.5% (1)
Oklahoma:
7.0% (78,099)
Aggregate household income in Marland in 2022: $998,525
Median family income in Marland in 2022:
Marland:
$46,337
State:
$82,251
Median per capita income in Marland in 2022:
Marland:
$1,982
Oklahoma:
$37,390
Change in median per capita income between 2000 and 2022:: -80.7%
Marland, Oklahoma:
-80.7%
State:
+92.4%
Income statistics for Hispanic or Latino residents
Median household income in Marland, OK in 2022:
Marland:
$23,834
State:
$52,856
Change in median household income between 2000 and 2022:: -56.2%
Marland, Oklahoma:
-56.2%
Oklahoma:
+89.4%
Number of households with income < $10k:
Marland:
1.7% (1)
Oklahoma:
6.0% (7,958)
Number of households with income $10k - 20k:
Marland:
0.0% (0)
State:
8.4% (11,153)
Number of households with income $20k - 30k:
Marland:
76.3% (45)
Oklahoma:
9.7% (13,003)
Number of households with income $30k - 40k:
Marland:
0.0% (0)
State:
11.7% (15,624)
Number of households with income $40k - 50k:
Marland:
0.0% (0)
State:
11.0% (14,697)
Number of households with income $50k - 60k:
Marland:
20.3% (12)
State:
9.6% (12,832)
Number of households with income $60k - 75k:
Marland:
0.0% (0)
State:
12.2% (16,321)
Number of households with income $75k - 100k:
Marland:
0.0% (0)
State:
12.5% (16,668)
Number of households with income $100k - 125k:
Marland:
0.0% (0)
State:
7.5% (9,988)
Number of households with income $125k - 150k:
Marland:
0.0% (0)
Oklahoma:
4.5% (6,042)
Number of households with income $150k - 200k:
Marland:
0.0% (0)
State:
3.8% (5,080)
Number of households with income > $200k:
Marland:
1.7% (1)
Oklahoma:
3.0% (4,063)
Aggregate household income in Marland in 2022: $2,064,715
Median family income in Marland in 2022:
Marland:
$23,571
Oklahoma:
$55,896
Number of families with income $20k - 30k:
Marland:
91.8% (39)
Oklahoma:
8.4% (8,466)
Number of families with income $50k - 60k:
Marland:
5.1% (2)
Oklahoma:
9.7% (9,746)
Number of families with income > $200k:
Marland:
3.1% (1)
Oklahoma:
3.6% (3,637)
Median per capita income in Marland in 2022:
Marland:
$23,112
Oklahoma:
$19,473
Income statistics for American Indian and Alaska Native residents
Median household income in Marland, OK in 2022:
Marland:
$38,168
State:
$53,261
Change in median household income between 2000 and 2022:
Marland, Oklahoma:
+94.9%
Oklahoma:
+94.7%
Number of households with income < $10k:
Marland:
11.8% (2)
State:
8.0% (7,959)
Number of households with income $10k - 20k:
Marland:
5.9% (1)
State:
11.2% (11,175)
Number of households with income $20k - 30k:
Marland:
0.0% (0)
State:
9.7% (9,654)
Number of households with income $30k - 40k:
Marland:
35.3% (6)
Oklahoma:
9.1% (9,092)
Number of households with income $40k - 50k:
Marland:
5.9% (1)
Oklahoma:
9.1% (9,020)
Number of households with income $50k - 60k:
Marland:
11.8% (2)
State:
8.8% (8,714)
Number of households with income $60k - 75k:
Marland:
11.8% (2)
State:
10.7% (10,616)
Number of households with income $75k - 100k:
Marland:
5.9% (1)
Oklahoma:
11.5% (11,402)
Number of households with income $100k - 125k:
Marland:
0.0% (0)
Oklahoma:
8.8% (8,769)
Number of households with income $125k - 150k:
Marland:
5.9% (1)
State:
5.0% (4,965)
Number of households with income $150k - 200k:
Marland:
0.0% (0)
State:
4.5% (4,512)
Number of households with income > $200k:
Marland:
5.9% (1)
State:
3.6% (3,569)
Aggregate household income in Marland in 2022: $1,079,180
Median family income in Marland in 2022:
Marland:
$56,618
Oklahoma:
$61,590
Median non-family income in Marland in 2022:
Marland:
$36,124
State:
$30,288
Change in median non-family income between 2000 and 2022:
Marland, Oklahoma:
+37.6%
Oklahoma:
+92.2%
Median per capita income in Marland in 2022:
Marland:
$26,707
State:
$25,549
Income statistics for Multirace residents
Number of households with income < $10k:
Marland:
5.3% (1)
State:
6.8% (11,975)
Number of households with income $10k - 20k:
Marland:
36.8% (7)
State:
8.9% (15,797)
Number of households with income $20k - 30k:
Marland:
26.3% (5)
State:
10.2% (18,071)
Number of households with income $30k - 40k:
Marland:
0.0% (0)
State:
11.0% (19,477)
Number of households with income $40k - 50k:
Marland:
0.0% (0)
State:
9.3% (16,501)
Number of households with income $50k - 60k:
Marland:
5.3% (1)
Oklahoma:
8.9% (15,635)
Number of households with income $60k - 75k:
Marland:
21.1% (4)
Oklahoma:
10.9% (19,250)
Number of households with income $75k - 100k:
Marland:
5.3% (1)
State:
11.5% (20,279)
Number of households with income $100k - 125k:
Marland:
0.0% (0)
State:
8.0% (14,067)
Number of households with income $125k - 150k:
Marland:
0.0% (0)
State:
4.9% (8,612)
Number of households with income $150k - 200k:
Marland:
0.0% (0)
State:
5.0% (8,897)
Number of households with income > $200k:
Marland:
0.0% (0)
Oklahoma:
4.5% (7,970)
Aggregate household income in Marland in 2022: $724,459
Median non-family income in Marland in 2022:
Marland:
$15,109
Oklahoma:
$34,773
Change in median non-family income between 2000 and 2022:: -74.3%
Marland, Oklahoma:
-74.3%
Oklahoma:
+103.1%
Median per capita income in Marland in 2022:
Marland:
$9,909
Oklahoma:
$23,085
Change in median per capita income between 2000 and 2022:: -44.8%
Marland, Oklahoma:
-44.8%
Oklahoma:
+93.8%
Income statistics for other residents
Median household income in Marland, OK in 2022:
Marland:
$24,272
State:
$52,612
Number of households with income < $10k:
Marland:
1.6% (1)
State:
8.1% (3,420)
Number of households with income $10k - 20k:
Marland:
0.0% (0)
Oklahoma:
8.6% (3,635)
Number of households with income $20k - 30k:
Marland:
78.7% (48)
State:
9.0% (3,808)
Number of households with income $30k - 40k:
Marland:
0.0% (0)
State:
11.4% (4,791)
Number of households with income $40k - 50k:
Marland:
0.0% (0)
Oklahoma:
10.1% (4,256)
Number of households with income $50k - 60k:
Marland:
18.0% (11)
Oklahoma:
11.7% (4,946)
Number of households with income $60k - 75k:
Marland:
0.0% (0)
State:
12.7% (5,342)
Number of households with income $75k - 100k:
Marland:
0.0% (0)
Oklahoma:
11.4% (4,792)
Number of households with income $100k - 125k:
Marland:
0.0% (0)
Oklahoma:
6.1% (2,568)
Number of households with income $125k - 150k:
Marland:
0.0% (0)
Oklahoma:
5.4% (2,298)
Number of households with income $150k - 200k:
Marland:
0.0% (0)
State:
3.4% (1,427)
Number of households with income > $200k:
Marland:
1.6% (1)
Oklahoma:
2.2% (918)
Aggregate household income in Marland in 2022: $2,036,465
Median per capita income in Marland in 2022:
Marland:
$27,800
Oklahoma:
$21,007
Change in median per capita income between 2000 and 2022:
Marland, Oklahoma:
+127.0%
State:
+119.2%
Discuss Marland, Oklahoma (OK) on our hugely popular Oklahoma forum.