The median household income in Mabton, WA in 2022 was $49,195, which was 85.6% less than the median annual income of $91,306 across the entire state of Washington. Compared to the median income of $26,650 in 2000 this represents an increase of 45.8%. The per capita income in 2022 was $16,870, which means an increase of 54.4% compared to 2000 when it was $7,694.
Whole page based on the data from 2000 / 2022 when the population of Mabton, Washington was 1,891 / 2,322
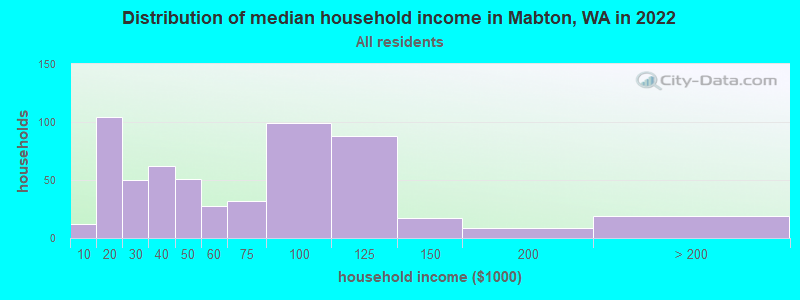
Income statistics for all residents
Median household income in Mabton, WA in 2022:
Mabton:
$49,195
Washington:
$91,306
Change in median household income between 2000 and 2022:
Mabton, Washington:
+84.6%
State:
+99.5%
Number of households with income < $10k:
Mabton:
2.1% (12)
Washington:
4.5% (139,331)
Number of households with income $10k - 20k:
Mabton:
18.2% (104)
Washington:
5.0% (154,508)
Number of households with income $20k - 30k:
Mabton:
8.8% (50)
State:
5.4% (166,555)
Number of households with income $30k - 40k:
Mabton:
10.9% (62)
State:
5.5% (170,324)
Number of households with income $40k - 50k:
Mabton:
8.9% (51)
State:
6.0% (183,941)
Number of households with income $50k - 60k:
Mabton:
4.9% (28)
Washington:
6.1% (187,395)
Number of households with income $60k - 75k:
Mabton:
5.6% (32)
Washington:
8.7% (266,771)
Number of households with income $75k - 100k:
Mabton:
17.3% (99)
State:
13.1% (404,672)
Number of households with income $100k - 125k:
Mabton:
15.4% (88)
State:
11.0% (337,911)
Number of households with income $125k - 150k:
Mabton:
3.0% (17)
State:
8.0% (244,934)
Number of households with income $150k - 200k:
Mabton:
1.6% (9)
Washington:
10.5% (323,812)
Number of households with income > $200k:
Mabton:
3.3% (19)
State:
16.2% (499,799)
Aggregate household income in Mabton in 2022: $39,229,177
Median family income in Mabton in 2022:
Mabton:
$51,136
Washington:
$109,192
Number of families with income < $10k:
Mabton:
12.1% (62)
State:
2.9% (55,953)
Number of families with income $10k - 20k:
Mabton:
16.9% (87)
State:
2.6% (50,138)
Number of families with income $20k - 30k:
Mabton:
5.2% (27)
State:
3.2% (61,974)
Number of families with income $30k - 40k:
Mabton:
6.7% (35)
State:
4.1% (80,240)
Number of families with income $40k - 50k:
Mabton:
9.7% (50)
State:
4.9% (94,310)
Number of families with income $50k - 60k:
Mabton:
3.2% (17)
Washington:
5.3% (101,674)
Number of families with income $60k - 75k:
Mabton:
6.2% (32)
State:
8.2% (158,348)
Number of families with income $75k - 100k:
Mabton:
17.2% (88)
State:
13.8% (267,812)
Number of families with income $100k - 125k:
Mabton:
16.0% (82)
State:
12.4% (240,213)
Number of families with income $125k - 150k:
Mabton:
1.2% (6)
Washington:
9.3% (180,011)
Number of families with income $150k - 200k:
Mabton:
1.9% (9)
Washington:
13.0% (250,874)
Number of families with income > $200k:
Mabton:
3.7% (19)
Washington:
20.4% (393,898)
Median non-family income in Mabton in 2022:
Mabton:
$31,886
Washington:
$57,299
Median per capita income in Mabton in 2022:
Mabton:
$16,870
State:
$50,764
Change in median per capita income between 2000 and 2022:
Mabton, Washington:
+119.3%
State:
+121.0%
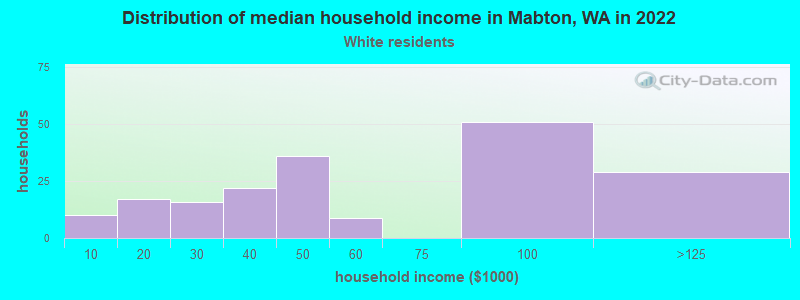
Income statistics for White residents
Median household income in Mabton, WA in 2022:
Mabton:
$50,230
State:
$91,916
Change in median household income between 2000 and 2022:
Mabton, Washington:
+105.4%
Washington:
+95.4%
Number of households with income < $10k:
Mabton:
5.3% (10)
State:
4.3% (95,850)
Number of households with income $10k - 20k:
Mabton:
8.9% (17)
State:
4.8% (106,421)
Number of households with income $20k - 30k:
Mabton:
8.4% (16)
State:
5.5% (122,860)
Number of households with income $30k - 40k:
Mabton:
11.6% (22)
Washington:
5.4% (119,627)
Number of households with income $40k - 50k:
Mabton:
18.9% (36)
Washington:
5.9% (132,276)
Number of households with income $50k - 60k:
Mabton:
4.7% (9)
State:
6.1% (136,212)
Number of households with income $60k - 75k:
Mabton:
0.0% (0)
State:
8.8% (196,086)
Number of households with income $75k - 100k:
Mabton:
26.8% (51)
State:
13.4% (299,192)
Number of households with income $100k - 125k:
Mabton:
15.3% (29)
State:
11.3% (252,209)
Number of households with income $125k - 150k:
Mabton:
0.0% (0)
Washington:
7.9% (175,962)
Number of households with income $150k - 200k:
Mabton:
0.0% (0)
Washington:
10.7% (239,156)
Number of households with income > $200k:
Mabton:
0.0% (0)
State:
16.1% (359,917)
Aggregate household income in Mabton in 2022: $12,512,298
Median family income in Mabton in 2022:
Mabton:
$51,499
Washington:
$112,511
Number of families with income < $10k:
Mabton:
9.7% (17)
State:
2.4% (33,676)
Number of families with income $10k - 20k:
Mabton:
7.6% (13)
Washington:
2.0% (28,228)
Number of families with income $20k - 30k:
Mabton:
13.3% (23)
State:
2.9% (39,288)
Number of families with income $30k - 40k:
Mabton:
7.7% (13)
Washington:
3.6% (50,190)
Number of families with income $40k - 50k:
Mabton:
18.6% (32)
Washington:
4.6% (63,009)
Number of families with income $75k - 100k:
Mabton:
27.1% (46)
Washington:
14.1% (194,214)
Number of families with income $100k - 125k:
Mabton:
16.1% (27)
State:
13.2% (182,184)
Median non-family income in Mabton in 2022:
Mabton:
$47,611
State:
$56,103
Change in median non-family income between 2000 and 2022:
Mabton, Washington:
+145.7%
State:
+87.7%
Median per capita income in Mabton in 2022:
Mabton:
$17,773
Washington:
$55,212
Change in median per capita income between 2000 and 2022:
Mabton, Washington:
+62.6%
State:
+123.8%
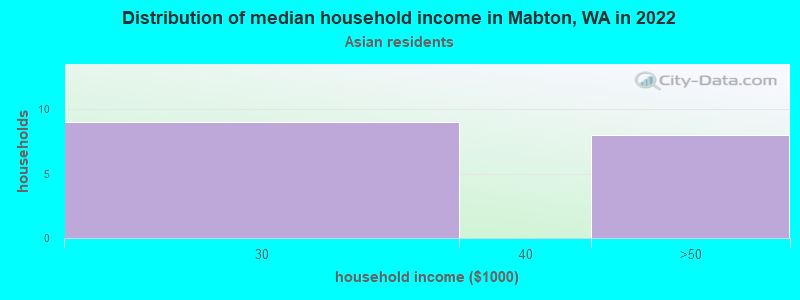
Income statistics for Asian residents
Number of households with income < $10k:
Mabton:
0.0% (0)
State:
4.9% (14,099)
Number of households with income $10k - 20k:
Mabton:
0.0% (0)
Washington:
3.5% (9,873)
Number of households with income $20k - 30k:
Mabton:
52.9% (9)
Washington:
2.9% (8,352)
Number of households with income $30k - 40k:
Mabton:
0.0% (0)
State:
4.0% (11,415)
Number of households with income $40k - 50k:
Mabton:
47.1% (8)
Washington:
4.0% (11,421)
Number of households with income $50k - 60k:
Mabton:
0.0% (0)
State:
4.2% (12,100)
Number of households with income $60k - 75k:
Mabton:
0.0% (0)
State:
6.3% (17,903)
Number of households with income $75k - 100k:
Mabton:
0.0% (0)
Washington:
10.4% (29,663)
Number of households with income $100k - 125k:
Mabton:
0.0% (0)
State:
9.4% (26,839)
Number of households with income $125k - 150k:
Mabton:
0.0% (0)
State:
8.5% (24,200)
Number of households with income $150k - 200k:
Mabton:
0.0% (0)
State:
12.6% (35,976)
Number of households with income > $200k:
Mabton:
0.0% (0)
Washington:
29.2% (83,109)
Aggregate household income in Mabton in 2022: $1,389,192
Median per capita income in Mabton in 2022:
Mabton:
$24,418
Washington:
$67,666
Change in median per capita income between 2000 and 2022:
Mabton, Washington:
+146.1%
Washington:
+236.0%
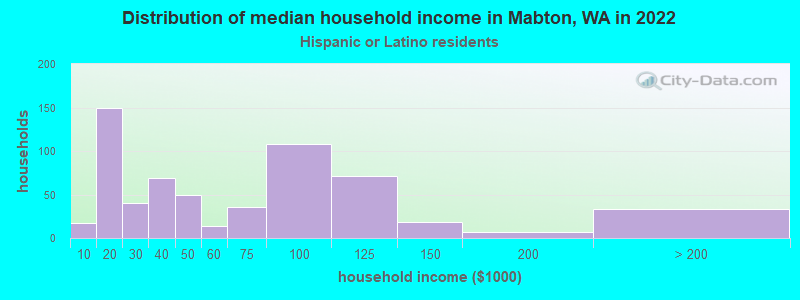
Income statistics for Hispanic or Latino residents
Median household income in Mabton, WA in 2022:
Mabton:
$49,718
Washington:
$74,770
Change in median household income between 2000 and 2022:
Mabton, Washington:
+88.1%
State:
+128.3%
Number of households with income < $10k:
Mabton:
2.8% (17)
State:
4.9% (14,456)
Number of households with income $10k - 20k:
Mabton:
24.4% (149)
Washington:
5.3% (15,449)
Number of households with income $20k - 30k:
Mabton:
6.5% (40)
Washington:
6.8% (20,016)
Number of households with income $30k - 40k:
Mabton:
11.3% (69)
State:
7.7% (22,548)
Number of households with income $40k - 50k:
Mabton:
8.0% (49)
State:
7.3% (21,450)
Number of households with income $50k - 60k:
Mabton:
2.3% (14)
State:
7.7% (22,744)
Number of households with income $60k - 75k:
Mabton:
5.9% (36)
State:
10.5% (30,737)
Number of households with income $75k - 100k:
Mabton:
17.7% (108)
State:
14.9% (43,843)
Number of households with income $100k - 125k:
Mabton:
11.6% (71)
Washington:
11.1% (32,554)
Number of households with income $125k - 150k:
Mabton:
2.9% (18)
Washington:
7.4% (21,624)
Number of households with income $150k - 200k:
Mabton:
1.1% (7)
Washington:
7.3% (21,360)
Number of households with income > $200k:
Mabton:
5.4% (33)
State:
9.2% (27,055)
Aggregate household income in Mabton in 2022: $38,887,178
Median family income in Mabton in 2022:
Mabton:
$56,308
State:
$76,866
Number of families with income < $10k:
Mabton:
11.6% (61)
State:
4.4% (9,443)
Number of families with income $10k - 20k:
Mabton:
19.4% (101)
State:
3.5% (7,524)
Number of families with income $20k - 30k:
Mabton:
4.8% (25)
State:
5.6% (12,052)
Number of families with income $30k - 40k:
Mabton:
7.9% (41)
State:
8.3% (17,803)
Number of families with income $40k - 50k:
Mabton:
8.9% (46)
Washington:
7.7% (16,361)
Number of families with income $50k - 60k:
Mabton:
2.9% (15)
State:
7.9% (16,852)
Number of families with income $60k - 75k:
Mabton:
6.0% (31)
Washington:
11.4% (24,342)
Number of families with income $75k - 100k:
Mabton:
16.0% (83)
State:
14.4% (30,698)
Number of families with income $100k - 125k:
Mabton:
12.4% (65)
State:
11.4% (24,331)
Number of families with income $125k - 150k:
Mabton:
1.6% (8)
Washington:
7.5% (16,099)
Number of families with income $150k - 200k:
Mabton:
1.9% (10)
Washington:
8.2% (17,551)
Number of families with income > $200k:
Mabton:
6.5% (34)
State:
9.7% (20,653)
Median per capita income in Mabton in 2022:
Mabton:
$16,676
State:
$28,252
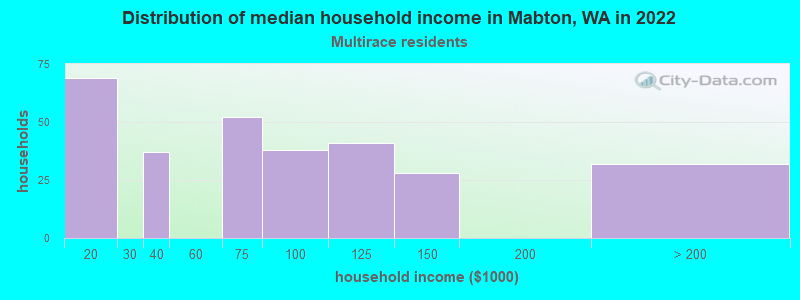
Income statistics for Multirace residents
Median household income in Mabton, WA in 2022:
Mabton:
$64,137
Washington:
$84,303
Change in median household income between 2000 and 2022:
Mabton, Washington:
+110.9%
State:
+125.7%
Number of households with income < $10k:
Mabton:
0.0% (0)
Washington:
4.3% (12,040)
Number of households with income $10k - 20k:
Mabton:
23.2% (69)
State:
6.6% (18,437)
Number of households with income $20k - 30k:
Mabton:
0.0% (0)
State:
5.2% (14,559)
Number of households with income $30k - 40k:
Mabton:
12.5% (37)
State:
6.7% (18,491)
Number of households with income $40k - 50k:
Mabton:
0.0% (0)
State:
6.3% (17,459)
Number of households with income $50k - 60k:
Mabton:
0.0% (0)
Washington:
6.9% (19,086)
Number of households with income $60k - 75k:
Mabton:
17.5% (52)
Washington:
9.1% (25,310)
Number of households with income $75k - 100k:
Mabton:
12.8% (38)
State:
13.5% (37,493)
Number of households with income $100k - 125k:
Mabton:
13.8% (41)
Washington:
10.7% (29,626)
Number of households with income $125k - 150k:
Mabton:
9.4% (28)
State:
8.6% (23,899)
Number of households with income $150k - 200k:
Mabton:
0.0% (0)
State:
10.2% (28,214)
Number of households with income > $200k:
Mabton:
10.8% (32)
State:
11.9% (32,947)
Aggregate household income in Mabton in 2022: $25,962,633
Median family income in Mabton in 2022:
Mabton:
$59,571
Washington:
$95,629
Number of families with income < $10k:
Mabton:
7.9% (25)
State:
3.5% (6,121)
Number of families with income $10k - 20k:
Mabton:
36.4% (115)
Washington:
4.3% (7,519)
Number of families with income $40k - 50k:
Mabton:
2.9% (9)
State:
5.9% (10,412)
Number of families with income $60k - 75k:
Mabton:
20.0% (63)
Washington:
9.7% (17,113)
Number of families with income $75k - 100k:
Mabton:
9.5% (30)
Washington:
13.6% (23,984)
Number of families with income $100k - 125k:
Mabton:
11.1% (35)
State:
10.4% (18,288)
Number of families with income $125k - 150k:
Mabton:
3.5% (11)
State:
10.5% (18,481)
Number of families with income > $200k:
Mabton:
8.7% (27)
State:
14.4% (25,289)
Median per capita income in Mabton in 2022:
Mabton:
$16,294
State:
$32,496
Change in median per capita income between 2000 and 2022:
Mabton, Washington:
+73.9%
State:
+156.8%
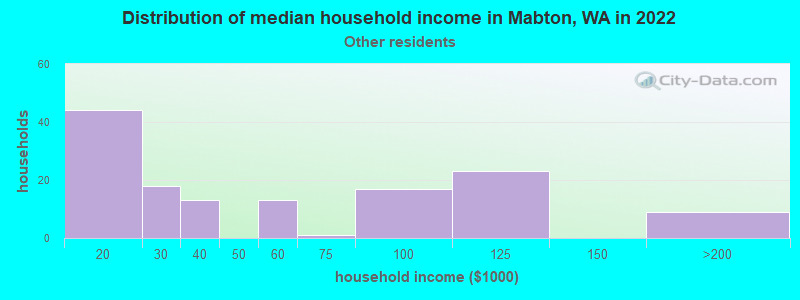
Income statistics for other residents
Median household income in Mabton, WA in 2022:
Mabton:
$44,890
Washington:
$69,545
Number of households with income < $10k:
Mabton:
0.0% (0)
State:
5.3% (6,540)
Number of households with income $10k - 20k:
Mabton:
31.9% (44)
Washington:
6.0% (7,385)
Number of households with income $20k - 30k:
Mabton:
13.0% (18)
Washington:
7.5% (9,289)
Number of households with income $30k - 40k:
Mabton:
9.4% (13)
State:
8.9% (11,015)
Number of households with income $40k - 50k:
Mabton:
0.0% (0)
State:
7.6% (9,399)
Number of households with income $50k - 60k:
Mabton:
9.4% (13)
Washington:
7.2% (8,867)
Number of households with income $60k - 75k:
Mabton:
0.7% (1)
State:
10.5% (13,032)
Number of households with income $75k - 100k:
Mabton:
12.3% (17)
Washington:
14.6% (18,007)
Number of households with income $100k - 125k:
Mabton:
16.7% (23)
State:
12.2% (15,128)
Number of households with income $125k - 150k:
Mabton:
0.0% (0)
Washington:
5.6% (6,950)
Number of households with income $150k - 200k:
Mabton:
6.5% (9)
State:
7.1% (8,749)
Number of households with income > $200k:
Mabton:
0.0% (0)
Washington:
7.5% (9,208)
Aggregate household income in Mabton in 2022: $8,679,222
Median family income in Mabton in 2022:
Mabton:
$57,601
Washington:
$72,588
Number of families with income < $10k:
Mabton:
8.6% (8)
State:
5.5% (5,287)
Number of families with income $10k - 20k:
Mabton:
8.9% (9)
State:
4.0% (3,814)
Number of families with income $20k - 30k:
Mabton:
2.9% (3)
State:
6.6% (6,293)
Number of families with income $30k - 40k:
Mabton:
16.2% (16)
State:
9.2% (8,827)
Number of families with income $50k - 60k:
Mabton:
11.1% (11)
Washington:
7.7% (7,357)
Number of families with income $75k - 100k:
Mabton:
16.9% (17)
State:
14.5% (13,800)
Number of families with income $100k - 125k:
Mabton:
25.3% (25)
State:
12.9% (12,298)
Number of families with income $150k - 200k:
Mabton:
10.2% (10)
Washington:
8.2% (7,822)
Median non-family income in Mabton in 2022:
Mabton:
$10,549
State:
$44,777
Change in median non-family income between 2000 and 2022:: -0.7%
Mabton, Washington:
-0.7%
Washington:
+84.2%
Median per capita income in Mabton in 2022:
Mabton:
$18,368
Washington:
$27,542
Discuss Mabton, Washington (WA) on our hugely popular Washington forum.