The median household income in Lyndonville, NY in 2022 was $57,735, which was 37.8% less than the median annual income of $79,557 across the entire state of New York. Compared to the median income of $40,179 in 2000 this represents an increase of 30.4%. The per capita income in 2022 was $32,196, which means an increase of 49.2% compared to 2000 when it was $16,357.
Whole page based on the data from 2000 / 2022 when the population of Lyndonville, New York was 862 / 816
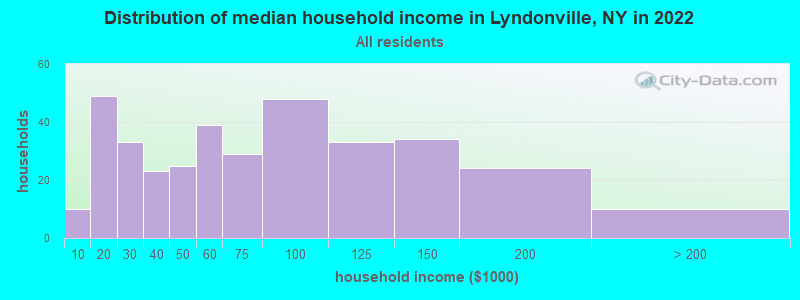
Income statistics for all residents
Median household income in Lyndonville, NY in 2022:
Lyndonville:
$57,736
State:
$79,557
Change in median household income between 2000 and 2022:
Lyndonville, New York:
+43.7%
New York:
+83.3%
Number of households with income < $10k:
Lyndonville:
2.8% (10)
State:
6.8% (527,598)
Number of households with income $10k - 20k:
Lyndonville:
13.7% (49)
State:
7.4% (574,940)
Number of households with income $20k - 30k:
Lyndonville:
9.2% (33)
State:
6.7% (517,718)
Number of households with income $30k - 40k:
Lyndonville:
6.4% (23)
New York:
6.5% (506,674)
Number of households with income $40k - 50k:
Lyndonville:
7.0% (25)
State:
6.1% (470,439)
Number of households with income $50k - 60k:
Lyndonville:
10.9% (39)
State:
5.8% (454,042)
Number of households with income $60k - 75k:
Lyndonville:
8.1% (29)
State:
8.5% (657,508)
Number of households with income $75k - 100k:
Lyndonville:
13.4% (48)
New York:
11.6% (899,824)
Number of households with income $100k - 125k:
Lyndonville:
9.2% (33)
New York:
9.3% (723,825)
Number of households with income $125k - 150k:
Lyndonville:
9.5% (34)
State:
7.1% (552,420)
Number of households with income $150k - 200k:
Lyndonville:
6.7% (24)
New York:
9.4% (727,051)
Number of households with income > $200k:
Lyndonville:
2.8% (10)
New York:
15.0% (1,162,269)
Aggregate household income in Lyndonville in 2022: $26,883,864
Median family income in Lyndonville in 2022:
Lyndonville:
$81,781
State:
$99,066
Number of families with income $10k - 20k:
Lyndonville:
6.5% (15)
State:
4.3% (205,373)
Number of families with income $20k - 30k:
Lyndonville:
2.8% (7)
State:
5.1% (241,229)
Number of families with income $30k - 40k:
Lyndonville:
6.7% (16)
State:
5.5% (259,233)
Number of families with income $40k - 50k:
Lyndonville:
8.0% (19)
New York:
5.5% (259,113)
Number of families with income $50k - 60k:
Lyndonville:
14.7% (34)
State:
5.4% (255,320)
Number of families with income $60k - 75k:
Lyndonville:
7.9% (19)
New York:
8.2% (388,624)
Number of families with income $75k - 100k:
Lyndonville:
14.4% (34)
New York:
12.3% (583,110)
Number of families with income $100k - 125k:
Lyndonville:
10.2% (24)
New York:
10.6% (500,579)
Number of families with income $125k - 150k:
Lyndonville:
21.6% (50)
State:
8.5% (400,594)
Number of families with income $150k - 200k:
Lyndonville:
3.4% (8)
State:
11.6% (551,650)
Number of families with income > $200k:
Lyndonville:
3.8% (9)
State:
18.9% (895,998)
Median non-family income in Lyndonville in 2022:
Lyndonville:
$26,532
New York:
$50,181
Change in median non-family income between 2000 and 2022:
Lyndonville, New York:
+17.9%
State:
+85.4%
Median per capita income in Lyndonville in 2022:
Lyndonville:
$32,196
New York:
$47,421
Change in median per capita income between 2000 and 2022:
Lyndonville, New York:
+96.8%
New York:
+102.7%
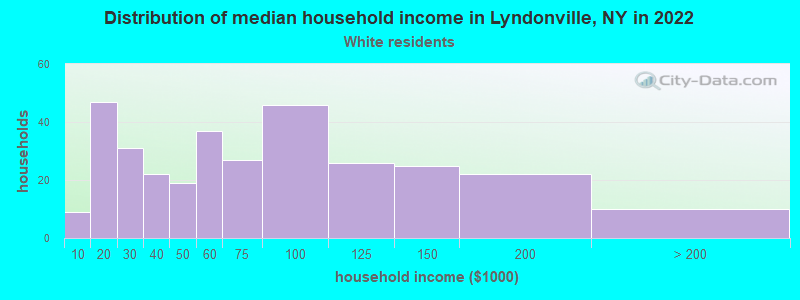
Income statistics for White residents
Median household income in Lyndonville, NY in 2022:
Lyndonville:
$54,732
State:
$89,408
Change in median household income between 2000 and 2022:
Lyndonville, New York:
+35.9%
State:
+85.5%
Number of households with income < $10k:
Lyndonville:
2.8% (9)
New York:
4.8% (225,550)
Number of households with income $10k - 20k:
Lyndonville:
14.6% (47)
New York:
6.1% (289,425)
Number of households with income $20k - 30k:
Lyndonville:
9.7% (31)
New York:
5.9% (280,254)
Number of households with income $30k - 40k:
Lyndonville:
6.9% (22)
New York:
6.1% (288,263)
Number of households with income $40k - 50k:
Lyndonville:
5.9% (19)
New York:
5.9% (278,079)
Number of households with income $50k - 60k:
Lyndonville:
11.5% (37)
State:
5.7% (267,554)
Number of households with income $60k - 75k:
Lyndonville:
8.4% (27)
State:
8.4% (398,344)
Number of households with income $75k - 100k:
Lyndonville:
14.3% (46)
State:
11.8% (554,841)
Number of households with income $100k - 125k:
Lyndonville:
8.1% (26)
New York:
10.0% (469,794)
Number of households with income $125k - 150k:
Lyndonville:
7.8% (25)
State:
7.6% (360,467)
Number of households with income $150k - 200k:
Lyndonville:
6.9% (22)
New York:
10.1% (477,078)
Number of households with income > $200k:
Lyndonville:
3.1% (10)
State:
17.6% (829,233)
Aggregate household income in Lyndonville in 2022: $23,905,013
Median family income in Lyndonville in 2022:
Lyndonville:
$78,422
State:
$115,170
Number of families with income $10k - 20k:
Lyndonville:
7.0% (14)
New York:
3.0% (83,127)
Number of families with income $20k - 30k:
Lyndonville:
2.9% (6)
State:
3.5% (97,578)
Number of families with income $30k - 40k:
Lyndonville:
6.9% (14)
State:
4.1% (114,108)
Number of families with income $40k - 50k:
Lyndonville:
6.8% (14)
State:
4.7% (130,902)
Number of families with income $50k - 60k:
Lyndonville:
16.1% (33)
New York:
4.9% (135,118)
Number of families with income $60k - 75k:
Lyndonville:
8.3% (17)
State:
7.8% (216,254)
Number of families with income $75k - 100k:
Lyndonville:
15.7% (32)
New York:
12.4% (342,382)
Number of families with income $100k - 125k:
Lyndonville:
8.4% (17)
State:
11.4% (314,917)
Number of families with income $125k - 150k:
Lyndonville:
20.1% (41)
State:
9.4% (260,489)
Number of families with income $150k - 200k:
Lyndonville:
3.7% (7)
State:
13.2% (365,586)
Number of families with income > $200k:
Lyndonville:
4.2% (9)
State:
23.2% (642,319)
Median non-family income in Lyndonville in 2022:
Lyndonville:
$26,400
New York:
$54,783
Change in median non-family income between 2000 and 2022:
Lyndonville, New York:
+19.5%
New York:
+87.9%
Median per capita income in Lyndonville in 2022:
Lyndonville:
$31,663
New York:
$57,640
Change in median per capita income between 2000 and 2022:
Lyndonville, New York:
+94.1%
State:
+111.6%
Income statistics for Black or African American residents
Aggregate household income in Lyndonville in 2022: $518,926
Median per capita income in Lyndonville in 2022:
Lyndonville:
$22,979
State:
$31,947
Change in median per capita income between 2000 and 2022:
Lyndonville, New York:
+19.6%
State:
+106.1%
Income statistics for Hispanic or Latino residents
Median per capita income in Lyndonville in 2022:
Lyndonville:
$44,385
State:
$29,761
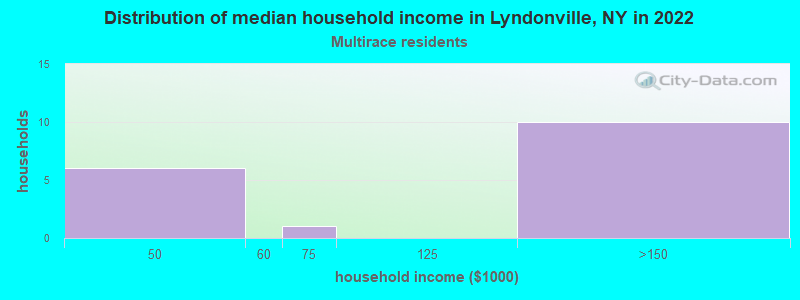
Income statistics for Multirace residents
Median household income in Lyndonville, NY in 2022:
Lyndonville:
$131,721
New York:
$73,557
Number of households with income < $10k:
Lyndonville:
0.0% (0)
State:
8.9% (57,924)
Number of households with income $10k - 20k:
Lyndonville:
0.0% (0)
New York:
8.7% (56,590)
Number of households with income $20k - 30k:
Lyndonville:
0.0% (0)
State:
7.1% (46,287)
Number of households with income $30k - 40k:
Lyndonville:
0.0% (0)
State:
6.9% (45,132)
Number of households with income $40k - 50k:
Lyndonville:
35.3% (6)
State:
5.8% (37,946)
Number of households with income $50k - 60k:
Lyndonville:
0.0% (0)
New York:
5.6% (36,410)
Number of households with income $60k - 75k:
Lyndonville:
5.9% (1)
State:
7.8% (50,819)
Number of households with income $75k - 100k:
Lyndonville:
0.0% (0)
State:
11.7% (76,024)
Number of households with income $100k - 125k:
Lyndonville:
0.0% (0)
State:
9.3% (60,635)
Number of households with income $125k - 150k:
Lyndonville:
58.8% (10)
State:
6.2% (40,533)
Number of households with income $150k - 200k:
Lyndonville:
0.0% (0)
New York:
8.6% (56,409)
Number of households with income > $200k:
Lyndonville:
0.0% (0)
State:
13.4% (87,442)
Aggregate household income in Lyndonville in 2022: $1,850,292
Median family income in Lyndonville in 2022:
Lyndonville:
$130,500
New York:
$85,788
Number of families with income $40k - 50k:
Lyndonville:
35.6% (6)
State:
6.1% (24,694)
Number of families with income $60k - 75k:
Lyndonville:
7.1% (1)
State:
7.6% (30,653)
Number of families with income $125k - 150k:
Lyndonville:
57.3% (10)
New York:
7.1% (28,583)
Median per capita income in Lyndonville in 2022:
Lyndonville:
$33,468
State:
$36,931
Change in median per capita income between 2000 and 2022:
Lyndonville, New York:
+58.4%
New York:
+158.8%
Income statistics for other residents
Median per capita income in Lyndonville in 2022:
Lyndonville:
$57,637
New York:
$26,975
Discuss Lyndonville, New York (NY) on our hugely popular New York forum.