The median household income in Lynchburg, SC in 2022 was $22,122, which was 189.8% less than the median annual income of $64,115 across the entire state of South Carolina. Compared to the median income of $19,250 in 2000 this represents an increase of 13.0%. The per capita income in 2022 was $16,802, which means an increase of 13.1% compared to 2000 when it was $14,608.
Whole page based on the data from 2000 / 2022 when the population of Lynchburg, South Carolina was 588 / 254
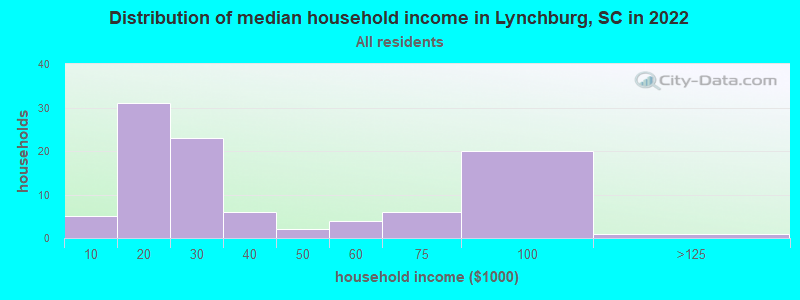
Income statistics for all residents
Median household income in Lynchburg, SC in 2022:
Lynchburg:
$22,123
South Carolina:
$64,115
Change in median household income between 2000 and 2022:
Lynchburg, South Carolina:
+14.9%
State:
+72.9%
Number of households with income < $10k:
Lynchburg:
5.1% (5)
State:
6.1% (130,922)
Number of households with income $10k - 20k:
Lynchburg:
31.6% (31)
State:
7.9% (168,918)
Number of households with income $20k - 30k:
Lynchburg:
23.5% (23)
State:
8.0% (171,564)
Number of households with income $30k - 40k:
Lynchburg:
6.1% (6)
State:
9.2% (195,662)
Number of households with income $40k - 50k:
Lynchburg:
2.0% (2)
State:
8.2% (176,179)
Number of households with income $50k - 60k:
Lynchburg:
4.1% (4)
South Carolina:
7.5% (159,159)
Number of households with income $60k - 75k:
Lynchburg:
6.1% (6)
State:
9.9% (211,862)
Number of households with income $75k - 100k:
Lynchburg:
20.4% (20)
State:
13.5% (287,601)
Number of households with income $100k - 125k:
Lynchburg:
1.0% (1)
State:
9.3% (199,068)
Number of households with income $125k - 150k:
Lynchburg:
0.0% (0)
State:
6.2% (133,330)
Number of households with income $150k - 200k:
Lynchburg:
0.0% (0)
South Carolina:
6.6% (141,363)
Number of households with income > $200k:
Lynchburg:
0.0% (0)
State:
7.5% (160,452)
Aggregate household income in Lynchburg in 2022: $3,804,836
Median non-family income in Lynchburg in 2022:
Lynchburg:
$17,406
State:
$38,426
Change in median non-family income between 2000 and 2022:
Lynchburg, South Carolina:
+115.7%
South Carolina:
+78.7%
Median per capita income in Lynchburg in 2022:
Lynchburg:
$16,802
State:
$36,675
Change in median per capita income between 2000 and 2022:
Lynchburg, South Carolina:
+15.0%
State:
+95.1%
Income statistics for White residents
Number of households with income < $10k:
Lynchburg:
7.7% (1)
South Carolina:
4.8% (68,379)
Number of households with income $10k - 20k:
Lynchburg:
30.8% (4)
State:
5.9% (85,105)
Number of households with income $20k - 30k:
Lynchburg:
15.4% (2)
South Carolina:
7.1% (101,178)
Number of households with income $30k - 40k:
Lynchburg:
15.4% (2)
State:
8.0% (114,877)
Number of households with income $40k - 50k:
Lynchburg:
0.0% (0)
South Carolina:
7.9% (112,749)
Number of households with income $50k - 60k:
Lynchburg:
0.0% (0)
State:
7.1% (101,835)
Number of households with income $60k - 75k:
Lynchburg:
15.4% (2)
South Carolina:
10.2% (145,879)
Number of households with income $75k - 100k:
Lynchburg:
15.4% (2)
State:
14.0% (200,068)
Number of households with income $100k - 125k:
Lynchburg:
0.0% (0)
State:
10.4% (148,542)
Number of households with income $125k - 150k:
Lynchburg:
0.0% (0)
South Carolina:
7.3% (105,118)
Number of households with income $150k - 200k:
Lynchburg:
0.0% (0)
State:
8.0% (114,506)
Number of households with income > $200k:
Lynchburg:
0.0% (0)
State:
9.3% (133,550)
Aggregate household income in Lynchburg in 2022: $521,885
Median family income in Lynchburg in 2022:
Lynchburg:
$82,036
South Carolina:
$90,709
Median non-family income in Lynchburg in 2022:
Lynchburg:
$17,208
South Carolina:
$42,596
Change in median non-family income between 2000 and 2022:: -9.7%
Lynchburg, South Carolina:
-9.7%
State:
+74.9%
Median per capita income in Lynchburg in 2022:
Lynchburg:
$33,493
State:
$42,728
Change in median per capita income between 2000 and 2022:
Lynchburg, South Carolina:
+24.8%
South Carolina:
+93.4%
Income statistics for Black or African American residents
Median household income in Lynchburg, SC in 2022:
Lynchburg:
$22,559
South Carolina:
$44,187
Change in median household income between 2000 and 2022:
Lynchburg, South Carolina:
+109.5%
State:
+76.5%
Number of households with income < $10k:
Lynchburg:
4.9% (4)
State:
10.0% (52,303)
Number of households with income $10k - 20k:
Lynchburg:
34.1% (28)
State:
13.4% (69,913)
Number of households with income $20k - 30k:
Lynchburg:
23.2% (19)
South Carolina:
10.4% (54,216)
Number of households with income $30k - 40k:
Lynchburg:
4.9% (4)
State:
12.0% (62,722)
Number of households with income $40k - 50k:
Lynchburg:
2.4% (2)
State:
9.2% (47,773)
Number of households with income $50k - 60k:
Lynchburg:
4.9% (4)
South Carolina:
8.3% (43,083)
Number of households with income $60k - 75k:
Lynchburg:
4.9% (4)
State:
9.3% (48,640)
Number of households with income $75k - 100k:
Lynchburg:
19.5% (16)
State:
12.2% (63,723)
Number of households with income $100k - 125k:
Lynchburg:
1.2% (1)
State:
6.4% (33,117)
Number of households with income $125k - 150k:
Lynchburg:
0.0% (0)
State:
3.2% (16,465)
Number of households with income $150k - 200k:
Lynchburg:
0.0% (0)
South Carolina:
3.2% (16,672)
Number of households with income > $200k:
Lynchburg:
0.0% (0)
South Carolina:
2.3% (12,213)
Aggregate household income in Lynchburg in 2022: $3,039,861
Median non-family income in Lynchburg in 2022:
Lynchburg:
$16,091
State:
$28,585
Change in median non-family income between 2000 and 2022:
Lynchburg, South Carolina:
+147.5%
State:
+100.5%
Median per capita income in Lynchburg in 2022:
Lynchburg:
$15,768
State:
$24,863
Change in median per capita income between 2000 and 2022:
Lynchburg, South Carolina:
+33.6%
State:
+111.1%
Discuss Lynchburg, South Carolina (SC) on our hugely popular South Carolina forum.