The median household income in Lumberton, TX in 2022 was $98,047, which was 26.3% greater than the median annual income of $72,284 across the entire state of Texas. Compared to the median income of $42,011 in 2000 this represents an increase of 57.2%. The per capita income in 2022 was $45,869, which means an increase of 57.2% compared to 2000 when it was $19,640.
Whole page based on the data from 2000 / 2022 when the population of Lumberton, Texas was 8,731 / 13,979
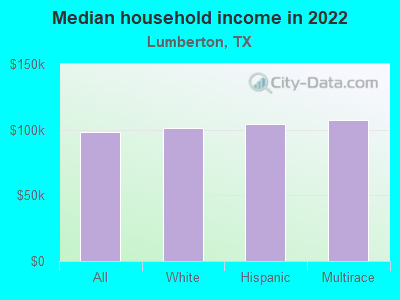
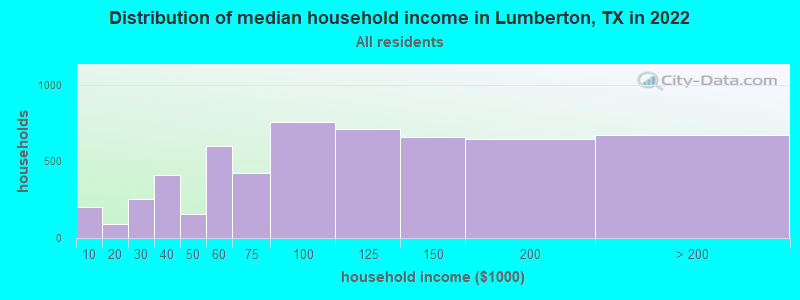
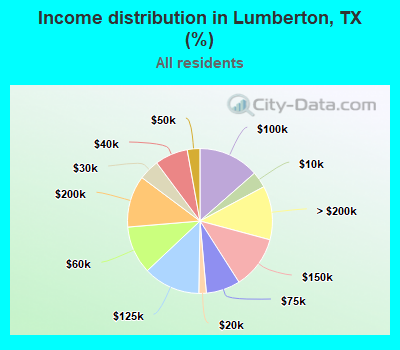
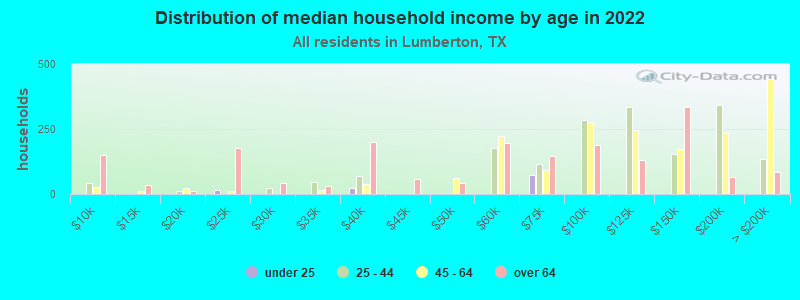
Income statistics for all residents
Median household income in Lumberton, TX in 2022:
Lumberton:
$98,047
State:
$72,284
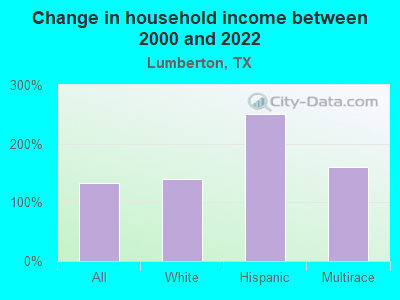
Change in median household income between 2000 and 2022:
Lumberton, Texas:
+133.4%
State:
+81.0%
Number of households with income < $10k:
Lumberton:
3.6% (203)
State:
5.5% (611,011)
Number of households with income $10k - 20k:
Lumberton:
1.7% (94)
State:
6.7% (743,157)
Number of households with income $20k - 30k:
Lumberton:
4.6% (257)
State:
7.2% (803,381)
Number of households with income $30k - 40k:
Lumberton:
7.4% (411)
State:
7.8% (866,080)
Number of households with income $40k - 50k:
Lumberton:
2.8% (158)
State:
7.3% (810,440)
Number of households with income $50k - 60k:
Lumberton:
10.7% (598)
State:
7.2% (799,783)
Number of households with income $60k - 75k:
Lumberton:
7.6% (426)
State:
9.9% (1,095,384)
Number of households with income $75k - 100k:
Lumberton:
13.5% (757)
State:
12.8% (1,419,057)
Number of households with income $100k - 125k:
Lumberton:
12.7% (710)
State:
9.5% (1,054,577)
Number of households with income $125k - 150k:
Lumberton:
11.8% (659)
State:
6.7% (741,518)
Number of households with income $150k - 200k:
Lumberton:
11.6% (646)
State:
8.7% (961,776)
Number of households with income > $200k:
Lumberton:
12.0% (672)
State:
10.7% (1,181,544)
Aggregate household income in Lumberton in 2022: $620,148,392
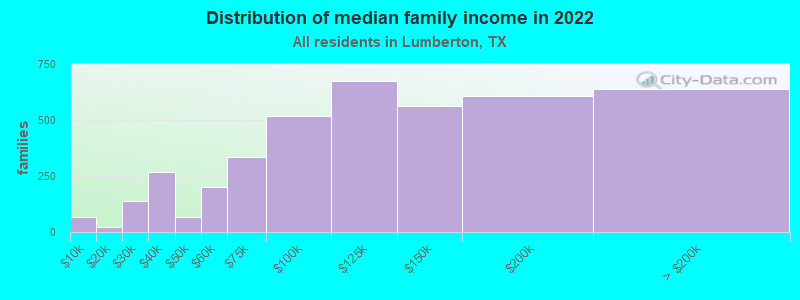
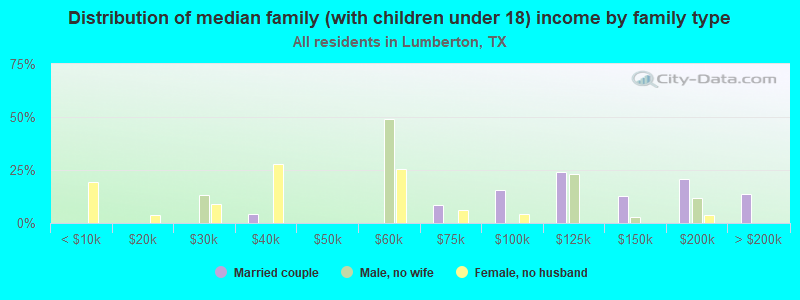
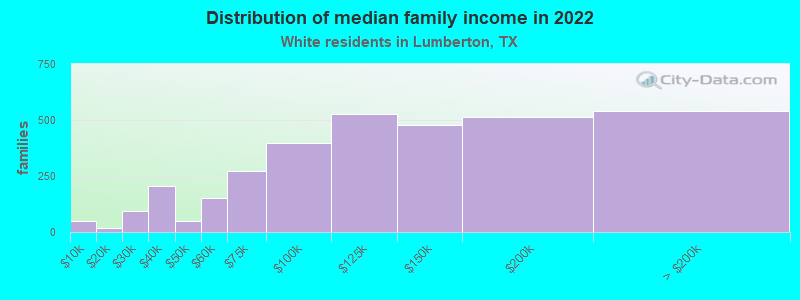
Median family income in Lumberton in 2022:
Lumberton:
$111,846
State:
$86,267
Number of families with income < $10k:
Lumberton:
1.6% (65)
Texas:
4.0% (297,884)
Number of families with income $10k - 20k:
Lumberton:
0.6% (23)
State:
4.3% (324,514)
Number of families with income $20k - 30k:
Lumberton:
3.4% (139)
State:
5.8% (430,949)
Number of families with income $30k - 40k:
Lumberton:
6.6% (269)
Texas:
6.6% (493,535)
Number of families with income $40k - 50k:
Lumberton:
1.6% (65)
State:
6.7% (499,663)
Number of families with income $50k - 60k:
Lumberton:
4.9% (200)
State:
6.6% (492,203)
Number of families with income $60k - 75k:
Lumberton:
8.2% (335)
Texas:
9.5% (710,229)
Number of families with income $75k - 100k:
Lumberton:
12.7% (519)
State:
13.6% (1,015,480)
Number of families with income $100k - 125k:
Lumberton:
16.5% (676)
State:
10.7% (797,961)
Number of families with income $125k - 150k:
Lumberton:
13.7% (562)
Texas:
8.1% (602,985)
Number of families with income $150k - 200k:
Lumberton:
14.8% (606)
State:
10.7% (804,459)
Number of families with income > $200k:
Lumberton:
15.6% (640)
Texas:
13.5% (1,013,514)
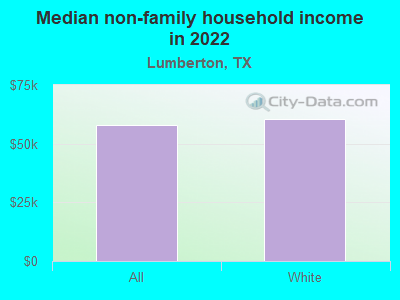
Median non-family income in Lumberton in 2022:
Lumberton:
$58,098
State:
$45,999
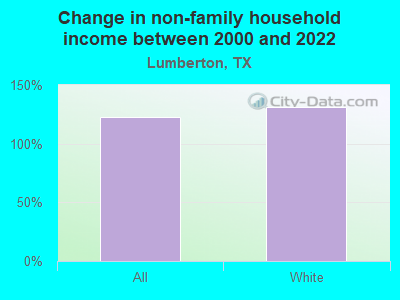
Change in median non-family income between 2000 and 2022:
Lumberton, Texas:
+122.5%
State:
+79.5%
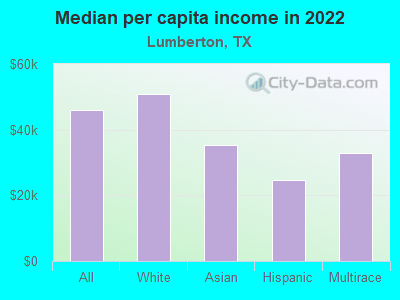
Median per capita income in Lumberton in 2022:
Lumberton:
$45,870
State:
$38,123
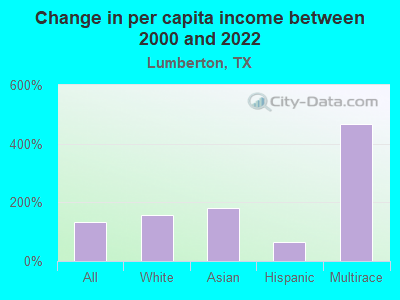
Change in median per capita income between 2000 and 2022:
Lumberton, Texas:
+133.6%
State:
+94.3%
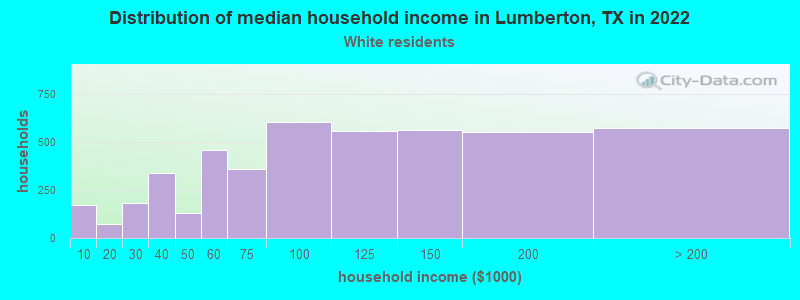
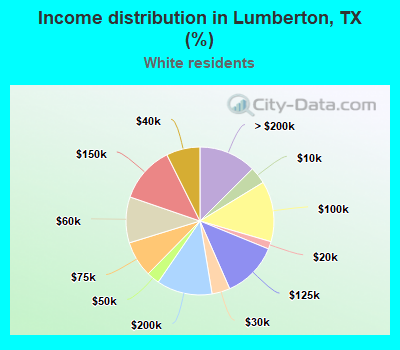
Income statistics for White residents
Median household income in Lumberton, TX in 2022:
Lumberton:
$101,141
State:
$82,032
Change in median household income between 2000 and 2022:
Lumberton, Texas:
+140.3%
Texas:
+91.0%
Number of households with income < $10k:
Lumberton:
3.7% (170)
Texas:
4.7% (273,716)
Number of households with income $10k - 20k:
Lumberton:
1.6% (75)
Texas:
5.5% (322,702)
Number of households with income $20k - 30k:
Lumberton:
4.0% (181)
State:
6.2% (363,947)
Number of households with income $30k - 40k:
Lumberton:
7.4% (336)
State:
6.8% (399,275)
Number of households with income $40k - 50k:
Lumberton:
2.8% (128)
State:
6.5% (383,417)
Number of households with income $50k - 60k:
Lumberton:
10.0% (458)
State:
6.6% (388,535)
Number of households with income $60k - 75k:
Lumberton:
7.9% (359)
State:
9.7% (566,295)
Number of households with income $75k - 100k:
Lumberton:
13.2% (604)
State:
13.0% (760,276)
Number of households with income $100k - 125k:
Lumberton:
12.3% (559)
Texas:
10.2% (597,596)
Number of households with income $125k - 150k:
Lumberton:
12.3% (563)
Texas:
7.4% (436,830)
Number of households with income $150k - 200k:
Lumberton:
12.2% (554)
State:
9.9% (583,067)
Number of households with income > $200k:
Lumberton:
12.5% (572)
Texas:
13.5% (792,647)
Aggregate household income in Lumberton in 2022: $521,990,995
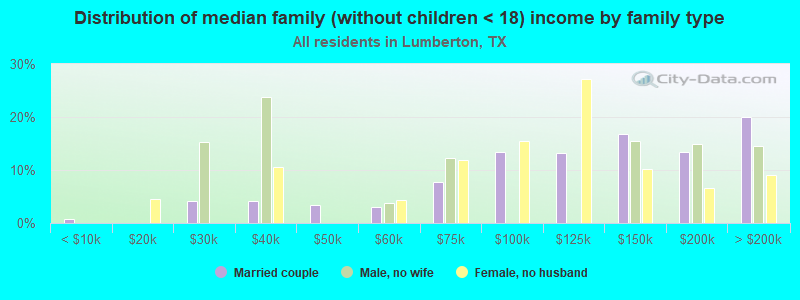
Median family income in Lumberton in 2022:
Lumberton:
$119,114
State:
$101,788
Number of families with income < $10k:
Lumberton:
1.4% (48)
State:
2.8% (108,142)
Number of families with income $10k - 20k:
Lumberton:
0.5% (16)
State:
2.9% (113,421)
Number of families with income $20k - 30k:
Lumberton:
2.9% (95)
Texas:
4.1% (157,688)
Number of families with income $30k - 40k:
Lumberton:
6.2% (205)
Texas:
5.2% (198,847)
Number of families with income $40k - 50k:
Lumberton:
1.5% (51)
State:
5.6% (216,490)
Number of families with income $50k - 60k:
Lumberton:
4.6% (153)
State:
5.7% (220,689)
Number of families with income $60k - 75k:
Lumberton:
8.2% (272)
Texas:
9.0% (346,106)
Number of families with income $75k - 100k:
Lumberton:
12.0% (396)
State:
13.7% (527,363)
Number of families with income $100k - 125k:
Lumberton:
16.0% (528)
Texas:
11.6% (448,411)
Number of families with income $125k - 150k:
Lumberton:
14.5% (479)
State:
9.2% (355,798)
Number of families with income $150k - 200k:
Lumberton:
15.6% (513)
State:
12.5% (480,185)
Number of families with income > $200k:
Lumberton:
16.4% (540)
State:
17.6% (677,490)
Median non-family income in Lumberton in 2022:
Lumberton:
$60,371
State:
$50,587
Change in median non-family income between 2000 and 2022:
Lumberton, Texas:
+131.2%
Texas:
+87.7%
Median per capita income in Lumberton in 2022:
Lumberton:
$50,927
State:
$47,740
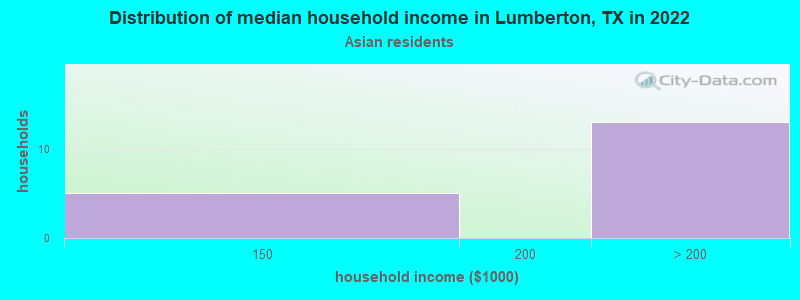
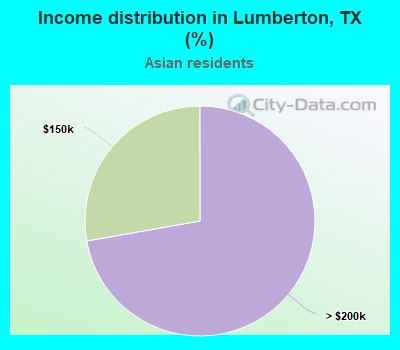
Income statistics for Asian residents
Number of households with income < $10k:
Lumberton:
0.0% (0)
State:
5.2% (29,885)
Number of households with income $10k - 20k:
Lumberton:
0.0% (0)
State:
4.7% (27,044)
Number of households with income $20k - 30k:
Lumberton:
0.0% (0)
State:
4.1% (23,363)
Number of households with income $30k - 40k:
Lumberton:
0.0% (0)
State:
4.1% (23,309)
Number of households with income $40k - 50k:
Lumberton:
0.0% (0)
State:
5.2% (29,826)
Number of households with income $50k - 60k:
Lumberton:
0.0% (0)
State:
4.7% (26,512)
Number of households with income $60k - 75k:
Lumberton:
0.0% (0)
State:
6.5% (36,905)
Number of households with income $75k - 100k:
Lumberton:
0.0% (0)
State:
11.3% (64,350)
Number of households with income $100k - 125k:
Lumberton:
0.0% (0)
Texas:
11.4% (64,714)
Number of households with income $125k - 150k:
Lumberton:
27.8% (5)
State:
9.3% (52,719)
Number of households with income $150k - 200k:
Lumberton:
0.0% (0)
Texas:
12.5% (70,953)
Number of households with income > $200k:
Lumberton:
72.2% (13)
State:
21.1% (120,260)
Aggregate household income in Lumberton in 2022: $11,388,936
Median per capita income in Lumberton in 2022:
Lumberton:
$35,363
State:
$48,626
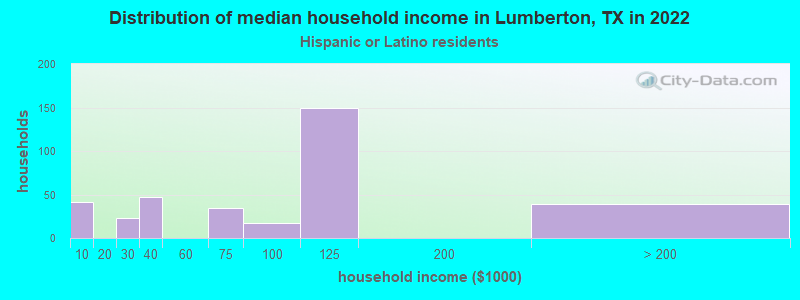
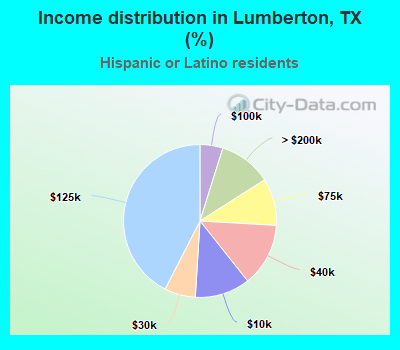
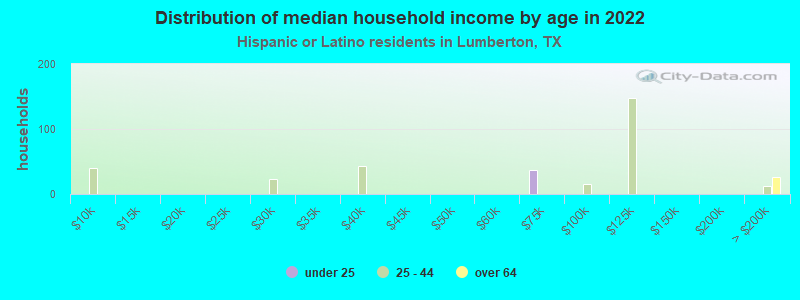
Income statistics for Hispanic or Latino residents
Median household income in Lumberton, TX in 2022:
Lumberton:
$104,693
State:
$60,504
Number of households with income < $10k:
Lumberton:
11.7% (41)
Texas:
5.8% (213,953)
Number of households with income $10k - 20k:
Lumberton:
0.0% (0)
State:
8.0% (297,456)
Number of households with income $20k - 30k:
Lumberton:
6.6% (23)
Texas:
9.2% (340,166)
Number of households with income $30k - 40k:
Lumberton:
13.4% (47)
Texas:
9.5% (354,336)
Number of households with income $40k - 50k:
Lumberton:
0.0% (0)
State:
8.8% (327,013)
Number of households with income $50k - 60k:
Lumberton:
0.0% (0)
Texas:
8.3% (308,818)
Number of households with income $60k - 75k:
Lumberton:
10.0% (35)
Texas:
10.9% (405,109)
Number of households with income $75k - 100k:
Lumberton:
4.8% (17)
State:
13.8% (511,639)
Number of households with income $100k - 125k:
Lumberton:
42.5% (149)
State:
8.6% (319,728)
Number of households with income $125k - 150k:
Lumberton:
0.0% (0)
State:
5.7% (210,932)
Number of households with income $150k - 200k:
Lumberton:
0.0% (0)
Texas:
6.4% (236,055)
Number of households with income > $200k:
Lumberton:
11.1% (39)
Texas:
5.1% (189,259)
Aggregate household income in Lumberton in 2022: $33,081,662
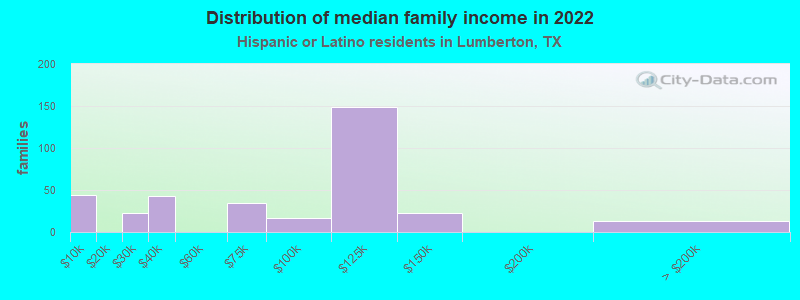
Median family income in Lumberton in 2022:
Lumberton:
$104,033
State:
$65,080
Number of families with income < $10k:
Lumberton:
12.7% (44)
State:
5.3% (147,493)
Number of families with income $20k - 30k:
Lumberton:
6.7% (23)
State:
8.6% (238,528)
Number of families with income $30k - 40k:
Lumberton:
12.5% (43)
Texas:
9.1% (251,999)
Number of families with income $60k - 75k:
Lumberton:
10.0% (35)
Texas:
10.9% (302,688)
Number of families with income $75k - 100k:
Lumberton:
4.8% (17)
State:
14.3% (398,554)
Number of families with income $100k - 125k:
Lumberton:
43.1% (149)
Texas:
9.5% (264,007)
Number of families with income $125k - 150k:
Lumberton:
6.5% (23)
State:
6.2% (171,274)
Number of families with income > $200k:
Lumberton:
3.7% (13)
Texas:
5.9% (165,129)
Median per capita income in Lumberton in 2022:
Lumberton:
$24,635
State:
$24,862
Change in median per capita income between 2000 and 2022:
Lumberton, Texas:
+66.1%
Texas:
+130.8%
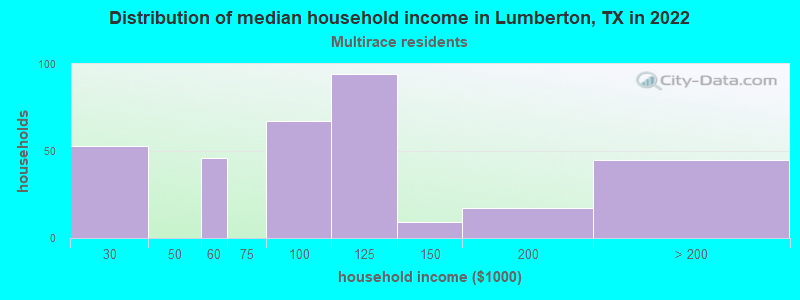
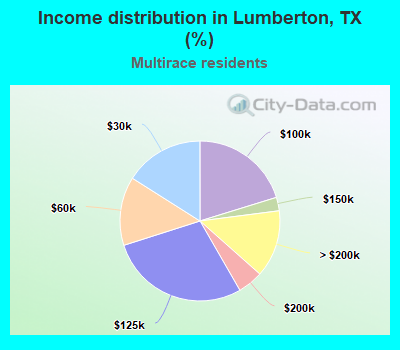
Income statistics for Multirace residents
Median household income in Lumberton, TX in 2022:
Lumberton:
$107,428
Texas:
$62,748
Number of households with income < $10k:
Lumberton:
0.0% (0)
State:
5.5% (122,324)
Number of households with income $10k - 20k:
Lumberton:
0.0% (0)
State:
8.2% (182,232)
Number of households with income $20k - 30k:
Lumberton:
16.0% (53)
State:
8.5% (189,456)
Number of households with income $30k - 40k:
Lumberton:
0.0% (0)
Texas:
8.9% (197,499)
Number of households with income $40k - 50k:
Lumberton:
0.0% (0)
State:
8.7% (191,735)
Number of households with income $50k - 60k:
Lumberton:
13.9% (46)
State:
8.0% (177,535)
Number of households with income $60k - 75k:
Lumberton:
0.0% (0)
State:
10.5% (232,479)
Number of households with income $75k - 100k:
Lumberton:
20.2% (67)
State:
13.1% (290,448)
Number of households with income $100k - 125k:
Lumberton:
28.4% (94)
State:
8.6% (191,595)
Number of households with income $125k - 150k:
Lumberton:
2.7% (9)
State:
6.0% (133,361)
Number of households with income $150k - 200k:
Lumberton:
5.1% (17)
Texas:
7.2% (159,195)
Number of households with income > $200k:
Lumberton:
13.6% (45)
State:
6.7% (148,064)
Aggregate household income in Lumberton in 2022: $35,065,549
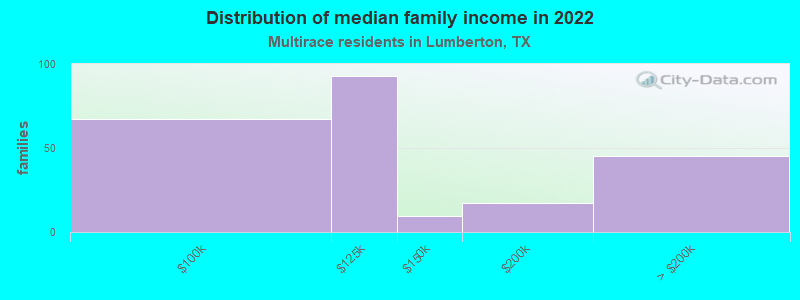
Median family income in Lumberton in 2022:
Lumberton:
$108,724
Texas:
$69,780
Number of families with income $75k - 100k:
Lumberton:
29.0% (67)
State:
14.0% (226,284)
Number of families with income $100k - 125k:
Lumberton:
40.1% (93)
State:
9.5% (153,597)
Number of families with income $125k - 150k:
Lumberton:
4.0% (9)
Texas:
6.7% (107,900)
Number of families with income $150k - 200k:
Lumberton:
7.4% (17)
Texas:
8.5% (137,607)
Number of families with income > $200k:
Lumberton:
19.5% (45)
Texas:
7.9% (127,299)
Median per capita income in Lumberton in 2022:
Lumberton:
$32,814
State:
$26,785
Discuss Lumberton, Texas (TX) on our hugely popular Texas forum.