Levering, Michigan (MI) income map, earnings map, and wages data

Data:
The per capita income in 2022 was $33,834, which means an increase of 37.7% compared to 2000 when it was $21,070.
Whole page based on the data from 2000 / 2022 when the population of Levering, Michigan was 215 / 52
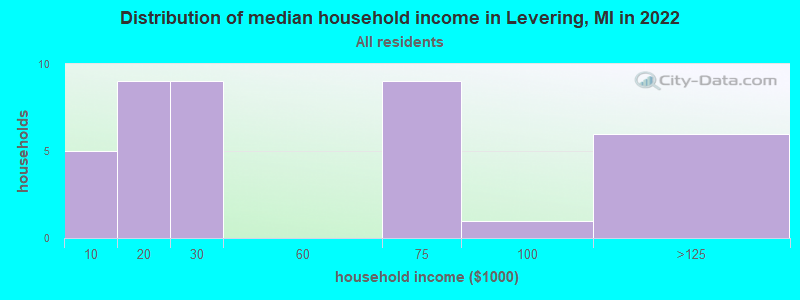
Income statistics for all residents
Number of households with income < $10k:| Levering: | 12.8% (5) |
| State: | 5.7% (231,223) |
Number of households with income $10k - 20k:| Levering: | 23.1% (9) |
| Michigan: | 7.5% (306,955) |
Number of households with income $20k - 30k:| Levering: | 23.1% (9) |
| Michigan: | 7.9% (324,153) |
Number of households with income $30k - 40k:| Levering: | 0.0% (0) |
| Michigan: | 8.3% (341,408) |
Number of households with income $40k - 50k:| Levering: | 0.0% (0) |
| Michigan: | 7.9% (322,255) |
Number of households with income $50k - 60k:| Levering: | 0.0% (0) |
| Michigan: | 7.5% (305,914) |
Number of households with income $60k - 75k:| Levering: | 23.1% (9) |
| State: | 10.1% (414,440) |
Number of households with income $75k - 100k:| Levering: | 2.6% (1) |
| State: | 13.2% (538,299) |
Number of households with income $100k - 125k:| Levering: | 15.4% (6) |
| State: | 9.7% (396,282) |
Number of households with income $125k - 150k:| Levering: | 0.0% (0) |
| Michigan: | 6.7% (273,144) |
Number of households with income $150k - 200k:| Levering: | 0.0% (0) |
| State: | 7.5% (305,077) |
Number of households with income > $200k:| Levering: | 0.0% (0) |
| State: | 8.1% (330,644) |
Aggregate household income in Levering in 2022: $1,697,285
Median per capita income in Levering in 2022:| Levering: | $33,835 |
| Michigan: | $38,151 |
Change in median per capita income between 2000 and 2022:| Levering, Michigan: | +60.6% |
| Michigan: | +72.1% |
Income statistics for White residents
Number of households with income < $10k:| Levering: | 0.0% (0) |
| State: | 4.4% (140,440) |
Number of households with income $10k - 20k:| Levering: | 27.3% (9) |
| Michigan: | 6.5% (205,547) |
Number of households with income $20k - 30k:| Levering: | 27.3% (9) |
| Michigan: | 7.6% (242,254) |
Number of households with income $30k - 40k:| Levering: | 0.0% (0) |
| State: | 8.1% (257,175) |
Number of households with income $40k - 50k:| Levering: | 0.0% (0) |
| State: | 7.8% (246,839) |
Number of households with income $50k - 60k:| Levering: | 0.0% (0) |
| State: | 7.4% (233,723) |
Number of households with income $60k - 75k:| Levering: | 24.2% (8) |
| Michigan: | 10.4% (328,664) |
Number of households with income $75k - 100k:| Levering: | 3.0% (1) |
| State: | 13.6% (431,867) |
Number of households with income $100k - 125k:| Levering: | 18.2% (6) |
| State: | 10.3% (325,164) |
Number of households with income $125k - 150k:| Levering: | 0.0% (0) |
| State: | 7.1% (226,232) |
Number of households with income $150k - 200k:| Levering: | 0.0% (0) |
| State: | 8.1% (255,445) |
Number of households with income > $200k:| Levering: | 0.0% (0) |
| State: | 8.7% (276,727) |
Aggregate household income in Levering in 2022: $1,666,964
Median per capita income in Levering in 2022:| Levering: | $36,849 |
| State: | $41,514 |
Change in median per capita income between 2000 and 2022:| Levering, Michigan: | +71.6% |
| Michigan: | +75.2% |