The median household income in Lee, FL in 2022 was $41,416, which was 67.3% less than the median annual income of $69,303 across the entire state of Florida. Compared to the median income of $26,250 in 2000 this represents an increase of 36.6%. The per capita income in 2022 was $17,266, which means an increase of 23.3% compared to 2000 when it was $13,242.
Whole page based on the data from 2000 / 2022 when the population of Lee, Florida was 352 / 800
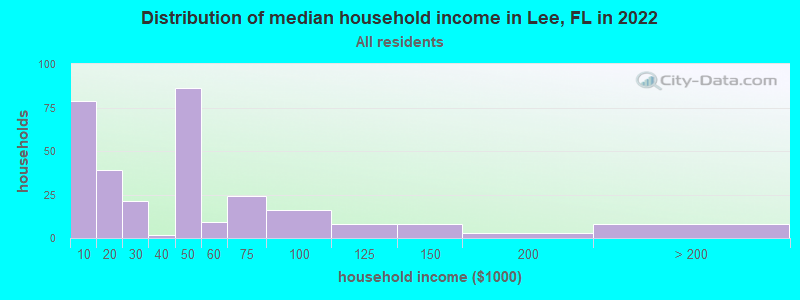
Income statistics for all residents
Median household income in Lee, FL in 2022:
Lee:
$41,416
Florida:
$69,303
Change in median household income between 2000 and 2022:
Lee, Florida:
+57.8%
Florida:
+78.5%
Number of households with income < $10k:
Lee:
26.1% (79)
State:
5.6% (495,572)
Number of households with income $10k - 20k:
Lee:
12.9% (39)
State:
6.9% (612,816)
Number of households with income $20k - 30k:
Lee:
6.9% (21)
State:
7.7% (679,608)
Number of households with income $30k - 40k:
Lee:
0.7% (2)
State:
8.0% (710,126)
Number of households with income $40k - 50k:
Lee:
28.4% (86)
State:
7.8% (687,940)
Number of households with income $50k - 60k:
Lee:
3.0% (9)
Florida:
7.6% (675,076)
Number of households with income $60k - 75k:
Lee:
7.9% (24)
State:
9.7% (858,354)
Number of households with income $75k - 100k:
Lee:
5.3% (16)
State:
13.4% (1,181,540)
Number of households with income $100k - 125k:
Lee:
2.6% (8)
Florida:
9.6% (851,620)
Number of households with income $125k - 150k:
Lee:
2.6% (8)
State:
6.4% (560,854)
Number of households with income $150k - 200k:
Lee:
1.0% (3)
Florida:
7.7% (677,227)
Number of households with income > $200k:
Lee:
2.6% (8)
Florida:
9.5% (835,661)
Aggregate household income in Lee in 2022: $13,631,858
Median non-family income in Lee in 2022:
Lee:
$42,333
Florida:
$43,665
Median per capita income in Lee in 2022:
Lee:
$17,266
State:
$40,278
Change in median per capita income between 2000 and 2022:
Lee, Florida:
+30.4%
State:
+86.8%
Income statistics for White residents
Median household income in Lee, FL in 2022:
Lee:
$46,893
Florida:
$74,559
Change in median household income between 2000 and 2022:
Lee, Florida:
+70.5%
State:
+82.7%
Number of households with income < $10k:
Lee:
3.0% (5)
State:
4.9% (270,741)
Number of households with income $10k - 20k:
Lee:
3.6% (6)
Florida:
6.1% (337,688)
Number of households with income $20k - 30k:
Lee:
10.7% (18)
State:
7.2% (395,954)
Number of households with income $30k - 40k:
Lee:
1.2% (2)
State:
7.5% (411,553)
Number of households with income $40k - 50k:
Lee:
44.6% (75)
State:
7.5% (410,613)
Number of households with income $50k - 60k:
Lee:
2.4% (4)
State:
7.6% (416,709)
Number of households with income $60k - 75k:
Lee:
12.5% (21)
State:
9.5% (523,639)
Number of households with income $75k - 100k:
Lee:
7.1% (12)
State:
13.3% (732,030)
Number of households with income $100k - 125k:
Lee:
4.2% (7)
State:
10.2% (559,463)
Number of households with income $125k - 150k:
Lee:
4.8% (8)
State:
6.9% (379,323)
Number of households with income $150k - 200k:
Lee:
1.8% (3)
Florida:
8.3% (456,076)
Number of households with income > $200k:
Lee:
4.2% (7)
Florida:
11.1% (610,258)
Aggregate household income in Lee in 2022: $11,152,311
Median family income in Lee in 2022:
Lee:
$77,184
State:
$93,222
Number of families with income $10k - 20k:
Lee:
1.3% (1)
State:
3.0% (101,720)
Number of families with income $20k - 30k:
Lee:
5.8% (4)
State:
4.5% (154,795)
Number of families with income $30k - 40k:
Lee:
2.5% (2)
State:
5.7% (194,218)
Number of families with income $40k - 50k:
Lee:
8.7% (6)
State:
6.4% (219,550)
Number of families with income $50k - 60k:
Lee:
5.3% (4)
State:
7.0% (238,045)
Number of families with income $60k - 75k:
Lee:
25.3% (17)
State:
9.6% (328,141)
Number of families with income $75k - 100k:
Lee:
18.1% (12)
State:
14.8% (503,988)
Number of families with income $100k - 125k:
Lee:
9.9% (7)
State:
12.0% (409,184)
Number of families with income $125k - 150k:
Lee:
14.2% (10)
State:
8.8% (298,895)
Number of families with income $150k - 200k:
Lee:
1.4% (1)
State:
10.6% (359,290)
Number of families with income > $200k:
Lee:
7.6% (5)
State:
14.9% (507,279)
Median non-family income in Lee in 2022:
Lee:
$42,776
State:
$46,674
Median per capita income in Lee in 2022:
Lee:
$27,222
State:
$48,094
Change in median per capita income between 2000 and 2022:
Lee, Florida:
+101.0%
Florida:
+101.1%
Income statistics for Black or African American residents
Number of households with income < $10k:
Lee:
0.0% (0)
State:
8.6% (101,054)
Number of households with income $10k - 20k:
Lee:
100.0% (18)
State:
9.3% (110,079)
Number of households with income $20k - 30k:
Lee:
0.0% (0)
State:
10.4% (122,525)
Number of households with income $30k - 40k:
Lee:
0.0% (0)
Florida:
10.6% (124,619)
Number of households with income $40k - 50k:
Lee:
0.0% (0)
Florida:
8.7% (102,300)
Number of households with income $50k - 60k:
Lee:
0.0% (0)
State:
8.1% (95,745)
Number of households with income $60k - 75k:
Lee:
0.0% (0)
Florida:
10.1% (118,757)
Number of households with income $75k - 100k:
Lee:
0.0% (0)
State:
12.3% (144,919)
Number of households with income $100k - 125k:
Lee:
0.0% (0)
State:
8.1% (95,395)
Number of households with income $125k - 150k:
Lee:
0.0% (0)
Florida:
4.5% (53,276)
Number of households with income $150k - 200k:
Lee:
0.0% (0)
Florida:
5.4% (63,827)
Number of households with income > $200k:
Lee:
0.0% (0)
State:
3.9% (45,695)
Aggregate household income in Lee in 2022: $420,623
Median per capita income in Lee in 2022:
Lee:
$16,067
Florida:
$26,700
Income statistics for Hispanic or Latino residents
Number of households with income < $10k:
Lee:
65.3% (77)
Florida:
5.9% (120,841)
Number of households with income $10k - 20k:
Lee:
23.7% (28)
State:
7.8% (158,824)
Number of households with income $20k - 30k:
Lee:
0.0% (0)
Florida:
7.8% (158,797)
Number of households with income $30k - 40k:
Lee:
0.0% (0)
State:
8.4% (171,736)
Number of households with income $40k - 50k:
Lee:
0.0% (0)
Florida:
8.5% (174,397)
Number of households with income $50k - 60k:
Lee:
4.2% (5)
Florida:
7.9% (160,816)
Number of households with income $60k - 75k:
Lee:
0.0% (0)
Florida:
10.6% (215,567)
Number of households with income $75k - 100k:
Lee:
1.7% (2)
State:
14.1% (288,590)
Number of households with income $100k - 125k:
Lee:
5.1% (6)
State:
9.4% (192,146)
Number of households with income $125k - 150k:
Lee:
0.0% (0)
Florida:
5.7% (115,883)
Number of households with income $150k - 200k:
Lee:
0.0% (0)
Florida:
6.8% (139,384)
Number of households with income > $200k:
Lee:
0.0% (0)
Florida:
7.0% (143,116)
Aggregate household income in Lee in 2022: $2,028,302
Median per capita income in Lee in 2022:
Lee:
$4,899
State:
$30,491
Change in median per capita income between 2000 and 2022:
Lee, Florida:
+34.7%
Florida:
+100.6%
Income statistics for Multirace residents
Aggregate household income in Lee in 2022: $8,920,398
Median per capita income in Lee in 2022:
Lee:
$18,672
State:
$31,893
Change in median per capita income between 2000 and 2022:
Lee, Florida:
+63.9%
Florida:
+136.0%
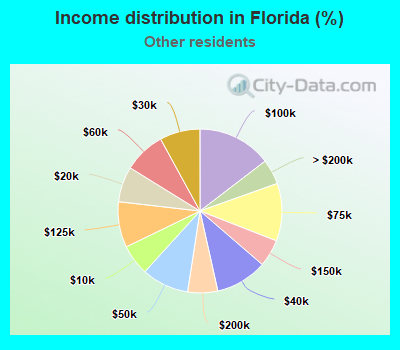
Income statistics for other residents
Number of households with income < $10k:
Lee:
85.1% (97)
State:
6.1% (28,059)
Number of households with income $10k - 20k:
Lee:
14.9% (17)
State:
7.0% (32,348)
Number of households with income $20k - 30k:
Lee:
0.0% (0)
State:
8.0% (36,819)
Number of households with income $30k - 40k:
Lee:
0.0% (0)
State:
10.2% (47,209)
Number of households with income $40k - 50k:
Lee:
0.0% (0)
State:
9.3% (43,006)
Number of households with income $50k - 60k:
Lee:
0.0% (0)
Florida:
8.2% (38,018)
Number of households with income $60k - 75k:
Lee:
0.0% (0)
State:
11.4% (52,577)
Number of households with income $75k - 100k:
Lee:
0.0% (0)
State:
14.6% (67,588)
Number of households with income $100k - 125k:
Lee:
0.0% (0)
Florida:
9.0% (41,737)
Number of households with income $125k - 150k:
Lee:
0.0% (0)
Florida:
5.4% (24,841)
Number of households with income $150k - 200k:
Lee:
0.0% (0)
State:
5.9% (27,334)
Number of households with income > $200k:
Lee:
0.0% (0)
Florida:
5.0% (22,928)
Aggregate household income in Lee in 2022: $444,436
Median per capita income in Lee in 2022:
Lee:
$3,089
State:
$27,276
Change in median per capita income between 2000 and 2022:: -84.6%
Lee, Florida:
-84.6%
Florida:
+138.6%
Discuss Lee, Florida (FL) on our hugely popular Florida forum.