Labelle, Texas (TX) income map, earnings map, and wages data
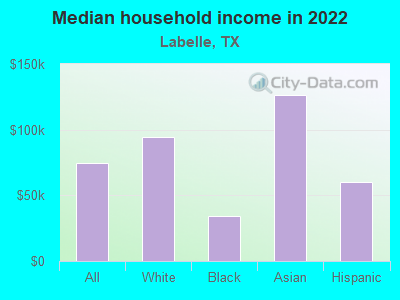
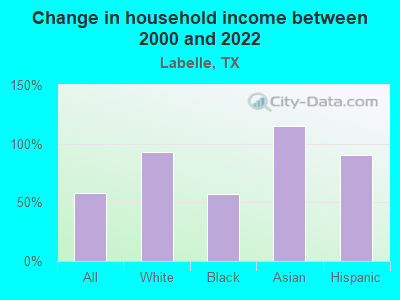
The median household income in Labelle, TX in 2022 was $74,610, which was 3.1% greater than the median annual income of $72,284 across the entire state of Texas. Compared to the median income of $47,255 in 2000 this represents an increase of 36.7%. The per capita income in 2022 was $19,747, which means an increase of 41.1% compared to 2000 when it was $11,623.
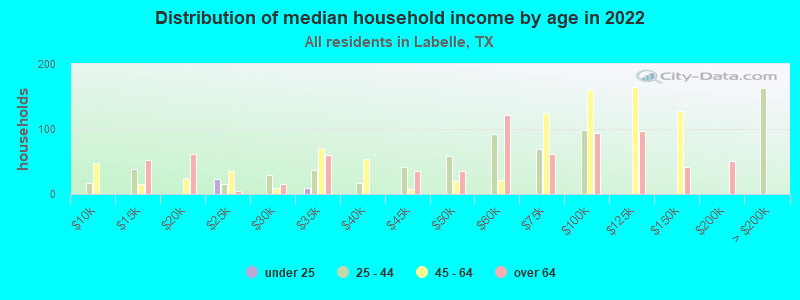
Income statistics for all residents
Median household income in Labelle, TX in 2022:| Labelle: | $74,611 |
| State: | $72,284 |
Change in median household income between 2000 and 2022:| Labelle, Texas: | +57.9% |
| Texas: | +81.0% |
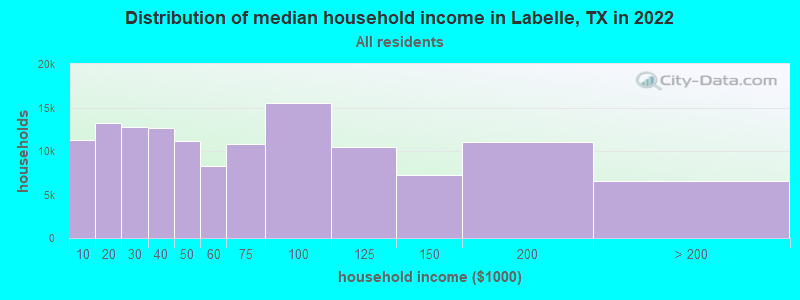
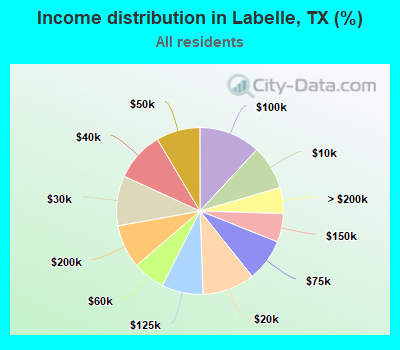
Number of households with income < $10k:| Labelle: | 8.6% (11,260) |
| State: | 5.5% (611,011) |
Number of households with income $10k - 20k:| Labelle: | 10.1% (13,251) |
| State: | 6.7% (743,157) |
Number of households with income $20k - 30k:| Labelle: | 9.7% (12,703) |
| State: | 7.2% (803,381) |
Number of households with income $30k - 40k:| Labelle: | 9.6% (12,603) |
| Texas: | 7.8% (866,080) |
Number of households with income $40k - 50k:| Labelle: | 8.5% (11,166) |
| State: | 7.3% (810,440) |
Number of households with income $50k - 60k:| Labelle: | 6.3% (8,250) |
| Texas: | 7.2% (799,783) |
Number of households with income $60k - 75k:| Labelle: | 8.2% (10,796) |
| Texas: | 9.9% (1,095,384) |
Number of households with income $75k - 100k:| Labelle: | 11.9% (15,566) |
| Texas: | 12.8% (1,419,057) |
Number of households with income $100k - 125k:| Labelle: | 8.0% (10,496) |
| State: | 9.5% (1,054,577) |
Number of households with income $125k - 150k:| Labelle: | 5.5% (7,254) |
| State: | 6.7% (741,518) |
Number of households with income $150k - 200k:| Labelle: | 8.4% (11,022) |
| Texas: | 8.7% (961,776) |
Number of households with income > $200k:| Labelle: | 5.0% (6,576) |
| State: | 10.7% (1,181,544) |
Aggregate household income in Labelle in 2022: $425,456,384
Median family income in Labelle in 2022:| Labelle: | $87,355 |
| State: | $86,267 |
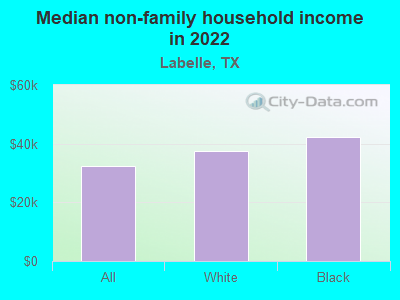
Median non-family income in Labelle in 2022:| Labelle: | $32,217 |
| Texas: | $45,999 |
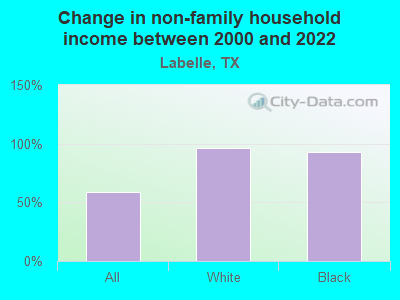
Change in median non-family income between 2000 and 2022:| Labelle, Texas: | +58.7% |
| State: | +79.5% |
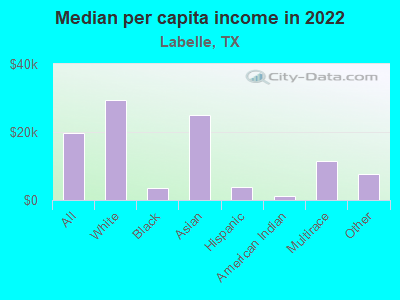
Median per capita income in Labelle in 2022:| Labelle: | $19,747 |
| State: | $38,123 |
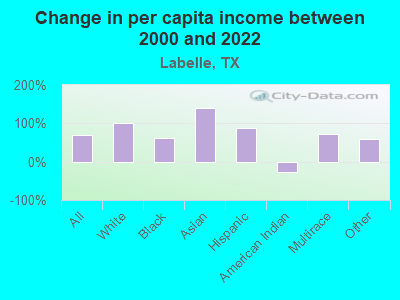
Change in median per capita income between 2000 and 2022:| Labelle, Texas: | +69.9% |
| Texas: | +94.3% |
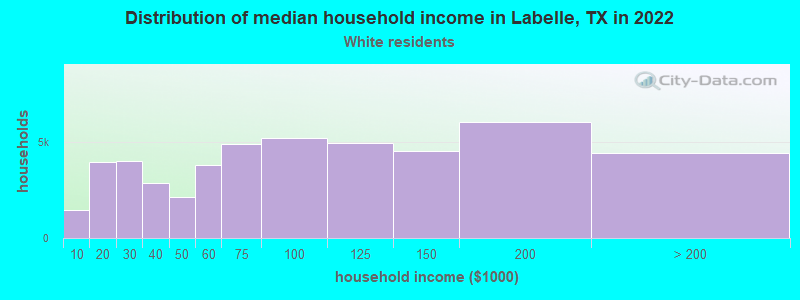
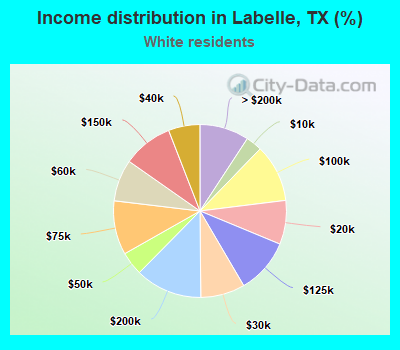
Income statistics for White residents
Median household income in Labelle, TX in 2022:| Labelle: | $94,402 |
| State: | $82,032 |
Change in median household income between 2000 and 2022:| Labelle, Texas: | +93.3% |
| Texas: | +91.0% |
Number of households with income < $10k:| Labelle: | 3.0% (1,465) |
| State: | 4.7% (273,716) |
Number of households with income $10k - 20k:| Labelle: | 8.2% (3,978) |
| State: | 5.5% (322,702) |
Number of households with income $20k - 30k:| Labelle: | 8.3% (4,018) |
| Texas: | 6.2% (363,947) |
Number of households with income $30k - 40k:| Labelle: | 5.9% (2,852) |
| State: | 6.8% (399,275) |
Number of households with income $40k - 50k:| Labelle: | 4.4% (2,130) |
| State: | 6.5% (383,417) |
Number of households with income $50k - 60k:| Labelle: | 7.8% (3,792) |
| Texas: | 6.6% (388,535) |
Number of households with income $60k - 75k:| Labelle: | 10.1% (4,894) |
| State: | 9.7% (566,295) |
Number of households with income $75k - 100k:| Labelle: | 10.8% (5,220) |
| State: | 13.0% (760,276) |
Number of households with income $100k - 125k:| Labelle: | 10.3% (4,989) |
| Texas: | 10.2% (597,596) |
Number of households with income $125k - 150k:| Labelle: | 9.4% (4,534) |
| State: | 7.4% (436,830) |
Number of households with income $150k - 200k:| Labelle: | 12.5% (6,062) |
| State: | 9.9% (583,067) |
Number of households with income > $200k:| Labelle: | 9.2% (4,463) |
| State: | 13.5% (792,647) |
Aggregate household income in Labelle in 2022: $241,335,617
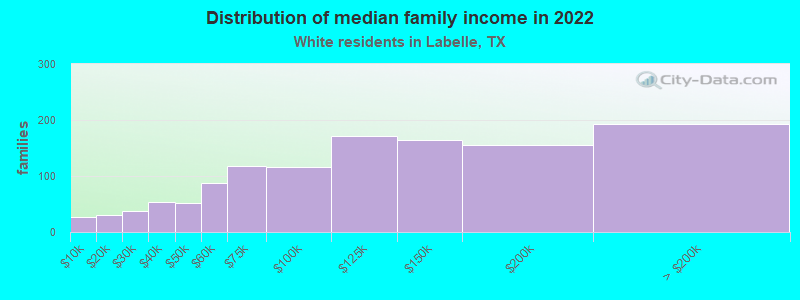
Median family income in Labelle in 2022:| Labelle: | $114,068 |
| State: | $101,788 |
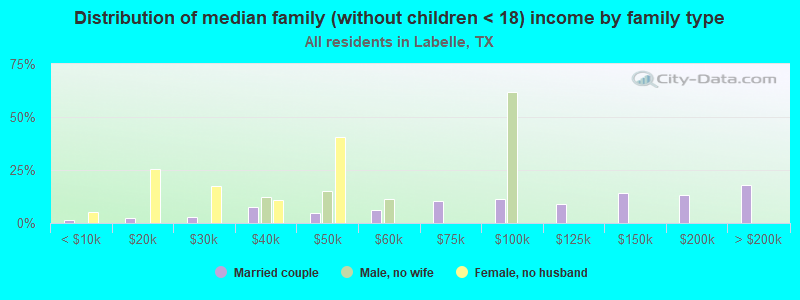
Number of families with income < $10k:| Labelle: | 2.2% (26) |
| State: | 2.8% (108,142) |
Number of families with income $10k - 20k:| Labelle: | 2.5% (30) |
| State: | 2.9% (113,421) |
Number of families with income $20k - 30k:| Labelle: | 3.2% (38) |
| State: | 4.1% (157,688) |
Number of families with income $30k - 40k:| Labelle: | 4.5% (54) |
| State: | 5.2% (198,847) |
Number of families with income $40k - 50k:| Labelle: | 4.2% (51) |
| State: | 5.6% (216,490) |
Number of families with income $50k - 60k:| Labelle: | 7.2% (87) |
| State: | 5.7% (220,689) |
Number of families with income $60k - 75k:| Labelle: | 9.8% (118) |
| Texas: | 9.0% (346,106) |
Number of families with income $75k - 100k:| Labelle: | 9.7% (116) |
| Texas: | 13.7% (527,363) |
Number of families with income $100k - 125k:| Labelle: | 14.2% (171) |
| State: | 11.6% (448,411) |
Number of families with income $125k - 150k:| Labelle: | 13.7% (165) |
| State: | 9.2% (355,798) |
Number of families with income $150k - 200k:| Labelle: | 12.9% (156) |
| State: | 12.5% (480,185) |
Number of families with income > $200k:| Labelle: | 15.9% (192) |
| Texas: | 17.6% (677,490) |
Median non-family income in Labelle in 2022:| Labelle: | $37,590 |
| State: | $50,587 |
Change in median non-family income between 2000 and 2022:| Labelle, Texas: | +96.5% |
| State: | +87.7% |
Median per capita income in Labelle in 2022:| Labelle: | $29,322 |
| Texas: | $47,740 |
Change in median per capita income between 2000 and 2022:| Labelle, Texas: | +100.6% |
| State: | +114.3% |
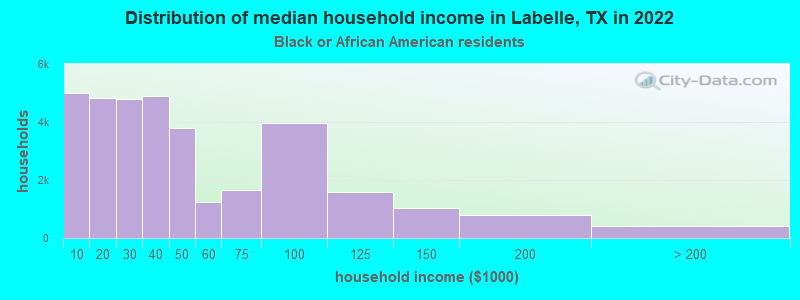
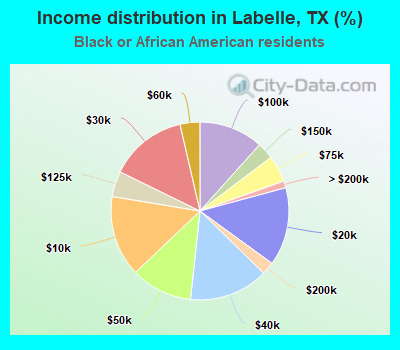
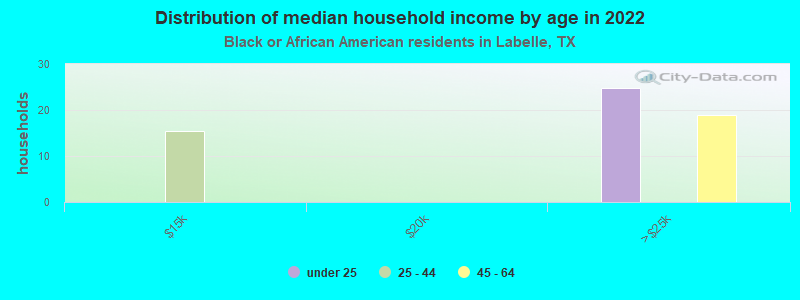
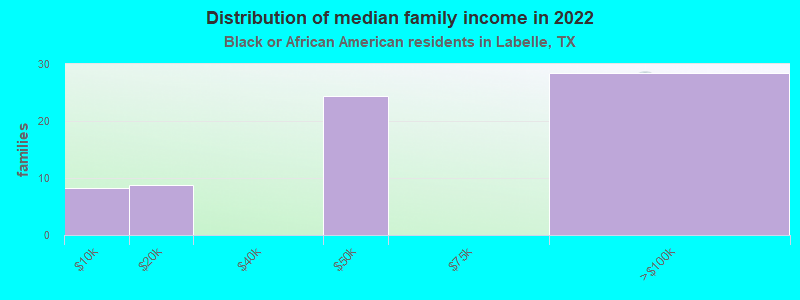
Income statistics for Black or African American residents
Median household income in Labelle, TX in 2022:| Labelle: | $34,392 |
| State: | $55,759 |
Change in median household income between 2000 and 2022:| Labelle, Texas: | +57.2% |
| State: | +90.3% |
Number of households with income < $10k:| Labelle: | 14.7% (5,007) |
| Texas: | 8.9% (126,378) |
Number of households with income $10k - 20k:| Labelle: | 14.2% (4,834) |
| State: | 9.9% (140,369) |
Number of households with income $20k - 30k:| Labelle: | 14.1% (4,803) |
| Texas: | 8.5% (120,639) |
Number of households with income $30k - 40k:| Labelle: | 14.4% (4,892) |
| State: | 9.7% (137,517) |
Number of households with income $40k - 50k:| Labelle: | 11.2% (3,802) |
| Texas: | 8.0% (112,973) |
Number of households with income $50k - 60k:| Labelle: | 3.6% (1,226) |
| State: | 8.3% (117,156) |
Number of households with income $60k - 75k:| Labelle: | 4.8% (1,649) |
| State: | 10.4% (147,462) |
Number of households with income $75k - 100k:| Labelle: | 11.7% (3,967) |
| Texas: | 11.5% (162,718) |
Number of households with income $100k - 125k:| Labelle: | 4.6% (1,580) |
| Texas: | 8.2% (115,829) |
Number of households with income $125k - 150k:| Labelle: | 3.0% (1,034) |
| State: | 4.9% (69,556) |
Number of households with income $150k - 200k:| Labelle: | 2.3% (786) |
| State: | 6.4% (90,701) |
Number of households with income > $200k:| Labelle: | 1.2% (423) |
| Texas: | 5.5% (77,988) |
Aggregate household income in Labelle in 2022: $3,761,486
Median family income in Labelle in 2022:| Labelle: | $19,455 |
| State: | $69,134 |
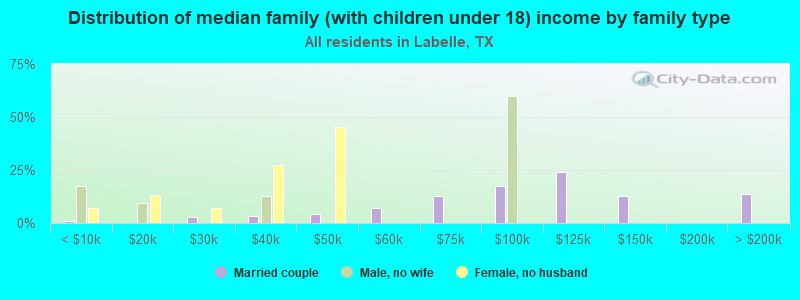
Number of families with income < $10k:| Labelle: | 11.7% (8) |
| State: | 6.8% (55,625) |
Number of families with income $10k - 20k:| Labelle: | 12.6% (9) |
| Texas: | 6.8% (55,300) |
Number of families with income $40k - 50k:| Labelle: | 34.9% (24) |
| State: | 7.1% (57,907) |
Number of families with income $75k - 100k:| Labelle: | 40.8% (28) |
| State: | 12.7% (103,723) |
Median non-family income in Labelle in 2022:| Labelle: | $42,431 |
| State: | $40,133 |
Change in median non-family income between 2000 and 2022:| Labelle, Texas: | +93.1% |
| Texas: | +102.2% |
Median per capita income in Labelle in 2022:| Labelle: | $3,568 |
| Texas: | $30,490 |
Change in median per capita income between 2000 and 2022:| Labelle, Texas: | +62.5% |
| Texas: | +113.9% |
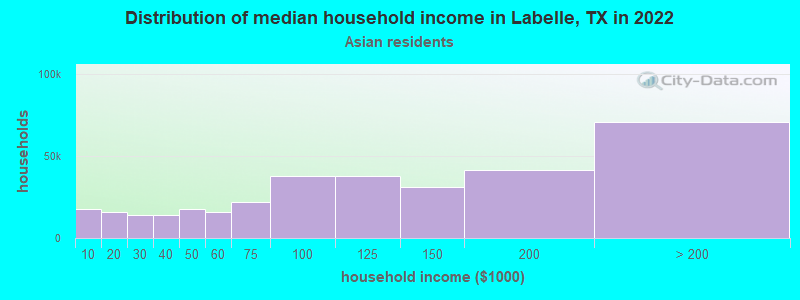
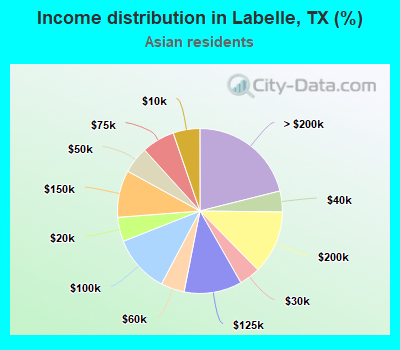
Income statistics for Asian residents
Median household income in Labelle, TX in 2022:| Labelle: | $126,450 |
| Texas: | $107,673 |
Change in median household income between 2000 and 2022:| Labelle, Texas: | +115.2% |
| State: | +115.1% |
Number of households with income < $10k:| Labelle: | 5.3% (17,563) |
| Texas: | 5.2% (29,885) |
Number of households with income $10k - 20k:| Labelle: | 4.8% (15,892) |
| State: | 4.7% (27,044) |
Number of households with income $20k - 30k:| Labelle: | 4.1% (13,696) |
| Texas: | 4.1% (23,363) |
Number of households with income $30k - 40k:| Labelle: | 4.1% (13,692) |
| State: | 4.1% (23,309) |
Number of households with income $40k - 50k:| Labelle: | 5.2% (17,504) |
| State: | 5.2% (29,826) |
Number of households with income $50k - 60k:| Labelle: | 4.6% (15,527) |
| Texas: | 4.7% (26,512) |
Number of households with income $60k - 75k:| Labelle: | 6.5% (21,685) |
| State: | 6.5% (36,905) |
Number of households with income $75k - 100k:| Labelle: | 11.3% (37,709) |
| State: | 11.3% (64,350) |
Number of households with income $100k - 125k:| Labelle: | 11.3% (37,950) |
| State: | 11.4% (64,714) |
Number of households with income $125k - 150k:| Labelle: | 9.3% (30,938) |
| State: | 9.3% (52,719) |
Number of households with income $150k - 200k:| Labelle: | 12.5% (41,646) |
| State: | 12.5% (70,953) |
Number of households with income > $200k:| Labelle: | 21.1% (70,582) |
| State: | 21.1% (120,260) |
Aggregate household income in Labelle in 2022: $1,505,490
Median family income in Labelle in 2022:| Labelle: | $120,130 |
| State: | $123,328 |
Number of families with income $50k - 60k:| Labelle: | 100.0% (19) |
| State: | 4.7% (20,568) |
Median per capita income in Labelle in 2022:| Labelle: | $25,093 |
| State: | $48,626 |
Change in median per capita income between 2000 and 2022:| Labelle, Texas: | +139.2% |
| State: | +132.0% |
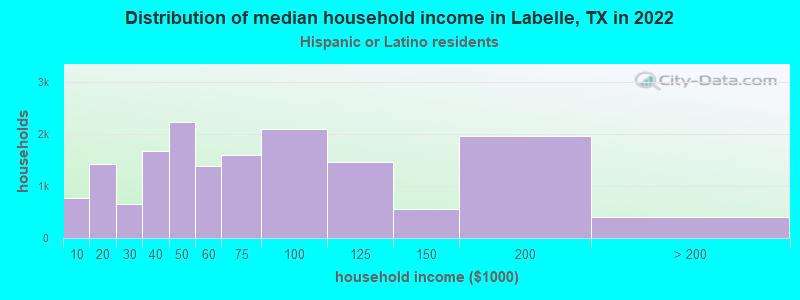
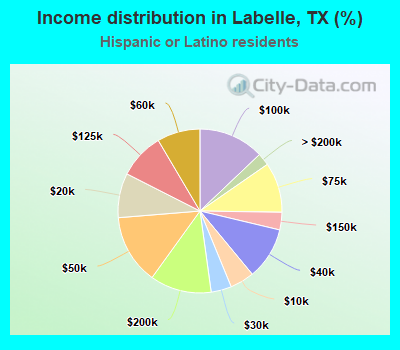
Income statistics for Hispanic or Latino residents
Median household income in Labelle, TX in 2022:| Labelle: | $60,216 |
| Texas: | $60,504 |
Change in median household income between 2000 and 2022:| Labelle, Texas: | +89.7% |
| State: | +102.5% |
Number of households with income < $10k:| Labelle: | 4.8% (776) |
| State: | 5.8% (213,953) |
Number of households with income $10k - 20k:| Labelle: | 8.8% (1,425) |
| State: | 8.0% (297,456) |
Number of households with income $20k - 30k:| Labelle: | 4.0% (654) |
| State: | 9.2% (340,166) |
Number of households with income $30k - 40k:| Labelle: | 10.3% (1,666) |
| Texas: | 9.5% (354,336) |
Number of households with income $40k - 50k:| Labelle: | 13.8% (2,230) |
| Texas: | 8.8% (327,013) |
Number of households with income $50k - 60k:| Labelle: | 8.5% (1,376) |
| State: | 8.3% (308,818) |
Number of households with income $60k - 75k:| Labelle: | 9.9% (1,603) |
| Texas: | 10.9% (405,109) |
Number of households with income $75k - 100k:| Labelle: | 12.9% (2,094) |
| Texas: | 13.8% (511,639) |
Number of households with income $100k - 125k:| Labelle: | 9.0% (1,463) |
| Texas: | 8.6% (319,728) |
Number of households with income $125k - 150k:| Labelle: | 3.5% (564) |
| State: | 5.7% (210,932) |
Number of households with income $150k - 200k:| Labelle: | 12.1% (1,967) |
| Texas: | 6.4% (236,055) |
Number of households with income > $200k:| Labelle: | 2.5% (398) |
| State: | 5.1% (189,259) |
Aggregate household income in Labelle in 2022: $10,188,280
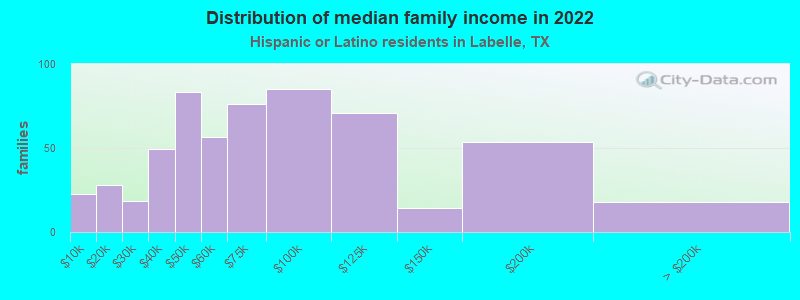
Median family income in Labelle in 2022:| Labelle: | $54,487 |
| State: | $65,080 |
Number of families with income < $10k:| Labelle: | 3.9% (22) |
| State: | 5.3% (147,493) |
Number of families with income $10k - 20k:| Labelle: | 4.9% (28) |
| State: | 6.3% (174,531) |
Number of families with income $20k - 30k:| Labelle: | 3.2% (19) |
| Texas: | 8.6% (238,528) |
Number of families with income $30k - 40k:| Labelle: | 8.5% (49) |
| State: | 9.1% (251,999) |
Number of families with income $40k - 50k:| Labelle: | 14.5% (84) |
| Texas: | 8.6% (240,188) |
Number of families with income $50k - 60k:| Labelle: | 9.8% (56) |
| State: | 8.0% (223,566) |
Number of families with income $60k - 75k:| Labelle: | 13.2% (76) |
| Texas: | 10.9% (302,688) |
Number of families with income $75k - 100k:| Labelle: | 14.8% (85) |
| State: | 14.3% (398,554) |
Number of families with income $100k - 125k:| Labelle: | 12.3% (71) |
| State: | 9.5% (264,007) |
Number of families with income $125k - 150k:| Labelle: | 2.5% (14) |
| State: | 6.2% (171,274) |
Number of families with income $150k - 200k:| Labelle: | 9.3% (54) |
| State: | 7.3% (202,259) |
Number of families with income > $200k:| Labelle: | 3.1% (18) |
| State: | 5.9% (165,129) |
Median per capita income in Labelle in 2022:| Labelle: | $3,933 |
| State: | $24,862 |
Change in median per capita income between 2000 and 2022:| Labelle, Texas: | +87.6% |
| Texas: | +130.8% |
Income statistics for American Indian and Alaska Native residents
Number of households with income < $10k:| Labelle: | 4.1% (195) |
| Texas: | 4.1% (3,398) |
Number of households with income $10k - 20k:| Labelle: | 8.3% (399) |
| State: | 8.3% (6,949) |
Number of households with income $20k - 30k:| Labelle: | 9.2% (444) |
| State: | 9.3% (7,742) |
Number of households with income $30k - 40k:| Labelle: | 9.2% (441) |
| Texas: | 9.1% (7,627) |
Number of households with income $40k - 50k:| Labelle: | 7.0% (338) |
| State: | 7.1% (5,922) |
Number of households with income $50k - 60k:| Labelle: | 8.1% (388) |
| State: | 8.1% (6,761) |
Number of households with income $60k - 75k:| Labelle: | 12.7% (609) |
| Texas: | 12.7% (10,588) |
Number of households with income $75k - 100k:| Labelle: | 13.0% (625) |
| Texas: | 13.0% (10,903) |
Number of households with income $100k - 125k:| Labelle: | 9.9% (474) |
| Texas: | 9.9% (8,256) |
Number of households with income $125k - 150k:| Labelle: | 5.2% (251) |
| Texas: | 5.2% (4,355) |
Number of households with income $150k - 200k:| Labelle: | 6.8% (325) |
| State: | 6.7% (5,623) |
Number of households with income > $200k:| Labelle: | 6.6% (319) |
| State: | 6.6% (5,522) |
Median per capita income in Labelle in 2022:| Labelle: | $1,320 |
| Texas: | $28,166 |
Income statistics for Multirace residents
Number of households with income < $10k:| Labelle: | 10.9% (690) |
| State: | 5.5% (122,324) |
Number of households with income $10k - 20k:| Labelle: | 7.1% (452) |
| Texas: | 8.2% (182,232) |
Number of households with income $20k - 30k:| Labelle: | 4.2% (265) |
| State: | 8.5% (189,456) |
Number of households with income $30k - 40k:| Labelle: | 6.9% (437) |
| Texas: | 8.9% (197,499) |
Number of households with income $40k - 50k:| Labelle: | 15.1% (952) |
| State: | 8.7% (191,735) |
Number of households with income $50k - 60k:| Labelle: | 8.8% (559) |
| Texas: | 8.0% (177,535) |
Number of households with income $60k - 75k:| Labelle: | 11.1% (700) |
| State: | 10.5% (232,479) |
Number of households with income $75k - 100k:| Labelle: | 15.3% (968) |
| State: | 13.1% (290,448) |
Number of households with income $100k - 125k:| Labelle: | 7.9% (502) |
| Texas: | 8.6% (191,595) |
Number of households with income $125k - 150k:| Labelle: | 2.2% (136) |
| Texas: | 6.0% (133,361) |
Number of households with income $150k - 200k:| Labelle: | 8.9% (565) |
| State: | 7.2% (159,195) |
Number of households with income > $200k:| Labelle: | 1.5% (96) |
| Texas: | 6.7% (148,064) |
Median per capita income in Labelle in 2022:| Labelle: | $11,363 |
| Texas: | $26,785 |
Change in median per capita income between 2000 and 2022:| Labelle, Texas: | +72.6% |
| State: | +110.9% |
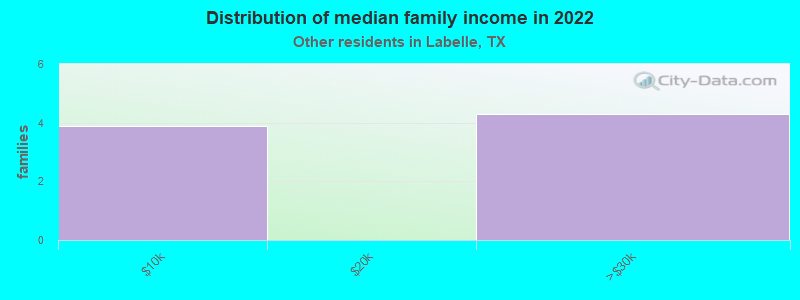
Income statistics for other residents
Number of households with income < $10k:| Labelle: | 5.3% (4) |
| Texas: | 5.9% (54,162) |
Number of households with income $10k - 20k:| Labelle: | 8.0% (6) |
| State: | 6.8% (62,891) |
Number of households with income $20k - 30k:| Labelle: | 10.7% (8) |
| State: | 10.6% (97,294) |
Number of households with income $30k - 40k:| Labelle: | 10.7% (8) |
| Texas: | 10.8% (99,670) |
Number of households with income $40k - 50k:| Labelle: | 9.3% (7) |
| Texas: | 9.3% (85,548) |
Number of households with income $50k - 60k:| Labelle: | 9.3% (7) |
| Texas: | 9.0% (82,757) |
Number of households with income $60k - 75k:| Labelle: | 10.7% (8) |
| State: | 10.9% (100,326) |
Number of households with income $75k - 100k:| Labelle: | 13.3% (10) |
| State: | 14.0% (128,767) |
Number of households with income $100k - 125k:| Labelle: | 8.0% (6) |
| Texas: | 8.2% (75,218) |
Number of households with income $125k - 150k:| Labelle: | 5.3% (4) |
| Texas: | 4.8% (44,223) |
Number of households with income $150k - 200k:| Labelle: | 5.3% (4) |
| Texas: | 5.6% (51,376) |
Number of households with income > $200k:| Labelle: | 4.0% (3) |
| State: | 4.0% (36,393) |
Aggregate household income in Labelle in 2022: $968,616
Median family income in Labelle in 2022:| Labelle: | $42,222 |
| State: | $60,064 |
Median per capita income in Labelle in 2022:| Labelle: | $7,740 |
| State: | $23,899 |
Change in median per capita income between 2000 and 2022:| Labelle, Texas: | +59.1% |
| Texas: | +135.2% |