The median household income in Joppa, IL in 2022 was $38,596, which was 98.7% less than the median annual income of $76,708 across the entire state of Illinois. Compared to the median income of $17,813 in 2000 this represents an increase of 53.8%. The per capita income in 2022 was $18,739, which means an increase of 52.6% compared to 2000 when it was $8,890.
Whole page based on the data from 2000 / 2022 when the population of Joppa, Illinois was 409 / 328
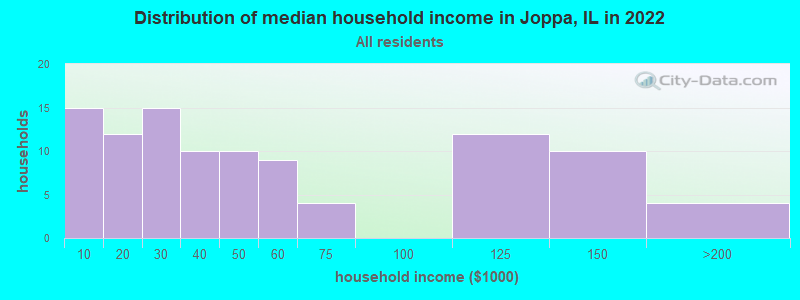
Income statistics for all residents
Median household income in Joppa, IL in 2022:
Joppa:
$38,596
Illinois:
$76,708
Change in median household income between 2000 and 2022:
Joppa, Illinois:
+116.7%
State:
+64.6%
Number of households with income < $10k:
Joppa:
14.9% (15)
State:
5.9% (296,090)
Number of households with income $10k - 20k:
Joppa:
11.9% (12)
State:
6.6% (333,259)
Number of households with income $20k - 30k:
Joppa:
14.9% (15)
Illinois:
6.8% (342,921)
Number of households with income $30k - 40k:
Joppa:
9.9% (10)
Illinois:
7.0% (355,254)
Number of households with income $40k - 50k:
Joppa:
9.9% (10)
State:
6.7% (340,678)
Number of households with income $50k - 60k:
Joppa:
8.9% (9)
State:
6.7% (339,405)
Number of households with income $60k - 75k:
Joppa:
4.0% (4)
State:
9.2% (465,709)
Number of households with income $75k - 100k:
Joppa:
0.0% (0)
State:
12.9% (651,353)
Number of households with income $100k - 125k:
Joppa:
11.9% (12)
State:
10.3% (522,359)
Number of households with income $125k - 150k:
Joppa:
9.9% (10)
State:
7.3% (367,136)
Number of households with income $150k - 200k:
Joppa:
4.0% (4)
State:
9.0% (455,249)
Number of households with income > $200k:
Joppa:
0.0% (0)
Illinois:
11.6% (586,947)
Aggregate household income in Joppa in 2022: $5,540,065
Median non-family income in Joppa in 2022:
Joppa:
$18,693
State:
$46,533
Change in median non-family income between 2000 and 2022:
Joppa, Illinois:
+76.9%
Illinois:
+64.0%
Median per capita income in Joppa in 2022:
Joppa:
$18,739
State:
$43,317
Change in median per capita income between 2000 and 2022:
Joppa, Illinois:
+110.8%
State:
+87.5%
Income statistics for White residents
Median household income in Joppa, IL in 2022:
Joppa:
$38,145
State:
$83,346
Change in median household income between 2000 and 2022:
Joppa, Illinois:
+105.1%
State:
+67.5%
Number of households with income < $10k:
Joppa:
14.9% (14)
Illinois:
4.5% (149,895)
Number of households with income $10k - 20k:
Joppa:
12.8% (12)
State:
5.5% (184,529)
Number of households with income $20k - 30k:
Joppa:
14.9% (14)
State:
6.1% (205,767)
Number of households with income $30k - 40k:
Joppa:
10.6% (10)
Illinois:
6.7% (225,572)
Number of households with income $40k - 50k:
Joppa:
8.5% (8)
State:
6.5% (216,965)
Number of households with income $50k - 60k:
Joppa:
9.6% (9)
Illinois:
6.6% (222,841)
Number of households with income $60k - 75k:
Joppa:
4.3% (4)
Illinois:
9.3% (312,758)
Number of households with income $75k - 100k:
Joppa:
0.0% (0)
State:
12.9% (433,180)
Number of households with income $100k - 125k:
Joppa:
12.8% (12)
State:
10.7% (360,753)
Number of households with income $125k - 150k:
Joppa:
9.6% (9)
State:
7.9% (266,532)
Number of households with income $150k - 200k:
Joppa:
2.1% (2)
State:
10.0% (337,357)
Number of households with income > $200k:
Joppa:
0.0% (0)
State:
13.3% (446,069)
Aggregate household income in Joppa in 2022: $4,877,811
Median non-family income in Joppa in 2022:
Joppa:
$19,006
Illinois:
$50,934
Change in median non-family income between 2000 and 2022:
Joppa, Illinois:
+68.9%
State:
+70.7%
Median per capita income in Joppa in 2022:
Joppa:
$18,599
State:
$50,738
Change in median per capita income between 2000 and 2022:
Joppa, Illinois:
+118.1%
Illinois:
+95.5%
Income statistics for Black or African American residents
Aggregate household income in Joppa in 2022: $962,814
Median per capita income in Joppa in 2022:
Joppa:
$41,484
State:
$28,045
Income statistics for Multirace residents
Median per capita income in Joppa in 2022:
Joppa:
$8,323
Illinois:
$29,285
Discuss Joppa, Illinois (IL) on our hugely popular Illinois forum.