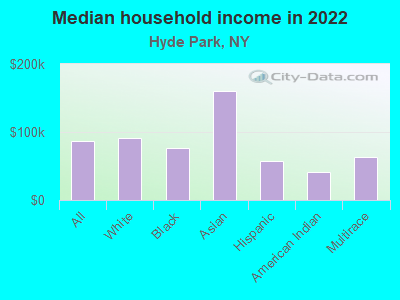
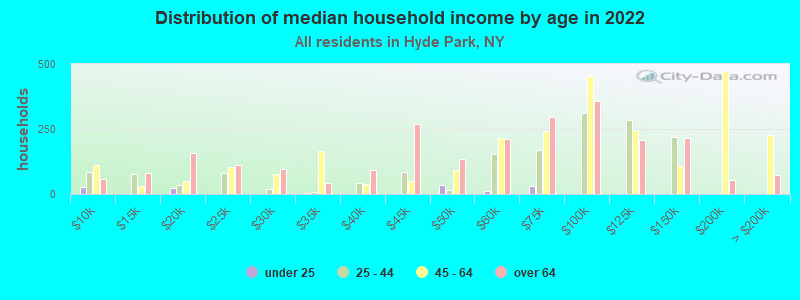
The median household income in Hyde Park, NY in 2022 was $87,094, which was 8.7% greater than the median annual income of $79,557 across the entire state of New York. Compared to the median income of $50,870 in 2000 this represents an increase of 41.6%. The per capita income in 2022 was $43,956, which means an increase of 51.6% compared to 2000 when it was $21,260.
Income statistics for all residents
Median household income in Hyde Park, NY in 2022:
Hyde Park:
$87,095
State:
$79,557
Change in median household income between 2000 and 2022:
Hyde Park, New York:
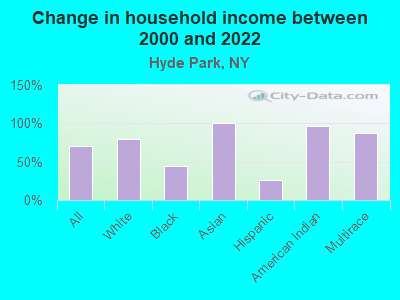
+71.2%
State:
+83.3%
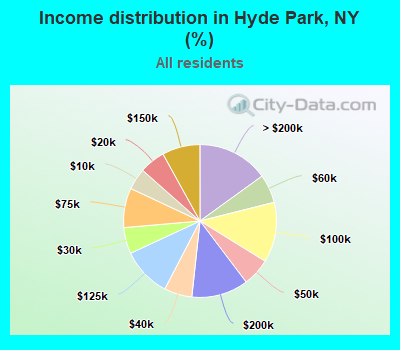
Number of households with income < $10k:
Hyde Park:
4.5% (5,097)
State:
6.8% (527,598)
Number of households with income $10k - 20k:
Hyde Park:
5.4% (6,105)
New York:
7.4% (574,940)
Number of households with income $20k - 30k:
Hyde Park:
5.5% (6,214)
State:
6.7% (517,718)
Number of households with income $30k - 40k:
Hyde Park:
5.9% (6,612)
State:
6.5% (506,674)
Number of households with income $40k - 50k:
Hyde Park:
5.9% (6,601)
State:
6.1% (470,439)
Number of households with income $50k - 60k:
Hyde Park:
6.0% (6,783)
State:
5.8% (454,042)
Number of households with income $60k - 75k:
Hyde Park:
8.4% (9,378)
State:
8.5% (657,508)
Number of households with income $75k - 100k:
Hyde Park:
12.7% (14,273)
State:
11.6% (899,824)
Number of households with income $100k - 125k:
Hyde Park:
10.5% (11,742)
New York:
9.3% (723,825)
Number of households with income $125k - 150k:
Hyde Park:
8.0% (8,994)
New York:
7.1% (552,420)
Number of households with income $150k - 200k:
Hyde Park:
12.0% (13,476)
New York:
9.4% (727,051)
Number of households with income > $200k:
Hyde Park:
15.0% (16,867)
State:
15.0% (1,162,269)
Aggregate household income in Hyde Park in 2022: $2,910,249,961
Median family income in Hyde Park in 2022:
Hyde Park:
$105,794
State:
$99,066
Median non-family income in Hyde Park in 2022:
Hyde Park:
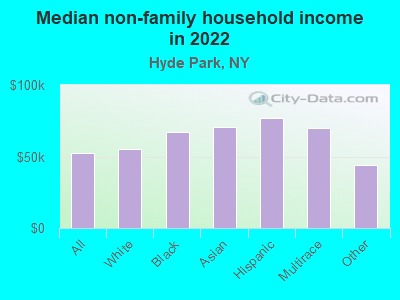
$52,758
State:
$50,181
Change in median non-family income between 2000 and 2022:
Hyde Park, New York:
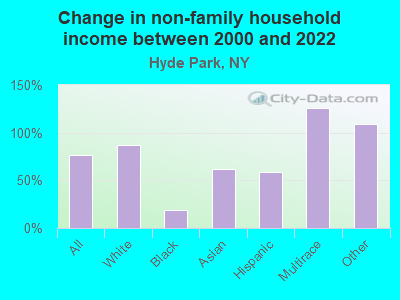
+77.3%
New York:
+85.4%
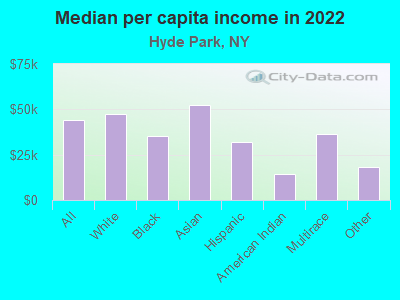
Median per capita income in Hyde Park in 2022:
Hyde Park:
$43,957
New York:
$47,421
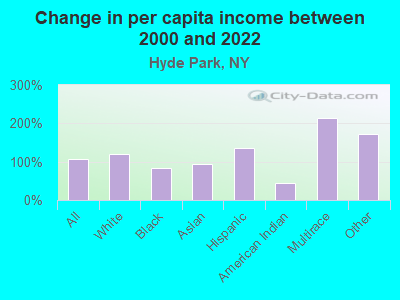
Change in median per capita income between 2000 and 2022:
Hyde Park, New York:
+106.8%
State:
+102.7%
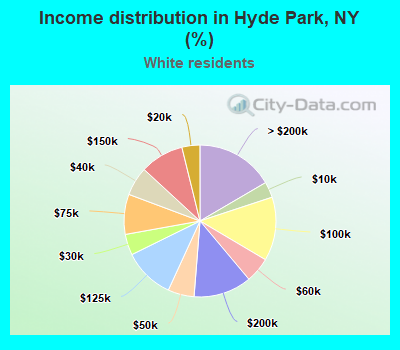
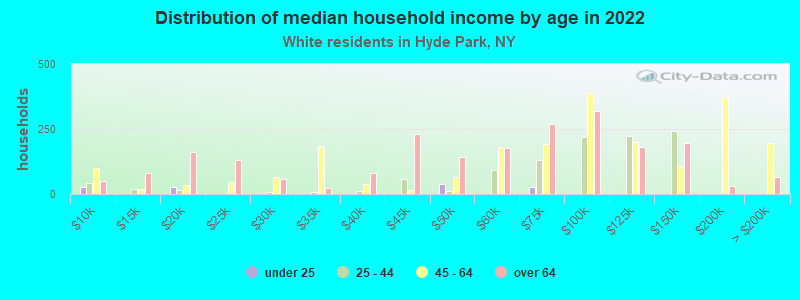
Income statistics for White residents
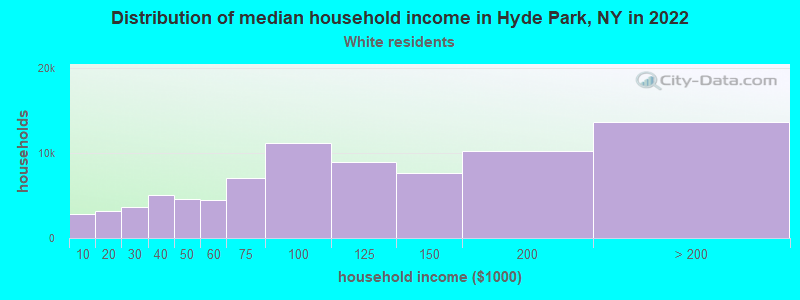
Median household income in Hyde Park, NY in 2022:
Hyde Park:
$91,351
State:
$89,408
Change in median household income between 2000 and 2022:
Hyde Park, New York:
+79.2%
State:
+85.5%
Number of households with income < $10k:
Hyde Park:
3.4% (2,762)
State:
4.8% (225,550)
Number of households with income $10k - 20k:
Hyde Park:
3.8% (3,142)
State:
6.1% (289,425)
Number of households with income $20k - 30k:
Hyde Park:
4.5% (3,659)
New York:
5.9% (280,254)
Number of households with income $30k - 40k:
Hyde Park:
6.1% (5,054)
New York:
6.1% (288,263)
Number of households with income $40k - 50k:
Hyde Park:
5.6% (4,601)
State:
5.9% (278,079)
Number of households with income $50k - 60k:
Hyde Park:
5.4% (4,413)
New York:
5.7% (267,554)
Number of households with income $60k - 75k:
Hyde Park:
8.5% (7,021)
State:
8.4% (398,344)
Number of households with income $75k - 100k:
Hyde Park:
13.6% (11,166)
State:
11.8% (554,841)
Number of households with income $100k - 125k:
Hyde Park:
10.9% (8,932)
State:
10.0% (469,794)
Number of households with income $125k - 150k:
Hyde Park:
9.3% (7,661)
New York:
7.6% (360,467)
Number of households with income $150k - 200k:
Hyde Park:
12.4% (10,166)
State:
10.1% (477,078)
Number of households with income > $200k:
Hyde Park:
16.6% (13,628)
New York:
17.6% (829,233)
Aggregate household income in Hyde Park in 2022: $2,172,496,669
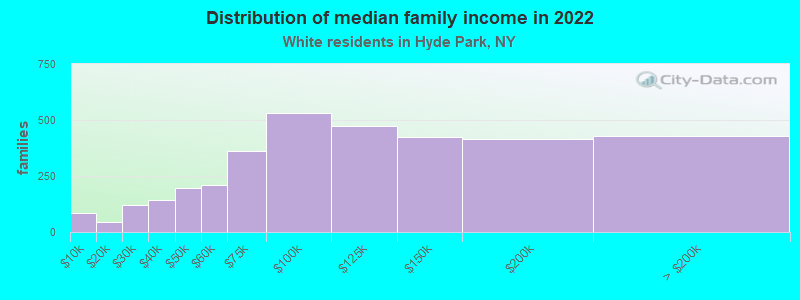
Median family income in Hyde Park in 2022:
Hyde Park:
$113,612
New York:
$115,170
Number of families with income < $10k:
Hyde Park:
2.5% (86)
New York:
2.5% (68,851)
Number of families with income $10k - 20k:
Hyde Park:
1.2% (43)
State:
3.0% (83,127)
Number of families with income $20k - 30k:
Hyde Park:
3.5% (119)
State:
3.5% (97,578)
Number of families with income $30k - 40k:
Hyde Park:
4.1% (141)
State:
4.1% (114,108)
Number of families with income $40k - 50k:
Hyde Park:
5.7% (197)
State:
4.7% (130,902)
Number of families with income $50k - 60k:
Hyde Park:
6.2% (211)
State:
4.9% (135,118)
Number of families with income $60k - 75k:
Hyde Park:
10.5% (361)
State:
7.8% (216,254)
Number of families with income $75k - 100k:
Hyde Park:
15.5% (532)
State:
12.4% (342,382)
Number of families with income $100k - 125k:
Hyde Park:
13.8% (475)
State:
11.4% (314,917)
Number of families with income $125k - 150k:
Hyde Park:
12.3% (424)
New York:
9.4% (260,489)
Number of families with income $150k - 200k:
Hyde Park:
12.0% (413)
New York:
13.2% (365,586)
Number of families with income > $200k:
Hyde Park:
12.5% (430)
New York:
23.2% (642,319)
Median non-family income in Hyde Park in 2022:
Hyde Park:
$54,923
State:
$54,783
Change in median non-family income between 2000 and 2022:
Hyde Park, New York:
+87.5%
State:
+87.9%
Median per capita income in Hyde Park in 2022:
Hyde Park:
$47,465
State:
$57,640
Change in median per capita income between 2000 and 2022:
Hyde Park, New York:
+119.7%
State:
+111.6%
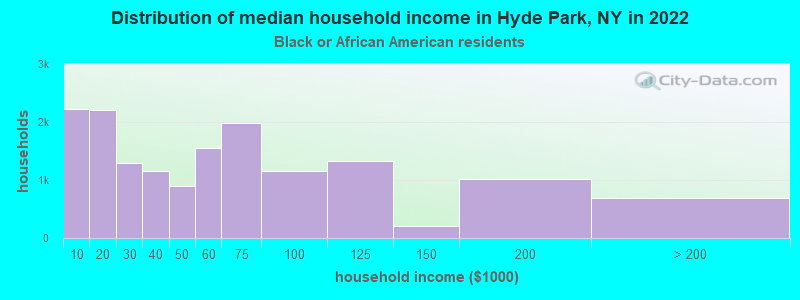
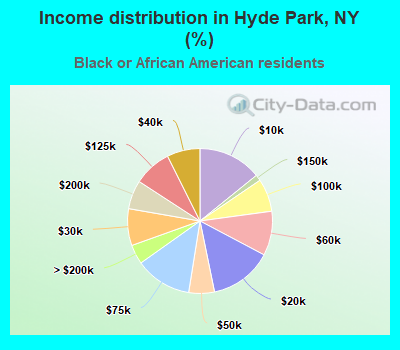
Income statistics for Black or African American residents
Median household income in Hyde Park, NY in 2022:
Hyde Park:
$75,751
New York:
$57,898
Change in median household income between 2000 and 2022:
Hyde Park, New York:
+43.8%
State:
+84.6%
Number of households with income < $10k:
Hyde Park:
14.2% (2,222)
State:
12.0% (128,500)
Number of households with income $10k - 20k:
Hyde Park:
14.0% (2,201)
New York:
10.0% (107,541)
Number of households with income $20k - 30k:
Hyde Park:
8.2% (1,287)
State:
8.4% (90,192)
Number of households with income $30k - 40k:
Hyde Park:
7.4% (1,157)
State:
7.4% (79,579)
Number of households with income $40k - 50k:
Hyde Park:
5.7% (898)
New York:
6.8% (72,491)
Number of households with income $50k - 60k:
Hyde Park:
9.9% (1,553)
New York:
6.7% (71,309)
Number of households with income $60k - 75k:
Hyde Park:
12.7% (1,985)
State:
8.9% (95,050)
Number of households with income $75k - 100k:
Hyde Park:
7.3% (1,150)
New York:
11.5% (123,569)
Number of households with income $100k - 125k:
Hyde Park:
8.4% (1,323)
State:
8.1% (86,632)
Number of households with income $125k - 150k:
Hyde Park:
1.3% (209)
New York:
6.0% (64,788)
Number of households with income $150k - 200k:
Hyde Park:
6.4% (1,009)
New York:
7.2% (76,644)
Number of households with income > $200k:
Hyde Park:
4.4% (682)
New York:
7.0% (75,062)
Aggregate household income in Hyde Park in 2022: $31,893,678
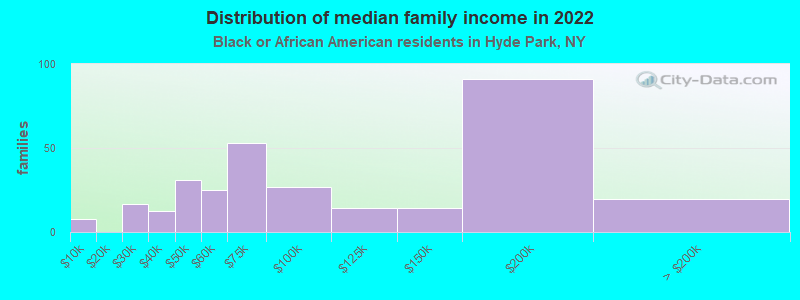
Median family income in Hyde Park in 2022:
Hyde Park:
$74,289
State:
$72,528
Number of families with income < $10k:
Hyde Park:
2.6% (8)
State:
8.6% (54,100)
Number of families with income $20k - 30k:
Hyde Park:
5.3% (17)
State:
7.0% (44,139)
Number of families with income $30k - 40k:
Hyde Park:
3.9% (12)
New York:
6.9% (43,353)
Number of families with income $40k - 50k:
Hyde Park:
10.0% (31)
State:
6.6% (41,419)
Number of families with income $50k - 60k:
Hyde Park:
8.0% (25)
New York:
6.3% (39,748)
Number of families with income $60k - 75k:
Hyde Park:
17.0% (53)
State:
9.2% (57,626)
Number of families with income $75k - 100k:
Hyde Park:
8.7% (27)
New York:
12.6% (78,986)
Number of families with income $100k - 125k:
Hyde Park:
4.5% (14)
New York:
9.8% (61,670)
Number of families with income $125k - 150k:
Hyde Park:
4.6% (15)
State:
7.5% (47,050)
Number of families with income $150k - 200k:
Hyde Park:
29.2% (91)
State:
9.4% (59,260)
Number of families with income > $200k:
Hyde Park:
6.3% (20)
New York:
9.3% (58,575)
Median non-family income in Hyde Park in 2022:
Hyde Park:
$67,141
New York:
$37,265
Change in median non-family income between 2000 and 2022:
Hyde Park, New York:
+19.4%
New York:
+81.7%
Median per capita income in Hyde Park in 2022:
Hyde Park:
$35,243
State:
$31,947
Change in median per capita income between 2000 and 2022:
Hyde Park, New York:
+82.9%
State:
+106.1%
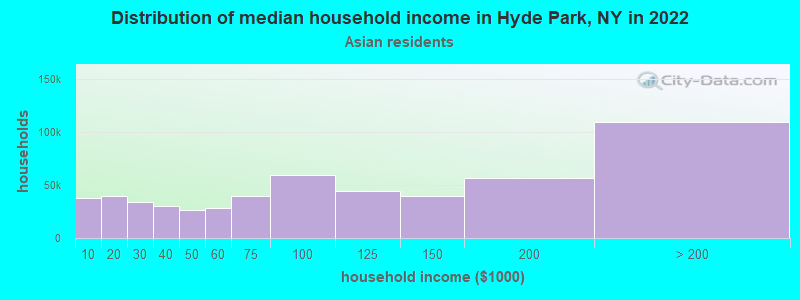
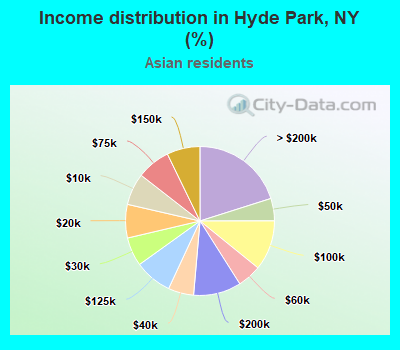
Income statistics for Asian residents
Median household income in Hyde Park, NY in 2022:
Hyde Park:
$160,984
State:
$89,947
Change in median household income between 2000 and 2022:
Hyde Park, New York:
+99.9%
State:
+98.1%
Number of households with income < $10k:
Hyde Park:
6.9% (37,723)
New York:
6.9% (42,537)
Number of households with income $10k - 20k:
Hyde Park:
7.3% (39,691)
New York:
7.3% (44,745)
Number of households with income $20k - 30k:
Hyde Park:
6.2% (33,986)
State:
6.2% (38,249)
Number of households with income $30k - 40k:
Hyde Park:
5.5% (30,148)
State:
5.5% (33,993)
Number of households with income $40k - 50k:
Hyde Park:
4.9% (26,462)
New York:
4.8% (29,795)
Number of households with income $50k - 60k:
Hyde Park:
5.2% (28,303)
State:
5.2% (32,100)
Number of households with income $60k - 75k:
Hyde Park:
7.3% (39,545)
State:
7.3% (44,615)
Number of households with income $75k - 100k:
Hyde Park:
10.9% (59,130)
State:
10.8% (66,687)
Number of households with income $100k - 125k:
Hyde Park:
8.2% (44,427)
New York:
8.2% (50,233)
Number of households with income $125k - 150k:
Hyde Park:
7.2% (39,256)
State:
7.2% (44,299)
Number of households with income $150k - 200k:
Hyde Park:
10.4% (56,478)
State:
10.4% (63,837)
Number of households with income > $200k:
Hyde Park:
20.1% (109,605)
State:
20.1% (123,891)
Aggregate household income in Hyde Park in 2022: $29,199,347
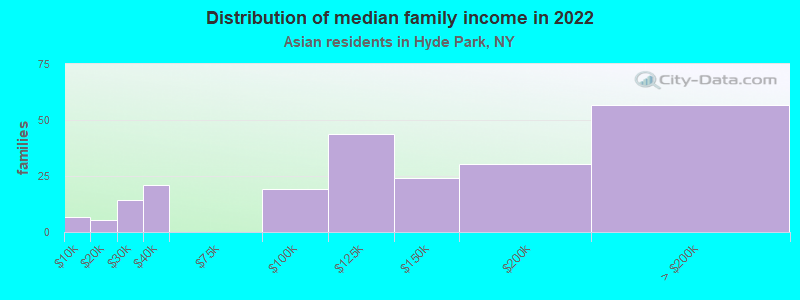
Median family income in Hyde Park in 2022:
Hyde Park:
$163,645
State:
$98,136
Number of families with income < $10k:
Hyde Park:
3.0% (7)
State:
4.1% (18,020)
Number of families with income $10k - 20k:
Hyde Park:
2.5% (6)
State:
5.2% (22,725)
Number of families with income $20k - 30k:
Hyde Park:
6.5% (14)
State:
6.4% (27,990)
Number of families with income $30k - 40k:
Hyde Park:
9.4% (21)
State:
6.2% (26,994)
Number of families with income $75k - 100k:
Hyde Park:
8.7% (19)
State:
10.7% (46,726)
Number of families with income $100k - 125k:
Hyde Park:
19.7% (44)
State:
8.6% (37,796)
Number of families with income $125k - 150k:
Hyde Park:
11.0% (24)
State:
7.3% (31,893)
Number of families with income $150k - 200k:
Hyde Park:
13.7% (30)
State:
11.0% (48,177)
Number of families with income > $200k:
Hyde Park:
25.5% (57)
New York:
22.2% (97,322)
Median non-family income in Hyde Park in 2022:
Hyde Park:
$70,836
State:
$63,573
Change in median non-family income between 2000 and 2022:
Hyde Park, New York:
+61.9%
State:
+101.1%
Median per capita income in Hyde Park in 2022:
Hyde Park:
$52,542
New York:
$46,726
Change in median per capita income between 2000 and 2022:
Hyde Park, New York:
+92.8%
State:
+126.6%
Income statistics for Hispanic or Latino residents
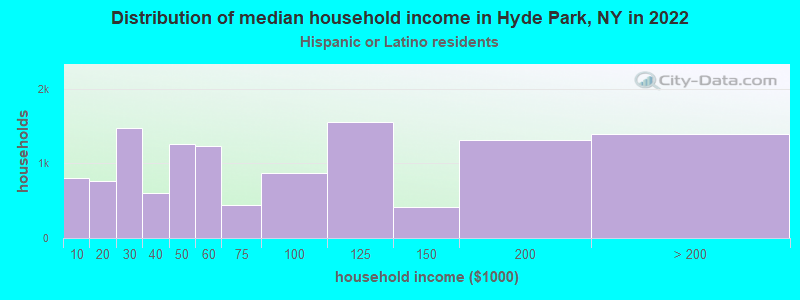
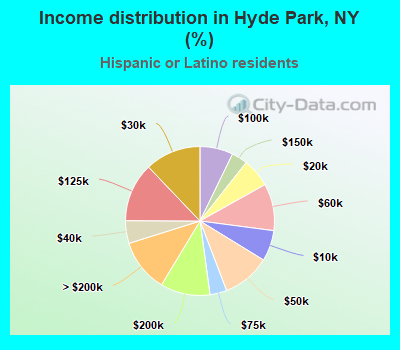
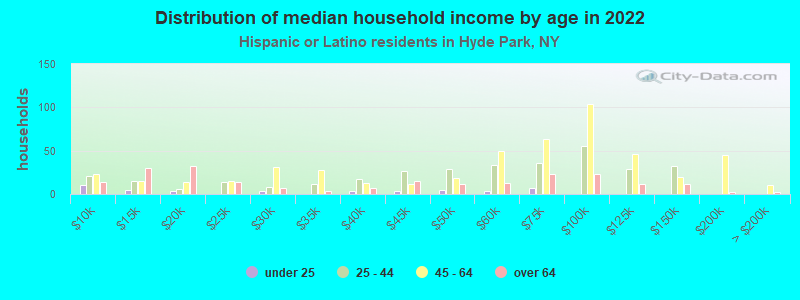
Median household income in Hyde Park, NY in 2022:
Hyde Park:
$56,922
State:
$60,468
Change in median household income between 2000 and 2022:
Hyde Park, New York:
+26.5%
State:
+98.3%
Number of households with income < $10k:
Hyde Park:
6.7% (811)
New York:
9.9% (127,185)
Number of households with income $10k - 20k:
Hyde Park:
6.3% (760)
State:
10.7% (136,699)
Number of households with income $20k - 30k:
Hyde Park:
12.1% (1,471)
New York:
8.1% (102,991)
Number of households with income $30k - 40k:
Hyde Park:
4.9% (598)
New York:
7.8% (100,149)
Number of households with income $40k - 50k:
Hyde Park:
10.4% (1,266)
New York:
6.9% (87,760)
Number of households with income $50k - 60k:
Hyde Park:
10.2% (1,237)
State:
6.3% (80,968)
Number of households with income $60k - 75k:
Hyde Park:
3.7% (444)
State:
8.7% (110,631)
Number of households with income $75k - 100k:
Hyde Park:
7.2% (875)
New York:
11.2% (142,787)
Number of households with income $100k - 125k:
Hyde Park:
12.8% (1,555)
State:
8.2% (104,850)
Number of households with income $125k - 150k:
Hyde Park:
3.4% (417)
State:
6.3% (80,274)
Number of households with income $150k - 200k:
Hyde Park:
10.8% (1,310)
New York:
7.4% (95,117)
Number of households with income > $200k:
Hyde Park:
11.5% (1,398)
State:
8.6% (109,514)
Aggregate household income in Hyde Park in 2022: $35,997,716
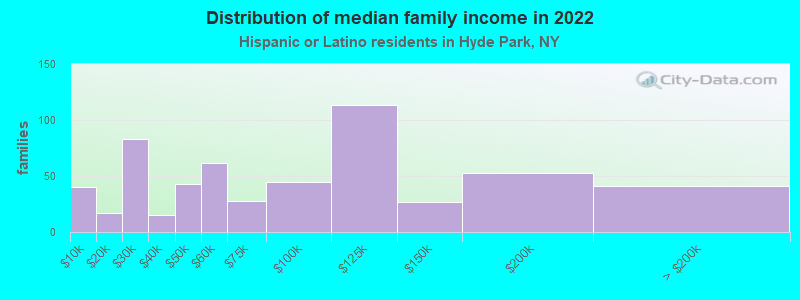
Median family income in Hyde Park in 2022:
Hyde Park:
$83,053
State:
$68,770
Number of families with income < $10k:
Hyde Park:
7.1% (40)
New York:
6.9% (58,565)
Number of families with income $10k - 20k:
Hyde Park:
3.0% (17)
State:
7.0% (59,058)
Number of families with income $20k - 30k:
Hyde Park:
14.5% (83)
New York:
8.0% (68,048)
Number of families with income $30k - 40k:
Hyde Park:
2.7% (15)
State:
8.4% (70,668)
Number of families with income $40k - 50k:
Hyde Park:
7.6% (43)
State:
7.4% (62,941)
Number of families with income $50k - 60k:
Hyde Park:
10.9% (62)
New York:
6.6% (55,592)
Number of families with income $60k - 75k:
Hyde Park:
5.0% (28)
State:
9.3% (78,564)
Number of families with income $75k - 100k:
Hyde Park:
8.0% (45)
State:
12.6% (106,685)
Number of families with income $100k - 125k:
Hyde Park:
19.9% (113)
New York:
9.4% (79,139)
Number of families with income $125k - 150k:
Hyde Park:
4.8% (27)
State:
6.9% (58,255)
Number of families with income $150k - 200k:
Hyde Park:
9.3% (53)
State:
8.3% (69,877)
Number of families with income > $200k:
Hyde Park:
7.2% (41)
New York:
9.3% (78,555)
Median non-family income in Hyde Park in 2022:
Hyde Park:
$77,008
State:
$34,000
Change in median non-family income between 2000 and 2022:
Hyde Park, New York:
+59.1%
State:
+93.9%
Median per capita income in Hyde Park in 2022:
Hyde Park:
$31,754
State:
$29,761
Change in median per capita income between 2000 and 2022:
Hyde Park, New York:
+136.2%
State:
+132.7%
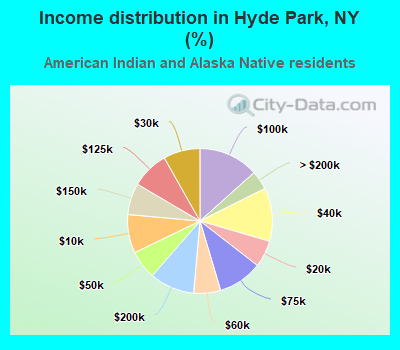
Income statistics for American Indian and Alaska Native residents
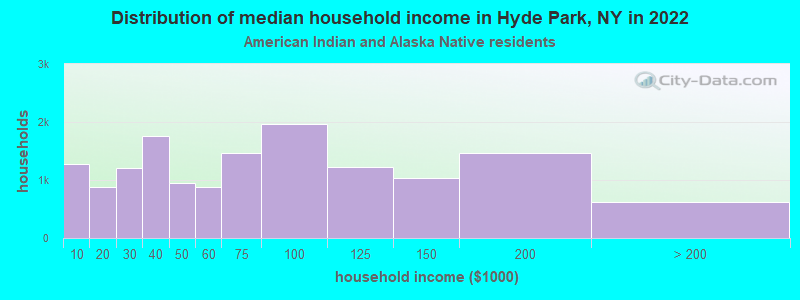
Median household income in Hyde Park, NY in 2022:
Hyde Park:
$41,685
State:
$63,208
Change in median household income between 2000 and 2022:
Hyde Park, New York:
+96.2%
State:
+110.1%
Number of households with income < $10k:
Hyde Park:
8.6% (1,269)
State:
8.6% (3,559)
Number of households with income $10k - 20k:
Hyde Park:
6.0% (881)
State:
5.9% (2,455)
Number of households with income $20k - 30k:
Hyde Park:
8.2% (1,205)
State:
8.2% (3,393)
Number of households with income $30k - 40k:
Hyde Park:
11.9% (1,754)
State:
11.9% (4,918)
Number of households with income $40k - 50k:
Hyde Park:
6.4% (942)
New York:
6.5% (2,682)
Number of households with income $50k - 60k:
Hyde Park:
6.0% (887)
New York:
6.1% (2,516)
Number of households with income $60k - 75k:
Hyde Park:
9.9% (1,457)
State:
10.0% (4,125)
Number of households with income $75k - 100k:
Hyde Park:
13.4% (1,971)
State:
13.3% (5,517)
Number of households with income $100k - 125k:
Hyde Park:
8.4% (1,230)
State:
8.4% (3,463)
Number of households with income $125k - 150k:
Hyde Park:
7.0% (1,035)
New York:
7.0% (2,887)
Number of households with income $150k - 200k:
Hyde Park:
10.0% (1,474)
State:
9.9% (4,106)
Number of households with income > $200k:
Hyde Park:
4.2% (623)
State:
4.2% (1,744)
Aggregate household income in Hyde Park in 2022: $622,334
Median family income in Hyde Park in 2022:
Hyde Park:
$17,599
New York:
$69,721
Median per capita income in Hyde Park in 2022:
Hyde Park:
$14,560
State:
$25,837
Change in median per capita income between 2000 and 2022:
Hyde Park, New York:
+44.8%
State:
+99.6%
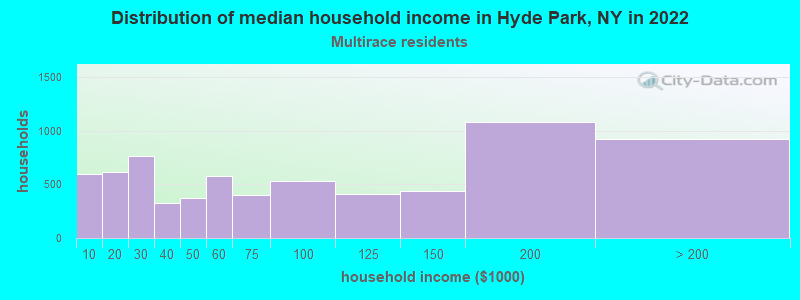
Income statistics for Multirace residents
Median household income in Hyde Park, NY in 2022:
Hyde Park:
$63,445
State:
$73,557
Change in median household income between 2000 and 2022:
Hyde Park, New York:
+87.4%
New York:
+123.9%
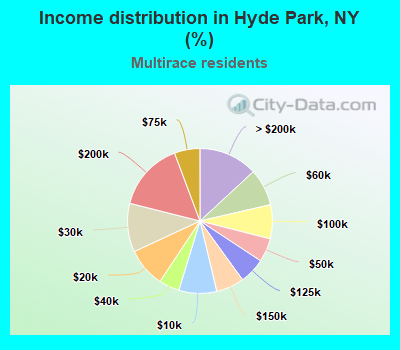
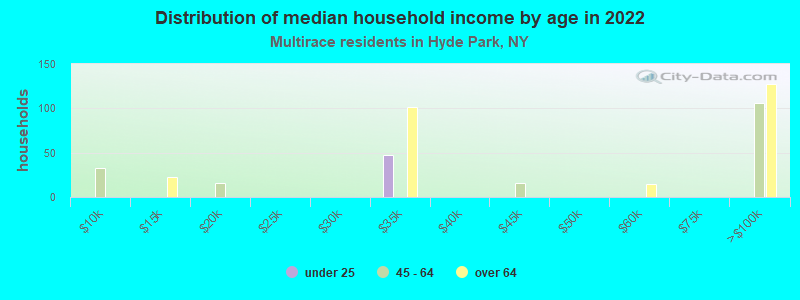
Number of households with income < $10k:
Hyde Park:
8.4% (595)
State:
8.9% (57,924)
Number of households with income $10k - 20k:
Hyde Park:
8.8% (617)
New York:
8.7% (56,590)
Number of households with income $20k - 30k:
Hyde Park:
10.9% (765)
State:
7.1% (46,287)
Number of households with income $30k - 40k:
Hyde Park:
4.6% (324)
New York:
6.9% (45,132)
Number of households with income $40k - 50k:
Hyde Park:
5.3% (372)
State:
5.8% (37,946)
Number of households with income $50k - 60k:
Hyde Park:
8.3% (582)
State:
5.6% (36,410)
Number of households with income $60k - 75k:
Hyde Park:
5.7% (402)
New York:
7.8% (50,819)
Number of households with income $75k - 100k:
Hyde Park:
7.6% (535)
New York:
11.7% (76,024)
Number of households with income $100k - 125k:
Hyde Park:
5.8% (406)
State:
9.3% (60,635)
Number of households with income $125k - 150k:
Hyde Park:
6.3% (441)
State:
6.2% (40,533)
Number of households with income $150k - 200k:
Hyde Park:
15.4% (1,082)
New York:
8.6% (56,409)
Number of households with income > $200k:
Hyde Park:
13.1% (925)
State:
13.4% (87,442)
Aggregate household income in Hyde Park in 2022: $62,614,838
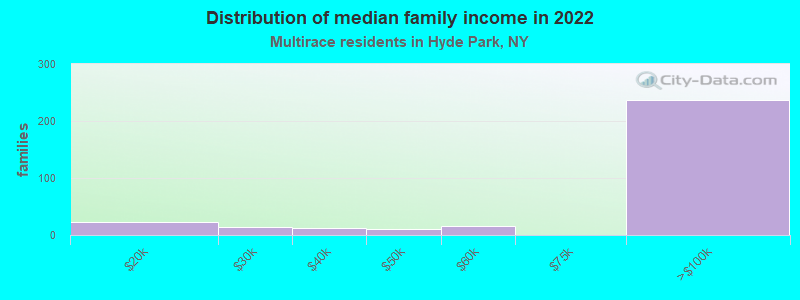
Median family income in Hyde Park in 2022:
Hyde Park:
$167,226
State:
$85,788
Number of families with income $10k - 20k:
Hyde Park:
7.3% (23)
New York:
5.6% (22,512)
Number of families with income $20k - 30k:
Hyde Park:
4.4% (14)
State:
6.6% (26,534)
Number of families with income $30k - 40k:
Hyde Park:
4.0% (12)
State:
6.5% (26,239)
Number of families with income $40k - 50k:
Hyde Park:
3.1% (10)
State:
6.1% (24,694)
Number of families with income $50k - 60k:
Hyde Park:
5.2% (16)
New York:
5.5% (22,002)
Number of families with income $75k - 100k:
Hyde Park:
75.9% (236)
New York:
12.9% (51,995)
Median non-family income in Hyde Park in 2022:
Hyde Park:
$69,909
New York:
$46,403
Change in median non-family income between 2000 and 2022:
Hyde Park, New York:
+125.8%
New York:
+113.6%
Median per capita income in Hyde Park in 2022:
Hyde Park:
$36,209
State:
$36,931
Income statistics for other residents
Number of households with income < $10k:
Hyde Park:
10.4% (28)
New York:
10.3% (69,252)
Number of households with income $10k - 20k:
Hyde Park:
10.4% (28)
State:
11.0% (73,890)
Number of households with income $20k - 30k:
Hyde Park:
7.8% (21)
New York:
8.8% (59,096)
Number of households with income $30k - 40k:
Hyde Park:
7.4% (20)
State:
8.1% (54,418)
Number of households with income $40k - 50k:
Hyde Park:
7.4% (20)
State:
7.3% (49,042)
Number of households with income $50k - 60k:
Hyde Park:
5.6% (15)
New York:
6.5% (43,945)
Number of households with income $60k - 75k:
Hyde Park:
9.3% (25)
State:
9.5% (64,087)
Number of households with income $75k - 100k:
Hyde Park:
11.2% (30)
State:
10.9% (73,094)
Number of households with income $100k - 125k:
Hyde Park:
8.9% (24)
State:
7.9% (53,055)
Number of households with income $125k - 150k:
Hyde Park:
5.2% (14)
State:
5.9% (39,446)
Number of households with income $150k - 200k:
Hyde Park:
8.9% (24)
State:
7.2% (48,653)
Number of households with income > $200k:
Hyde Park:
7.4% (20)
State:
6.6% (44,703)
Aggregate household income in Hyde Park in 2022: $13,642,178
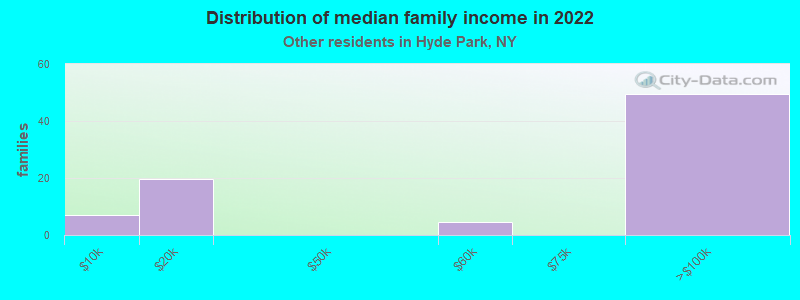
Median family income in Hyde Park in 2022:
Hyde Park:
$30,125
State:
$63,465
Number of families with income < $10k:
Hyde Park:
8.9% (7)
State:
6.2% (29,008)
Number of families with income $10k - 20k:
Hyde Park:
24.1% (19)
State:
7.4% (34,598)
Number of families with income $50k - 60k:
Hyde Park:
5.6% (5)
State:
7.1% (33,324)
Number of families with income $75k - 100k:
Hyde Park:
61.4% (50)
New York:
12.5% (58,659)
Median non-family income in Hyde Park in 2022:
Hyde Park:
$44,384
State:
$26,983
Change in median non-family income between 2000 and 2022:
Hyde Park, New York:
+108.9%
State:
+66.4%
Median per capita income in Hyde Park in 2022:
Hyde Park:
$18,113
State:
$26,975
Discuss Hyde Park, New York (NY) on our hugely popular New York forum.