Huntington, Vermont (VT) income map, earnings map, and wages data
The median household income in Huntington, VT in 2022 was $91,080, which was 18.8% greater than the median annual income of $73,991 across the entire state of Vermont. Compared to the median income of $49,559 in 2000 this represents an increase of 45.6%. The per capita income in 2022 was $39,939, which means an increase of 48.9% compared to 2000 when it was $20,402.
Income statistics for all residents
Median household income in Huntington, VT in 2022:| Huntington: | $91,080 |
| State: | $73,991 |
Change in median household income between 2000 and 2022:| Huntington, Vermont: | +83.8% |
| State: | +81.1% |
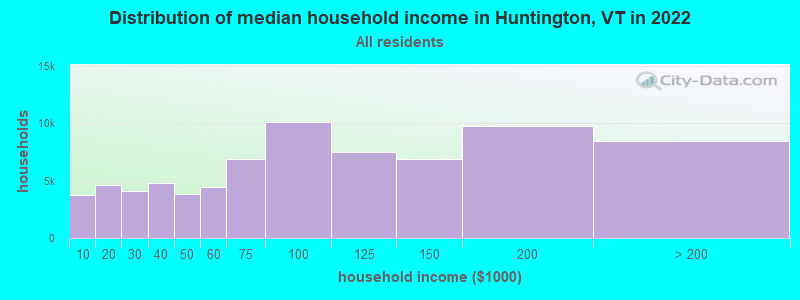
Number of households with income < $10k:| Huntington: | 5.0% (3,714) |
| Vermont: | 4.0% (11,050) |
Number of households with income $10k - 20k:| Huntington: | 6.1% (4,598) |
| State: | 6.8% (18,853) |
Number of households with income $20k - 30k:| Huntington: | 5.5% (4,125) |
| State: | 7.5% (20,673) |
Number of households with income $30k - 40k:| Huntington: | 6.4% (4,761) |
| State: | 7.8% (21,750) |
Number of households with income $40k - 50k:| Huntington: | 5.1% (3,855) |
| State: | 7.4% (20,642) |
Number of households with income $50k - 60k:| Huntington: | 5.9% (4,460) |
| State: | 7.2% (19,901) |
Number of households with income $60k - 75k:| Huntington: | 9.2% (6,903) |
| State: | 9.9% (27,351) |
Number of households with income $75k - 100k:| Huntington: | 13.5% (10,102) |
| Vermont: | 13.8% (38,275) |
Number of households with income $100k - 125k:| Huntington: | 10.0% (7,461) |
| Vermont: | 9.6% (26,632) |
Number of households with income $125k - 150k:| Huntington: | 9.1% (6,841) |
| State: | 7.5% (20,857) |
Number of households with income $150k - 200k:| Huntington: | 13.0% (9,714) |
| State: | 9.9% (27,469) |
Number of households with income > $200k:| Huntington: | 11.2% (8,425) |
| State: | 8.5% (23,637) |
Aggregate household income in Huntington in 2022: $138,680,922
Median family income in Huntington in 2022:| Huntington: | $106,742 |
| State: | $96,345 |
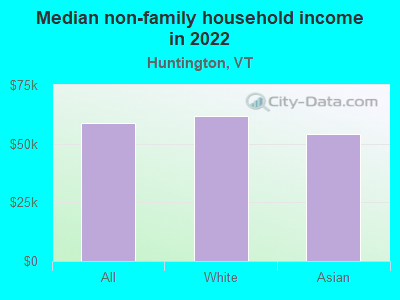
Median non-family income in Huntington in 2022:| Huntington: | $58,925 |
| State: | $46,022 |
Change in median non-family income between 2000 and 2022:| Huntington, Vermont: | +77.9% |
| State: | +87.4% |
Median per capita income in Huntington in 2022:| Huntington: | $39,939 |
| State: | $42,251 |
Change in median per capita income between 2000 and 2022:| Huntington, Vermont: | +95.8% |
| Vermont: | +104.9% |
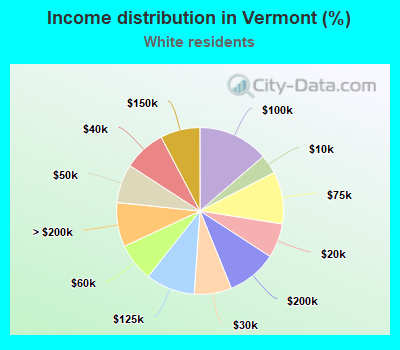
Income statistics for White residents
Median household income in Huntington, VT in 2022:| Huntington: | $90,867 |
| State: | $73,591 |
Change in median household income between 2000 and 2022:| Huntington, Vermont: | +82.8% |
| Vermont: | +79.2% |
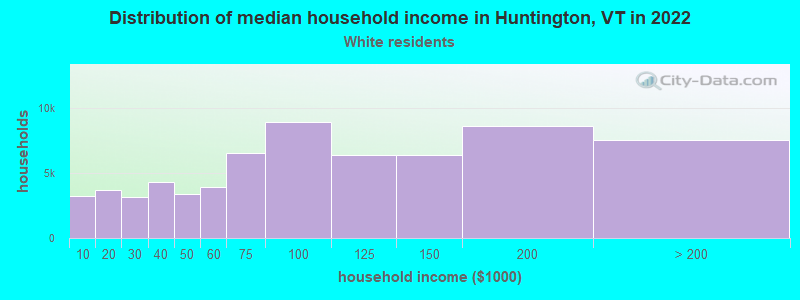
Number of households with income < $10k:| Huntington: | 4.8% (3,193) |
| State: | 3.7% (9,508) |
Number of households with income $10k - 20k:| Huntington: | 5.6% (3,674) |
| State: | 6.7% (17,064) |
Number of households with income $20k - 30k:| Huntington: | 4.8% (3,173) |
| State: | 7.2% (18,552) |
Number of households with income $30k - 40k:| Huntington: | 6.5% (4,320) |
| State: | 8.2% (20,886) |
Number of households with income $40k - 50k:| Huntington: | 5.1% (3,371) |
| Vermont: | 7.5% (19,216) |
Number of households with income $50k - 60k:| Huntington: | 5.9% (3,901) |
| State: | 7.4% (18,898) |
Number of households with income $60k - 75k:| Huntington: | 9.9% (6,538) |
| State: | 10.1% (25,944) |
Number of households with income $75k - 100k:| Huntington: | 13.5% (8,925) |
| Vermont: | 13.7% (34,991) |
Number of households with income $100k - 125k:| Huntington: | 9.7% (6,391) |
| State: | 9.5% (24,409) |
Number of households with income $125k - 150k:| Huntington: | 9.7% (6,375) |
| State: | 7.7% (19,710) |
Number of households with income $150k - 200k:| Huntington: | 13.1% (8,622) |
| State: | 9.7% (24,802) |
Number of households with income > $200k:| Huntington: | 11.5% (7,568) |
| Vermont: | 8.6% (21,983) |
Aggregate household income in Huntington in 2022: $122,310,682
Median family income in Huntington in 2022:| Huntington: | $106,283 |
| State: | $96,147 |
Number of families with income < $10k:| Huntington: | 2.9% (10) |
| State: | 1.8% (2,669) |
Number of families with income $10k - 20k:| Huntington: | 1.6% (5) |
| State: | 3.1% (4,686) |
Number of families with income $20k - 30k:| Huntington: | 6.1% (20) |
| Vermont: | 4.1% (6,266) |
Number of families with income $30k - 40k:| Huntington: | 5.6% (19) |
| State: | 6.1% (9,273) |
Number of families with income $40k - 50k:| Huntington: | 8.4% (28) |
| State: | 6.4% (9,714) |
Number of families with income $50k - 60k:| Huntington: | 6.7% (22) |
| State: | 6.1% (9,310) |
Number of families with income $60k - 75k:| Huntington: | 17.0% (57) |
| State: | 9.3% (14,175) |
Number of families with income $75k - 100k:| Huntington: | 15.3% (51) |
| State: | 15.5% (23,673) |
Number of families with income $100k - 125k:| Huntington: | 11.7% (39) |
| Vermont: | 12.7% (19,323) |
Number of families with income $125k - 150k:| Huntington: | 11.2% (37) |
| Vermont: | 9.7% (14,805) |
Number of families with income > $200k:| Huntington: | 13.5% (45) |
| Vermont: | 12.1% (18,463) |
Median non-family income in Huntington in 2022:| Huntington: | $61,664 |
| State: | $45,952 |
Change in median non-family income between 2000 and 2022:| Huntington, Vermont: | +82.7% |
| Vermont: | +86.1% |
Median per capita income in Huntington in 2022:| Huntington: | $40,845 |
| State: | $43,031 |
Change in median per capita income between 2000 and 2022:| Huntington, Vermont: | +99.8% |
| State: | +106.0% |
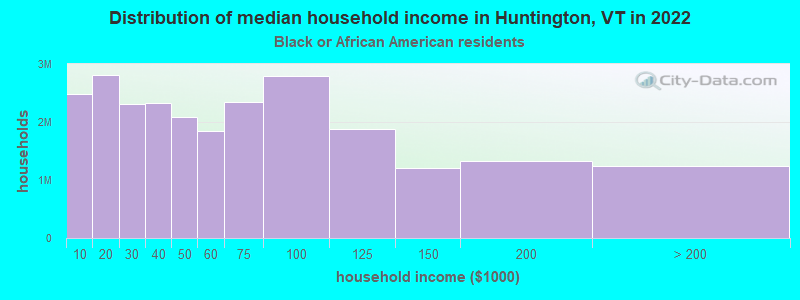
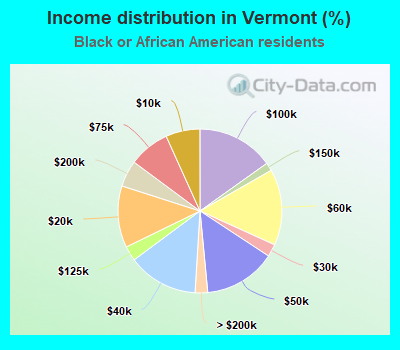
Income statistics for Black or African American residents
Median household income in Huntington, VT in 2022:| Huntington: | $85,208 |
| Vermont: | $78,611 |
Change in median household income between 2000 and 2022:| Huntington, Vermont: | +84.2% |
| State: | +148.9% |
Number of households with income < $10k:| Huntington: | 10.1% (2,482,210) |
| Vermont: | 6.8% (152) |
Number of households with income $10k - 20k:| Huntington: | 11.4% (2,814,934) |
| State: | 12.2% (274) |
Number of households with income $20k - 30k:| Huntington: | 9.4% (2,316,012) |
| State: | 2.5% (56) |
Number of households with income $30k - 40k:| Huntington: | 9.5% (2,333,234) |
| State: | 13.9% (312) |
Number of households with income $40k - 50k:| Huntington: | 8.5% (2,091,417) |
| State: | 14.2% (320) |
Number of households with income $50k - 60k:| Huntington: | 7.5% (1,847,664) |
| State: | 15.0% (338) |
Number of households with income $60k - 75k:| Huntington: | 9.5% (2,338,847) |
| State: | 8.1% (182) |
Number of households with income $75k - 100k:| Huntington: | 11.3% (2,787,962) |
| Vermont: | 15.2% (341) |
Number of households with income $100k - 125k:| Huntington: | 7.6% (1,883,617) |
| State: | 2.9% (66) |
Number of households with income $125k - 150k:| Huntington: | 4.9% (1,199,518) |
| State: | 1.6% (36) |
Number of households with income $150k - 200k:| Huntington: | 5.4% (1,332,523) |
| State: | 5.2% (117) |
Number of households with income > $200k:| Huntington: | 5.1% (1,248,706) |
| State: | 2.5% (56) |
Aggregate household income in Huntington in 2022: $153,568
Median family income in Huntington in 2022:| Huntington: | $146,429 |
| State: | $120,113 |
Median per capita income in Huntington in 2022:| Huntington: | $10,256 |
| State: | $40,315 |
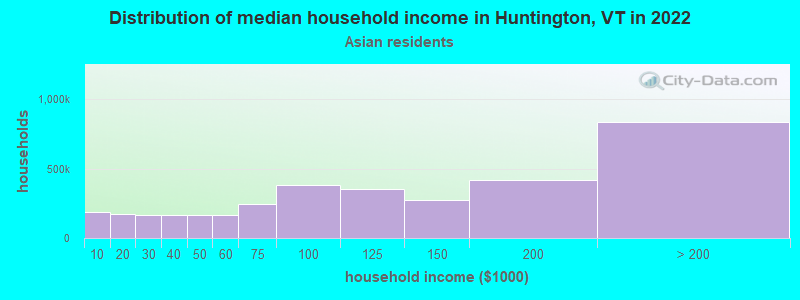
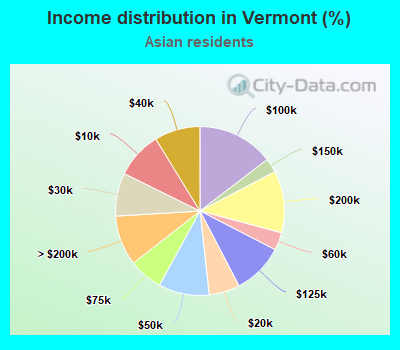
Income statistics for Asian residents
Median household income in Huntington, VT in 2022:| Huntington: | $55,977 |
| Vermont: | $70,809 |
Change in median household income between 2000 and 2022:| Huntington, Vermont: | +108.3% |
| Vermont: | +78.7% |
Number of households with income < $10k:| Huntington: | 5.3% (187,554) |
| State: | 8.9% (278) |
Number of households with income $10k - 20k:| Huntington: | 4.8% (169,312) |
| Vermont: | 5.9% (184) |
Number of households with income $20k - 30k:| Huntington: | 4.7% (165,711) |
| State: | 8.3% (258) |
Number of households with income $30k - 40k:| Huntington: | 4.7% (164,491) |
| State: | 8.8% (273) |
Number of households with income $40k - 50k:| Huntington: | 4.6% (161,976) |
| State: | 9.7% (302) |
Number of households with income $50k - 60k:| Huntington: | 4.8% (168,117) |
| State: | 3.4% (106) |
Number of households with income $60k - 75k:| Huntington: | 6.9% (241,101) |
| State: | 6.5% (202) |
Number of households with income $75k - 100k:| Huntington: | 10.9% (381,943) |
| Vermont: | 14.6% (455) |
Number of households with income $100k - 125k:| Huntington: | 10.0% (350,146) |
| State: | 9.8% (305) |
Number of households with income $125k - 150k:| Huntington: | 7.8% (275,526) |
| State: | 2.7% (85) |
Number of households with income $150k - 200k:| Huntington: | 11.8% (415,837) |
| State: | 11.8% (369) |
Number of households with income > $200k:| Huntington: | 23.7% (834,824) |
| State: | 9.6% (299) |
Aggregate household income in Huntington in 2022: $2,557,666
Median family income in Huntington in 2022:| Huntington: | $161,248 |
| State: | $95,526 |
Median non-family income in Huntington in 2022:| Huntington: | $53,966 |
| State: | $42,689 |
Change in median non-family income between 2000 and 2022:| Huntington, Vermont: | +110.6% |
| State: | +70.5% |
Median per capita income in Huntington in 2022:| Huntington: | $90,018 |
| Vermont: | $32,037 |
Change in median per capita income between 2000 and 2022:| Huntington, Vermont: | +121.3% |
| State: | +133.5% |
Income statistics for Hispanic or Latino residents
Number of households with income < $10k:| Huntington: | 9.2% (623) |
| State: | 9.2% (500) |
Number of households with income $10k - 20k:| Huntington: | 5.3% (359) |
| State: | 5.3% (288) |
Number of households with income $20k - 30k:| Huntington: | 3.7% (253) |
| State: | 3.7% (203) |
Number of households with income $30k - 40k:| Huntington: | 5.3% (359) |
| State: | 5.3% (288) |
Number of households with income $40k - 50k:| Huntington: | 7.0% (472) |
| State: | 7.0% (379) |
Number of households with income $50k - 60k:| Huntington: | 6.9% (468) |
| Vermont: | 6.9% (376) |
Number of households with income $60k - 75k:| Huntington: | 5.2% (351) |
| State: | 5.2% (282) |
Number of households with income $75k - 100k:| Huntington: | 16.7% (1,128) |
| State: | 16.7% (905) |
Number of households with income $100k - 125k:| Huntington: | 12.6% (850) |
| State: | 12.6% (682) |
Number of households with income $125k - 150k:| Huntington: | 12.3% (834) |
| State: | 12.3% (669) |
Number of households with income $150k - 200k:| Huntington: | 7.6% (513) |
| State: | 7.6% (412) |
Number of households with income > $200k:| Huntington: | 8.3% (561) |
| Vermont: | 8.3% (450) |
Median per capita income in Huntington in 2022:| Huntington: | $49,113 |
| State: | $36,311 |
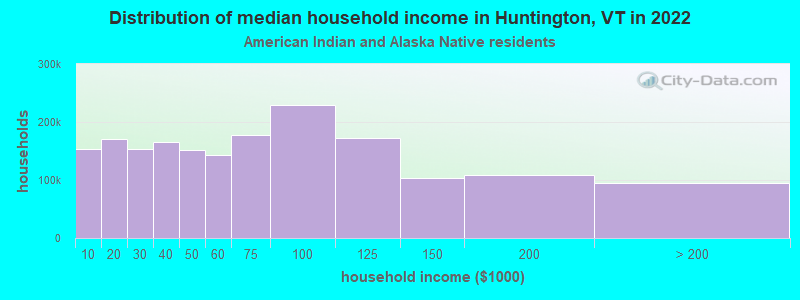
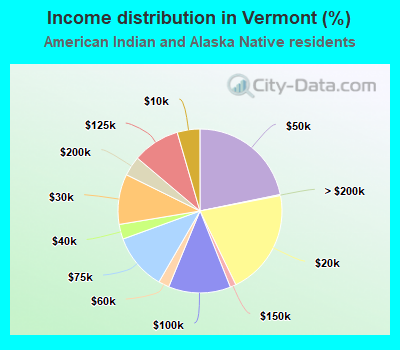
Income statistics for American Indian and Alaska Native residents
Number of households with income < $10k:| Huntington: | 7.8% (4) |
| Vermont: | 4.5% (23) |
Number of households with income $10k - 20k:| Huntington: | 9.8% (5) |
| Vermont: | 20.8% (107) |
Number of households with income $20k - 30k:| Huntington: | 7.8% (4) |
| State: | 9.9% (51) |
Number of households with income $30k - 40k:| Huntington: | 7.8% (4) |
| Vermont: | 2.9% (15) |
Number of households with income $40k - 50k:| Huntington: | 7.8% (4) |
| State: | 21.8% (112) |
Number of households with income $50k - 60k:| Huntington: | 7.8% (4) |
| State: | 2.1% (11) |
Number of households with income $60k - 75k:| Huntington: | 9.8% (5) |
| State: | 11.1% (57) |
Number of households with income $75k - 100k:| Huntington: | 13.7% (7) |
| State: | 12.3% (63) |
Number of households with income $100k - 125k:| Huntington: | 9.8% (5) |
| State: | 9.3% (48) |
Number of households with income $125k - 150k:| Huntington: | 5.9% (3) |
| State: | 1.2% (6) |
Number of households with income $150k - 200k:| Huntington: | 5.9% (3) |
| State: | 3.9% (20) |
Number of households with income > $200k:| Huntington: | 5.9% (3) |
| State: | 0.2% (1) |
Aggregate household income in Huntington in 2022: $68,290
Median per capita income in Huntington in 2022:| Huntington: | $46,092 |
| State: | $19,747 |
Change in median per capita income between 2000 and 2022:| Huntington, Vermont: | +13.8% |
| Vermont: | +41.4% |
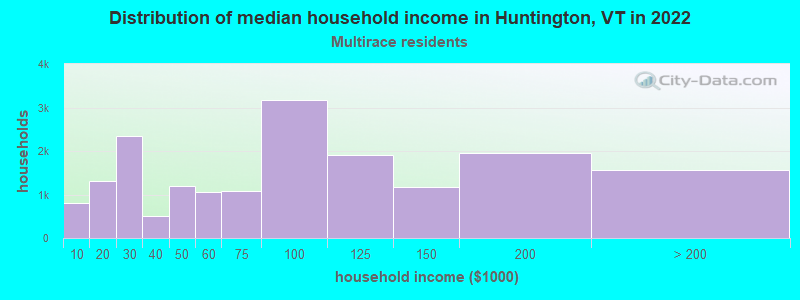
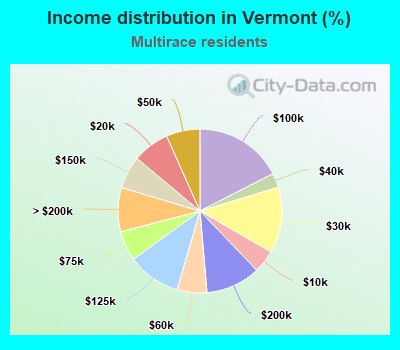
Income statistics for Multirace residents
Median household income in Huntington, VT in 2022:| Huntington: | $97,967 |
| State: | $81,819 |
Change in median household income between 2000 and 2022:| Huntington, Vermont: | +137.5% |
| State: | +164.1% |
Number of households with income < $10k:| Huntington: | 4.5% (816) |
| State: | 4.5% (613) |
Number of households with income $10k - 20k:| Huntington: | 7.3% (1,315) |
| State: | 7.3% (988) |
Number of households with income $20k - 30k:| Huntington: | 13.0% (2,356) |
| State: | 13.0% (1,770) |
Number of households with income $30k - 40k:| Huntington: | 2.8% (514) |
| State: | 2.8% (386) |
Number of households with income $40k - 50k:| Huntington: | 6.7% (1,204) |
| State: | 6.7% (904) |
Number of households with income $50k - 60k:| Huntington: | 5.9% (1,061) |
| State: | 5.9% (797) |
Number of households with income $60k - 75k:| Huntington: | 5.9% (1,070) |
| State: | 5.9% (804) |
Number of households with income $75k - 100k:| Huntington: | 17.5% (3,163) |
| State: | 17.5% (2,376) |
Number of households with income $100k - 125k:| Huntington: | 10.5% (1,900) |
| State: | 10.5% (1,427) |
Number of households with income $125k - 150k:| Huntington: | 6.5% (1,168) |
| State: | 6.5% (877) |
Number of households with income $150k - 200k:| Huntington: | 10.8% (1,953) |
| State: | 10.8% (1,467) |
Number of households with income > $200k:| Huntington: | 8.7% (1,571) |
| State: | 8.7% (1,180) |
Aggregate household income in Huntington in 2022: $1,322,696
Median family income in Huntington in 2022:| Huntington: | $97,044 |
| Vermont: | $98,198 |
Median per capita income in Huntington in 2022:| Huntington: | $12,131 |
| State: | $34,567 |
Change in median per capita income between 2000 and 2022:| Huntington, Vermont: | +118.1% |
| State: | +177.8% |