The median household income in Huntington, TX in 2022 was $47,731, which was 51.4% less than the median annual income of $72,284 across the entire state of Texas. Compared to the median income of $28,986 in 2000 this represents an increase of 39.3%. The per capita income in 2022 was $23,112, which means an increase of 48.1% compared to 2000 when it was $11,989.
Whole page based on the data from 2000 / 2022 when the population of Huntington, Texas was 2,068 / 3,509
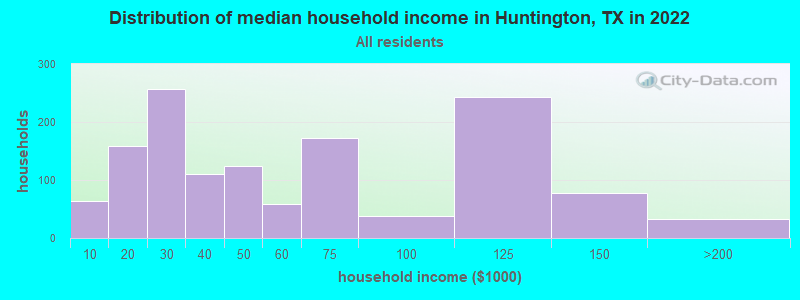
Income statistics for all residents
Median household income in Huntington, TX in 2022:
Huntington:
$47,732
Texas:
$72,284
Change in median household income between 2000 and 2022:
Huntington, Texas:
+64.7%
Texas:
+81.0%
Number of households with income < $10k:
Huntington:
4.8% (64)
Texas:
5.5% (611,011)
Number of households with income $10k - 20k:
Huntington:
11.8% (158)
State:
6.7% (743,157)
Number of households with income $20k - 30k:
Huntington:
19.2% (257)
State:
7.2% (803,381)
Number of households with income $30k - 40k:
Huntington:
8.3% (111)
State:
7.8% (866,080)
Number of households with income $40k - 50k:
Huntington:
9.3% (124)
State:
7.3% (810,440)
Number of households with income $50k - 60k:
Huntington:
4.4% (59)
State:
7.2% (799,783)
Number of households with income $60k - 75k:
Huntington:
12.9% (173)
State:
9.9% (1,095,384)
Number of households with income $75k - 100k:
Huntington:
2.8% (38)
State:
12.8% (1,419,057)
Number of households with income $100k - 125k:
Huntington:
18.2% (243)
State:
9.5% (1,054,577)
Number of households with income $125k - 150k:
Huntington:
5.8% (78)
Texas:
6.7% (741,518)
Number of households with income $150k - 200k:
Huntington:
2.5% (33)
Texas:
8.7% (961,776)
Number of households with income > $200k:
Huntington:
0.0% (0)
Texas:
10.7% (1,181,544)
Aggregate household income in Huntington in 2022: $92,396,827
Median family income in Huntington in 2022:
Huntington:
$64,674
State:
$86,267
Number of families with income < $10k:
Huntington:
1.4% (13)
State:
4.0% (297,884)
Number of families with income $10k - 20k:
Huntington:
2.1% (19)
State:
4.3% (324,514)
Number of families with income $20k - 30k:
Huntington:
16.1% (151)
State:
5.8% (430,949)
Number of families with income $30k - 40k:
Huntington:
7.4% (70)
Texas:
6.6% (493,535)
Number of families with income $40k - 50k:
Huntington:
11.7% (110)
State:
6.7% (499,663)
Number of families with income $50k - 60k:
Huntington:
3.6% (33)
State:
6.6% (492,203)
Number of families with income $60k - 75k:
Huntington:
19.0% (178)
Texas:
9.5% (710,229)
Number of families with income $75k - 100k:
Huntington:
6.1% (57)
State:
13.6% (1,015,480)
Number of families with income $100k - 125k:
Huntington:
27.8% (261)
State:
10.7% (797,961)
Number of families with income $125k - 150k:
Huntington:
3.0% (29)
Texas:
8.1% (602,985)
Number of families with income $150k - 200k:
Huntington:
1.9% (18)
Texas:
10.7% (804,459)
Median non-family income in Huntington in 2022:
Huntington:
$16,203
State:
$45,999
Change in median non-family income between 2000 and 2022:
Huntington, Texas:
+34.4%
Texas:
+79.5%
Median per capita income in Huntington in 2022:
Huntington:
$23,113
State:
$38,123
Change in median per capita income between 2000 and 2022:
Huntington, Texas:
+92.8%
Texas:
+94.3%
Income statistics for White residents
Median household income in Huntington, TX in 2022:
Huntington:
$51,410
State:
$82,032
Change in median household income between 2000 and 2022:
Huntington, Texas:
+69.7%
Texas:
+91.0%
Number of households with income < $10k:
Huntington:
7.0% (78)
Texas:
4.7% (273,716)
Number of households with income $10k - 20k:
Huntington:
11.3% (126)
State:
5.5% (322,702)
Number of households with income $20k - 30k:
Huntington:
19.9% (222)
State:
6.2% (363,947)
Number of households with income $30k - 40k:
Huntington:
7.6% (85)
Texas:
6.8% (399,275)
Number of households with income $40k - 50k:
Huntington:
6.9% (77)
Texas:
6.5% (383,417)
Number of households with income $50k - 60k:
Huntington:
5.7% (64)
Texas:
6.6% (388,535)
Number of households with income $60k - 75k:
Huntington:
12.3% (137)
State:
9.7% (566,295)
Number of households with income $75k - 100k:
Huntington:
3.3% (37)
State:
13.0% (760,276)
Number of households with income $100k - 125k:
Huntington:
17.9% (200)
State:
10.2% (597,596)
Number of households with income $125k - 150k:
Huntington:
5.9% (66)
State:
7.4% (436,830)
Number of households with income $150k - 200k:
Huntington:
2.2% (24)
Texas:
9.9% (583,067)
Number of households with income > $200k:
Huntington:
0.0% (0)
Texas:
13.5% (792,647)
Aggregate household income in Huntington in 2022: $78,626,964
Median family income in Huntington in 2022:
Huntington:
$66,572
State:
$101,788
Number of families with income < $10k:
Huntington:
2.5% (19)
State:
2.8% (108,142)
Number of families with income $10k - 20k:
Huntington:
1.7% (13)
Texas:
2.9% (113,421)
Number of families with income $20k - 30k:
Huntington:
16.3% (126)
State:
4.1% (157,688)
Number of families with income $30k - 40k:
Huntington:
7.9% (61)
State:
5.2% (198,847)
Number of families with income $40k - 50k:
Huntington:
7.3% (57)
State:
5.6% (216,490)
Number of families with income $50k - 60k:
Huntington:
5.3% (41)
Texas:
5.7% (220,689)
Number of families with income $60k - 75k:
Huntington:
16.5% (128)
State:
9.0% (346,106)
Number of families with income $75k - 100k:
Huntington:
7.5% (58)
State:
13.7% (527,363)
Number of families with income $100k - 125k:
Huntington:
30.2% (234)
State:
11.6% (448,411)
Number of families with income $125k - 150k:
Huntington:
2.3% (18)
State:
9.2% (355,798)
Number of families with income $150k - 200k:
Huntington:
2.6% (20)
State:
12.5% (480,185)
Median non-family income in Huntington in 2022:
Huntington:
$15,567
State:
$50,587
Change in median non-family income between 2000 and 2022:: -0.4%
Huntington, Texas:
-0.4%
State:
+87.7%
Median per capita income in Huntington in 2022:
Huntington:
$22,344
State:
$47,740
Change in median per capita income between 2000 and 2022:
Huntington, Texas:
+69.0%
State:
+114.3%
Income statistics for Black or African American residents
Number of households with income < $10k:
Huntington:
0.0% (0)
State:
8.9% (126,378)
Number of households with income $10k - 20k:
Huntington:
0.0% (0)
State:
9.9% (140,369)
Number of households with income $20k - 30k:
Huntington:
44.2% (23)
State:
8.5% (120,639)
Number of households with income $30k - 40k:
Huntington:
0.0% (0)
Texas:
9.7% (137,517)
Number of households with income $40k - 50k:
Huntington:
0.0% (0)
State:
8.0% (112,973)
Number of households with income $50k - 60k:
Huntington:
0.0% (0)
State:
8.3% (117,156)
Number of households with income $60k - 75k:
Huntington:
13.5% (7)
Texas:
10.4% (147,462)
Number of households with income $75k - 100k:
Huntington:
3.8% (2)
State:
11.5% (162,718)
Number of households with income $100k - 125k:
Huntington:
21.2% (11)
State:
8.2% (115,829)
Number of households with income $125k - 150k:
Huntington:
0.0% (0)
State:
4.9% (69,556)
Number of households with income $150k - 200k:
Huntington:
17.3% (9)
Texas:
6.4% (90,701)
Number of households with income > $200k:
Huntington:
0.0% (0)
State:
5.5% (77,988)
Aggregate household income in Huntington in 2022: $3,480,163
Median per capita income in Huntington in 2022:
Huntington:
$43,619
Texas:
$30,490
Income statistics for Asian residents
Aggregate household income in Huntington in 2022: $1,214,357
Median per capita income in Huntington in 2022:
Huntington:
$31,800
Texas:
$48,626
Change in median per capita income between 2000 and 2022:
Huntington, Texas:
+127.1%
Texas:
+132.0%
Income statistics for Hispanic or Latino residents
Aggregate household income in Huntington in 2022: $1,905,444
Median per capita income in Huntington in 2022:
Huntington:
$11,562
State:
$24,862
Change in median per capita income between 2000 and 2022:
Huntington, Texas:
+86.0%
State:
+130.8%
Income statistics for Multirace residents
Median household income in Huntington, TX in 2022:
Huntington:
$16,179
Texas:
$62,748
Change in median household income between 2000 and 2022:: -48.2%
Huntington, Texas:
-48.2%
State:
+92.3%
Number of households with income < $10k:
Huntington:
0.0% (0)
State:
5.5% (122,324)
Number of households with income $10k - 20k:
Huntington:
84.2% (85)
Texas:
8.2% (182,232)
Number of households with income $20k - 30k:
Huntington:
0.0% (0)
State:
8.5% (189,456)
Number of households with income $30k - 40k:
Huntington:
15.8% (16)
State:
8.9% (197,499)
Number of households with income $40k - 50k:
Huntington:
0.0% (0)
Texas:
8.7% (191,735)
Number of households with income $50k - 60k:
Huntington:
0.0% (0)
State:
8.0% (177,535)
Number of households with income $60k - 75k:
Huntington:
0.0% (0)
Texas:
10.5% (232,479)
Number of households with income $75k - 100k:
Huntington:
0.0% (0)
State:
13.1% (290,448)
Number of households with income $100k - 125k:
Huntington:
0.0% (0)
State:
8.6% (191,595)
Number of households with income $125k - 150k:
Huntington:
0.0% (0)
Texas:
6.0% (133,361)
Number of households with income $150k - 200k:
Huntington:
0.0% (0)
State:
7.2% (159,195)
Number of households with income > $200k:
Huntington:
0.0% (0)
State:
6.7% (148,064)
Aggregate household income in Huntington in 2022: $2,328,244
Median non-family income in Huntington in 2022:
Huntington:
$32,857
Texas:
$40,634
Median per capita income in Huntington in 2022:
Huntington:
$17,381
State:
$26,785
Discuss Huntington, Texas (TX) on our hugely popular Texas forum.