The median household income in Hunters Creek Village, TX in 2022 was $242,644, which was 70.2% greater than the median annual income of $72,284 across the entire state of Texas. Compared to the median income of $171,294 in 2000 this represents an increase of 29.4%. The per capita income in 2022 was $176,562, which means an increase of 49.7% compared to 2000 when it was $88,821.
Whole page based on the data from 2000 / 2022 when the population of Hunters Creek Village, Texas was 4,374 / 4,434
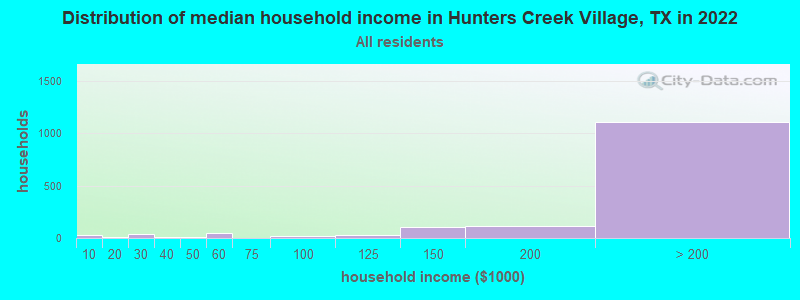
Income statistics for all residents
Median household income in Hunters Creek Village, TX in 2022:
Hunters Creek Village:
$242,645
State:
$72,284
Change in median household income between 2000 and 2022:
Hunters Creek Village, Texas:
+41.7%
Texas:
+81.0%
Number of households with income < $10k:
Hunters Creek Village:
1.9% (29)
State:
5.5% (611,011)
Number of households with income $10k - 20k:
Hunters Creek Village:
0.6% (9)
State:
6.7% (743,157)
Number of households with income $20k - 30k:
Hunters Creek Village:
2.5% (37)
State:
7.2% (803,381)
Number of households with income $30k - 40k:
Hunters Creek Village:
0.4% (6)
Texas:
7.8% (866,080)
Number of households with income $40k - 50k:
Hunters Creek Village:
0.4% (6)
State:
7.3% (810,440)
Number of households with income $50k - 60k:
Hunters Creek Village:
3.3% (50)
Texas:
7.2% (799,783)
Number of households with income $60k - 75k:
Hunters Creek Village:
0.0% (0)
Texas:
9.9% (1,095,384)
Number of households with income $75k - 100k:
Hunters Creek Village:
1.1% (16)
Texas:
12.8% (1,419,057)
Number of households with income $100k - 125k:
Hunters Creek Village:
1.9% (29)
State:
9.5% (1,054,577)
Number of households with income $125k - 150k:
Hunters Creek Village:
6.8% (102)
State:
6.7% (741,518)
Number of households with income $150k - 200k:
Hunters Creek Village:
7.6% (114)
State:
8.7% (961,776)
Number of households with income > $200k:
Hunters Creek Village:
73.6% (1,108)
State:
10.7% (1,181,544)
Aggregate household income in Hunters Creek Village in 2022: $787,079,368
Median family income in Hunters Creek Village in 2022:
Hunters Creek Village:
$239,705
State:
$86,267
Number of families with income < $10k:
Hunters Creek Village:
2.1% (27)
State:
4.0% (297,884)
Number of families with income $20k - 30k:
Hunters Creek Village:
1.4% (18)
State:
5.8% (430,949)
Number of families with income $40k - 50k:
Hunters Creek Village:
0.5% (6)
State:
6.7% (499,663)
Number of families with income $50k - 60k:
Hunters Creek Village:
2.9% (37)
Texas:
6.6% (492,203)
Number of families with income $100k - 125k:
Hunters Creek Village:
2.2% (29)
Texas:
10.7% (797,961)
Number of families with income $125k - 150k:
Hunters Creek Village:
6.7% (86)
Texas:
8.1% (602,985)
Number of families with income $150k - 200k:
Hunters Creek Village:
8.5% (109)
State:
10.7% (804,459)
Number of families with income > $200k:
Hunters Creek Village:
75.6% (968)
State:
13.5% (1,013,514)
Median non-family income in Hunters Creek Village in 2022:
Hunters Creek Village:
$256,507
Texas:
$45,999
Median per capita income in Hunters Creek Village in 2022:
Hunters Creek Village:
$176,563
Texas:
$38,123
Change in median per capita income between 2000 and 2022:
Hunters Creek Village, Texas:
+98.8%
State:
+94.3%
Income statistics for White residents
Median household income in Hunters Creek Village, TX in 2022:
Hunters Creek Village:
$252,799
Texas:
$82,032
Change in median household income between 2000 and 2022:
Hunters Creek Village, Texas:
+40.7%
State:
+91.0%
Number of households with income < $10k:
Hunters Creek Village:
2.2% (25)
Texas:
4.7% (273,716)
Number of households with income $10k - 20k:
Hunters Creek Village:
0.5% (6)
Texas:
5.5% (322,702)
Number of households with income $20k - 30k:
Hunters Creek Village:
2.3% (26)
Texas:
6.2% (363,947)
Number of households with income $30k - 40k:
Hunters Creek Village:
0.4% (5)
State:
6.8% (399,275)
Number of households with income $40k - 50k:
Hunters Creek Village:
0.3% (4)
State:
6.5% (383,417)
Number of households with income $50k - 60k:
Hunters Creek Village:
2.1% (24)
State:
6.6% (388,535)
Number of households with income $60k - 75k:
Hunters Creek Village:
0.0% (0)
Texas:
9.7% (566,295)
Number of households with income $75k - 100k:
Hunters Creek Village:
1.0% (12)
State:
13.0% (760,276)
Number of households with income $100k - 125k:
Hunters Creek Village:
1.9% (22)
Texas:
10.2% (597,596)
Number of households with income $125k - 150k:
Hunters Creek Village:
7.6% (87)
State:
7.4% (436,830)
Number of households with income $150k - 200k:
Hunters Creek Village:
7.5% (86)
Texas:
9.9% (583,067)
Number of households with income > $200k:
Hunters Creek Village:
74.1% (851)
Texas:
13.5% (792,647)
Aggregate household income in Hunters Creek Village in 2022: $608,472,882
Median family income in Hunters Creek Village in 2022:
Hunters Creek Village:
$267,282
State:
$101,788
Number of families with income < $10k:
Hunters Creek Village:
1.6% (16)
State:
2.8% (108,142)
Number of families with income $20k - 30k:
Hunters Creek Village:
0.9% (9)
Texas:
4.1% (157,688)
Number of families with income $40k - 50k:
Hunters Creek Village:
0.3% (3)
Texas:
5.6% (216,490)
Number of families with income $50k - 60k:
Hunters Creek Village:
1.4% (15)
Texas:
5.7% (220,689)
Number of families with income $100k - 125k:
Hunters Creek Village:
2.1% (21)
State:
11.6% (448,411)
Number of families with income $125k - 150k:
Hunters Creek Village:
7.1% (73)
State:
9.2% (355,798)
Number of families with income $150k - 200k:
Hunters Creek Village:
8.0% (82)
State:
12.5% (480,185)
Number of families with income > $200k:
Hunters Creek Village:
78.5% (804)
State:
17.6% (677,490)
Median per capita income in Hunters Creek Village in 2022:
Hunters Creek Village:
$202,190
Texas:
$47,740
Change in median per capita income between 2000 and 2022:
Hunters Creek Village, Texas:
+120.0%
Texas:
+114.3%
Income statistics for Asian residents
Number of households with income < $10k:
Hunters Creek Village:
0.0% (0)
State:
5.2% (29,885)
Number of households with income $10k - 20k:
Hunters Creek Village:
0.0% (0)
State:
4.7% (27,044)
Number of households with income $20k - 30k:
Hunters Creek Village:
0.0% (0)
Texas:
4.1% (23,363)
Number of households with income $30k - 40k:
Hunters Creek Village:
0.0% (0)
State:
4.1% (23,309)
Number of households with income $40k - 50k:
Hunters Creek Village:
0.0% (0)
State:
5.2% (29,826)
Number of households with income $50k - 60k:
Hunters Creek Village:
0.0% (0)
State:
4.7% (26,512)
Number of households with income $60k - 75k:
Hunters Creek Village:
0.0% (0)
Texas:
6.5% (36,905)
Number of households with income $75k - 100k:
Hunters Creek Village:
0.0% (0)
State:
11.3% (64,350)
Number of households with income $100k - 125k:
Hunters Creek Village:
0.0% (0)
State:
11.4% (64,714)
Number of households with income $125k - 150k:
Hunters Creek Village:
0.0% (0)
State:
9.3% (52,719)
Number of households with income $150k - 200k:
Hunters Creek Village:
0.0% (0)
State:
12.5% (70,953)
Number of households with income > $200k:
Hunters Creek Village:
100.0% (24)
State:
21.1% (120,260)
Aggregate household income in Hunters Creek Village in 2022: $70,485,544
Median per capita income in Hunters Creek Village in 2022:
Hunters Creek Village:
$183,351
State:
$48,626
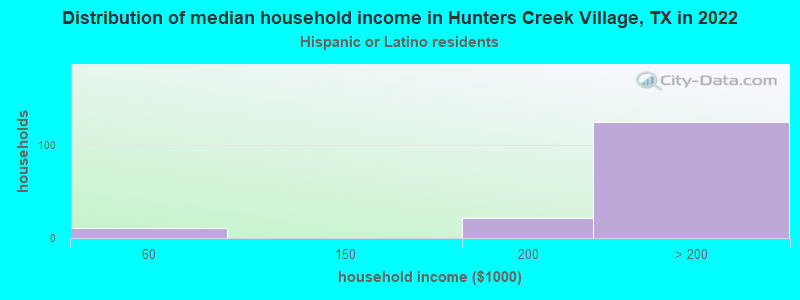
Income statistics for Hispanic or Latino residents
Median household income in Hunters Creek Village, TX in 2022:
Hunters Creek Village:
$247,748
State:
$60,504
Change in median household income between 2000 and 2022:
Hunters Creek Village, Texas:
+23.9%
State:
+102.5%
Number of households with income < $10k:
Hunters Creek Village:
0.0% (0)
State:
5.8% (213,953)
Number of households with income $10k - 20k:
Hunters Creek Village:
0.0% (0)
State:
8.0% (297,456)
Number of households with income $20k - 30k:
Hunters Creek Village:
0.0% (0)
State:
9.2% (340,166)
Number of households with income $30k - 40k:
Hunters Creek Village:
0.0% (0)
State:
9.5% (354,336)
Number of households with income $40k - 50k:
Hunters Creek Village:
0.0% (0)
Texas:
8.8% (327,013)
Number of households with income $50k - 60k:
Hunters Creek Village:
7.0% (11)
State:
8.3% (308,818)
Number of households with income $60k - 75k:
Hunters Creek Village:
0.0% (0)
State:
10.9% (405,109)
Number of households with income $75k - 100k:
Hunters Creek Village:
0.0% (0)
Texas:
13.8% (511,639)
Number of households with income $100k - 125k:
Hunters Creek Village:
0.0% (0)
State:
8.6% (319,728)
Number of households with income $125k - 150k:
Hunters Creek Village:
0.0% (0)
State:
5.7% (210,932)
Number of households with income $150k - 200k:
Hunters Creek Village:
13.9% (22)
State:
6.4% (236,055)
Number of households with income > $200k:
Hunters Creek Village:
79.1% (125)
Texas:
5.1% (189,259)
Aggregate household income in Hunters Creek Village in 2022: $62,157,322
Median family income in Hunters Creek Village in 2022:
Hunters Creek Village:
$243,707
State:
$65,080
Number of families with income $150k - 200k:
Hunters Creek Village:
36.7% (22)
Texas:
7.3% (202,259)
Number of families with income > $200k:
Hunters Creek Village:
63.3% (37)
Texas:
5.9% (165,129)
Median per capita income in Hunters Creek Village in 2022:
Hunters Creek Village:
$232,329
Texas:
$24,862
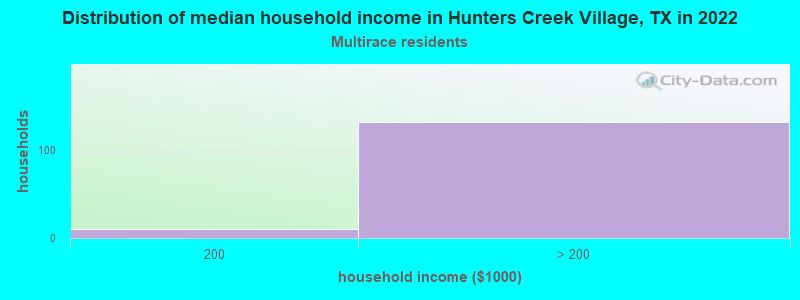
Income statistics for Multirace residents
Number of households with income < $10k:
Hunters Creek Village:
0.0% (0)
State:
5.5% (122,324)
Number of households with income $10k - 20k:
Hunters Creek Village:
0.0% (0)
State:
8.2% (182,232)
Number of households with income $20k - 30k:
Hunters Creek Village:
0.0% (0)
Texas:
8.5% (189,456)
Number of households with income $30k - 40k:
Hunters Creek Village:
0.0% (0)
State:
8.9% (197,499)
Number of households with income $40k - 50k:
Hunters Creek Village:
0.0% (0)
State:
8.7% (191,735)
Number of households with income $50k - 60k:
Hunters Creek Village:
0.0% (0)
Texas:
8.0% (177,535)
Number of households with income $60k - 75k:
Hunters Creek Village:
0.0% (0)
State:
10.5% (232,479)
Number of households with income $75k - 100k:
Hunters Creek Village:
0.0% (0)
State:
13.1% (290,448)
Number of households with income $100k - 125k:
Hunters Creek Village:
0.0% (0)
Texas:
8.6% (191,595)
Number of households with income $125k - 150k:
Hunters Creek Village:
0.0% (0)
State:
6.0% (133,361)
Number of households with income $150k - 200k:
Hunters Creek Village:
7.0% (10)
Texas:
7.2% (159,195)
Number of households with income > $200k:
Hunters Creek Village:
93.0% (132)
State:
6.7% (148,064)
Aggregate household income in Hunters Creek Village in 2022: $18,853,746
Median per capita income in Hunters Creek Village in 2022:
Hunters Creek Village:
$208,584
State:
$26,785
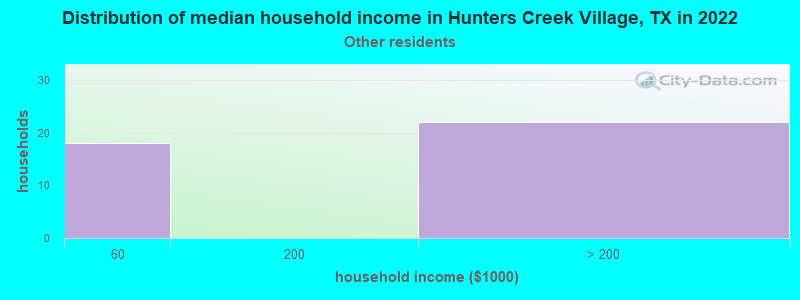
Income statistics for other residents
Number of households with income < $10k:
Hunters Creek Village:
0.0% (0)
Texas:
5.9% (54,162)
Number of households with income $10k - 20k:
Hunters Creek Village:
0.0% (0)
State:
6.8% (62,891)
Number of households with income $20k - 30k:
Hunters Creek Village:
0.0% (0)
State:
10.6% (97,294)
Number of households with income $30k - 40k:
Hunters Creek Village:
0.0% (0)
Texas:
10.8% (99,670)
Number of households with income $40k - 50k:
Hunters Creek Village:
0.0% (0)
State:
9.3% (85,548)
Number of households with income $50k - 60k:
Hunters Creek Village:
45.0% (18)
State:
9.0% (82,757)
Number of households with income $60k - 75k:
Hunters Creek Village:
0.0% (0)
Texas:
10.9% (100,326)
Number of households with income $75k - 100k:
Hunters Creek Village:
0.0% (0)
State:
14.0% (128,767)
Number of households with income $100k - 125k:
Hunters Creek Village:
0.0% (0)
State:
8.2% (75,218)
Number of households with income $125k - 150k:
Hunters Creek Village:
0.0% (0)
State:
4.8% (44,223)
Number of households with income $150k - 200k:
Hunters Creek Village:
0.0% (0)
State:
5.6% (51,376)
Number of households with income > $200k:
Hunters Creek Village:
55.0% (22)
State:
4.0% (36,393)
Aggregate household income in Hunters Creek Village in 2022: $10,265,021
Median per capita income in Hunters Creek Village in 2022:
Hunters Creek Village:
$201,338
State:
$23,899
Discuss Hunters Creek Village, Texas (TX) on our hugely popular Texas forum.