Holliston, Massachusetts (MA) income map, earnings map, and wages data
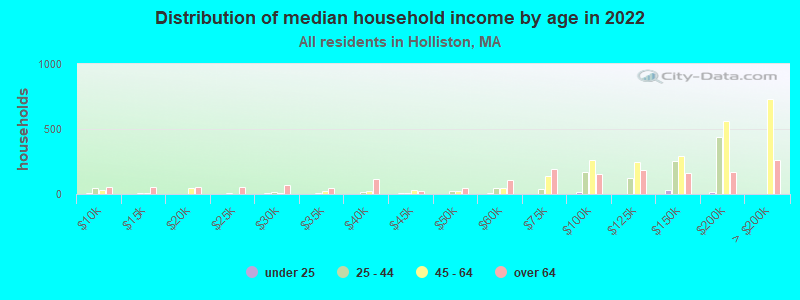
The median household income in Holliston, MA in 2022 was $152,534, which was 38.1% greater than the median annual income of $94,488 across the entire state of Massachusetts. Compared to the median income of $78,092 in 2000 this represents an increase of 48.8%. The per capita income in 2022 was $66,678, which means an increase of 51.8% compared to 2000 when it was $32,116.
Income statistics for all residents
Median household income in Holliston, MA in 2022:| Holliston: | $152,535 |
| Massachusetts: | $94,488 |
Change in median household income between 2000 and 2022:| Holliston, Massachusetts: | +95.3% |
| State: | +87.1% |
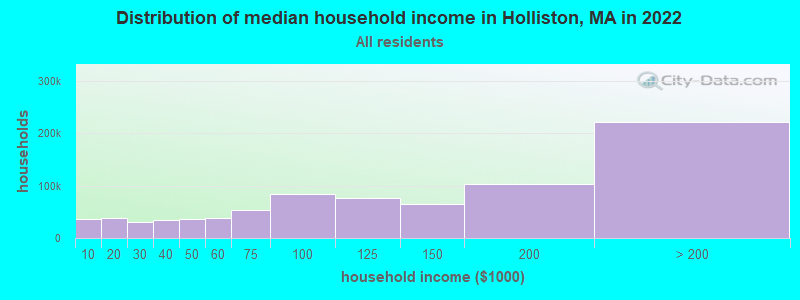
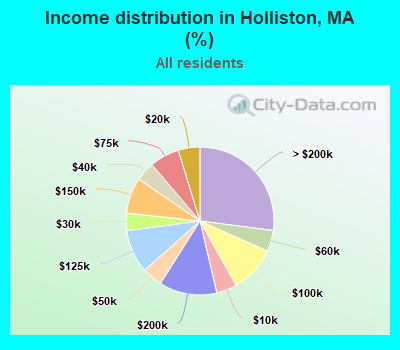
Number of households with income < $10k:| Holliston: | 4.5% (36,658) |
| Massachusetts: | 5.2% (146,170) |
Number of households with income $10k - 20k:| Holliston: | 4.7% (38,777) |
| State: | 6.4% (180,001) |
Number of households with income $20k - 30k:| Holliston: | 3.8% (31,042) |
| Massachusetts: | 5.6% (156,667) |
Number of households with income $30k - 40k:| Holliston: | 4.2% (34,412) |
| State: | 5.6% (157,168) |
Number of households with income $40k - 50k:| Holliston: | 4.5% (36,661) |
| State: | 5.4% (151,455) |
Number of households with income $50k - 60k:| Holliston: | 4.6% (38,080) |
| Massachusetts: | 5.1% (142,726) |
Number of households with income $60k - 75k:| Holliston: | 6.5% (53,282) |
| State: | 7.6% (212,203) |
Number of households with income $75k - 100k:| Holliston: | 10.2% (83,405) |
| State: | 11.3% (317,064) |
Number of households with income $100k - 125k:| Holliston: | 9.4% (77,368) |
| State: | 9.7% (270,603) |
Number of households with income $125k - 150k:| Holliston: | 7.9% (64,443) |
| Massachusetts: | 8.0% (223,140) |
Number of households with income $150k - 200k:| Holliston: | 12.6% (103,520) |
| Massachusetts: | 11.0% (308,695) |
Number of households with income > $200k:| Holliston: | 27.1% (221,800) |
| State: | 19.0% (531,884) |
Aggregate household income in Holliston in 2022: $21,653,780,127
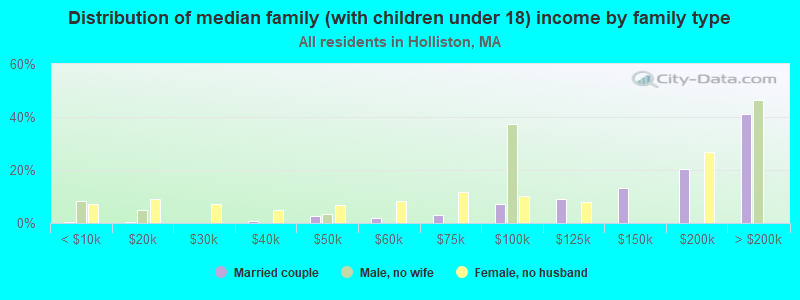
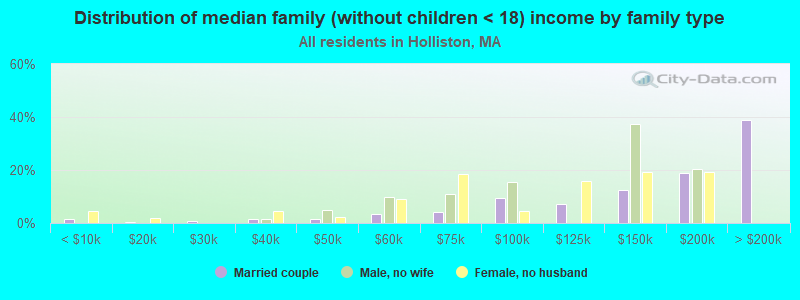
Median family income in Holliston in 2022:| Holliston: | $172,667 |
| State: | $120,263 |
Median non-family income in Holliston in 2022:| Holliston: | $61,907 |
| State: | $55,979 |
Change in median non-family income between 2000 and 2022:| Holliston, Massachusetts: | +94.2% |
| State: | +88.0% |
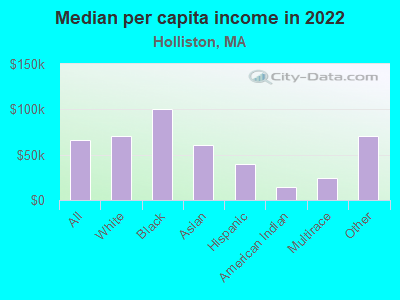
Median per capita income in Holliston in 2022:| Holliston: | $66,679 |
| Massachusetts: | $54,025 |
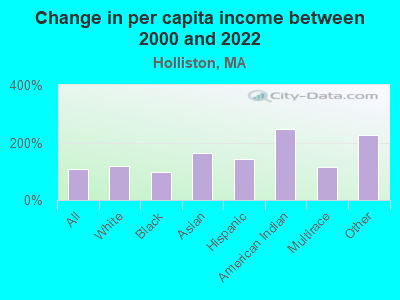
Change in median per capita income between 2000 and 2022:| Holliston, Massachusetts: | +107.6% |
| State: | +108.2% |
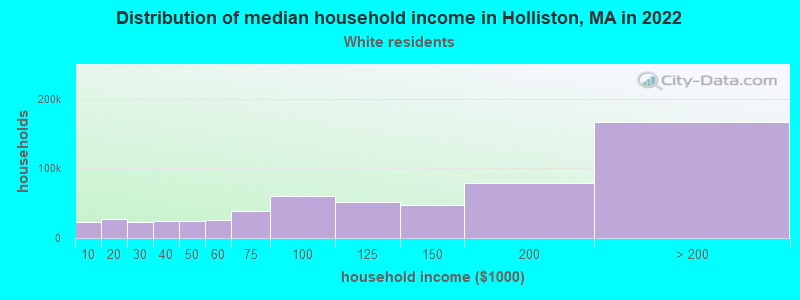
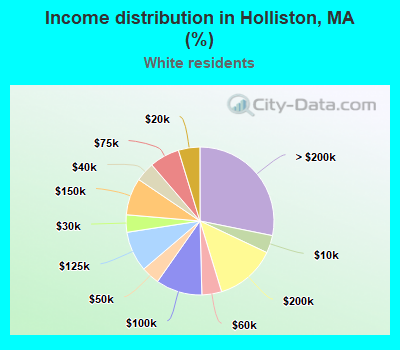
Income statistics for White residents
Median household income in Holliston, MA in 2022:| Holliston: | $156,318 |
| State: | $101,391 |
Change in median household income between 2000 and 2022:| Holliston, Massachusetts: | +98.2% |
| State: | +93.3% |
Number of households with income < $10k:| Holliston: | 3.9% (22,821) |
| State: | 4.4% (91,120) |
Number of households with income $10k - 20k:| Holliston: | 4.7% (27,820) |
| State: | 5.9% (122,055) |
Number of households with income $20k - 30k:| Holliston: | 3.8% (22,450) |
| Massachusetts: | 5.1% (105,311) |
Number of households with income $30k - 40k:| Holliston: | 4.2% (25,028) |
| State: | 5.3% (110,239) |
Number of households with income $40k - 50k:| Holliston: | 4.0% (23,771) |
| State: | 5.0% (104,636) |
Number of households with income $50k - 60k:| Holliston: | 4.3% (25,539) |
| Massachusetts: | 4.8% (99,486) |
Number of households with income $60k - 75k:| Holliston: | 6.6% (38,921) |
| State: | 7.5% (155,124) |
Number of households with income $75k - 100k:| Holliston: | 10.1% (59,903) |
| State: | 11.4% (236,252) |
Number of households with income $100k - 125k:| Holliston: | 8.8% (52,014) |
| Massachusetts: | 9.9% (204,731) |
Number of households with income $125k - 150k:| Holliston: | 8.1% (48,041) |
| State: | 8.5% (175,324) |
Number of households with income $150k - 200k:| Holliston: | 13.2% (78,314) |
| State: | 11.7% (242,980) |
Number of households with income > $200k:| Holliston: | 28.2% (166,614) |
| State: | 20.5% (425,966) |
Aggregate household income in Holliston in 2022: $15,973,826,650
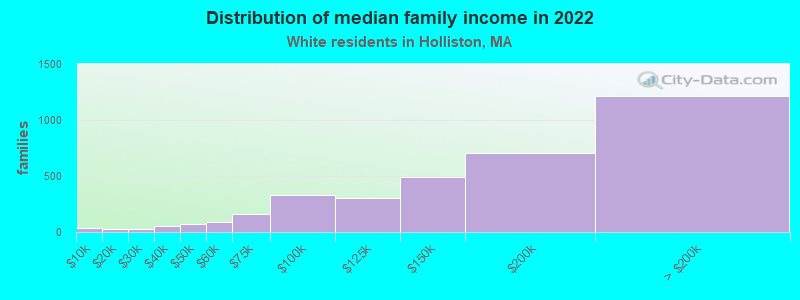
Median family income in Holliston in 2022:| Holliston: | $183,599 |
| State: | $133,153 |
Number of families with income < $10k:| Holliston: | 1.1% (37) |
| Massachusetts: | 2.0% (25,038) |
Number of families with income $10k - 20k:| Holliston: | 0.9% (30) |
| State: | 2.1% (26,403) |
Number of families with income $20k - 30k:| Holliston: | 0.8% (27) |
| Massachusetts: | 2.6% (32,525) |
Number of families with income $30k - 40k:| Holliston: | 1.6% (55) |
| State: | 3.9% (48,079) |
Number of families with income $40k - 50k:| Holliston: | 2.0% (69) |
| State: | 3.8% (46,908) |
Number of families with income $50k - 60k:| Holliston: | 2.5% (86) |
| State: | 3.8% (46,476) |
Number of families with income $60k - 75k:| Holliston: | 4.6% (163) |
| Massachusetts: | 6.4% (79,040) |
Number of families with income $75k - 100k:| Holliston: | 9.3% (328) |
| State: | 11.1% (137,395) |
Number of families with income $100k - 125k:| Holliston: | 8.7% (306) |
| State: | 11.1% (136,771) |
Number of families with income $125k - 150k:| Holliston: | 14.0% (493) |
| Massachusetts: | 10.0% (123,709) |
Number of families with income $150k - 200k:| Holliston: | 20.1% (706) |
| State: | 14.7% (181,602) |
Number of families with income > $200k:| Holliston: | 34.5% (1,211) |
| State: | 28.5% (351,887) |
Median non-family income in Holliston in 2022:| Holliston: | $60,386 |
| Massachusetts: | $59,323 |
Change in median non-family income between 2000 and 2022:| Holliston, Massachusetts: | +90.7% |
| Massachusetts: | +94.3% |
Median per capita income in Holliston in 2022:| Holliston: | $70,898 |
| State: | $60,804 |
Change in median per capita income between 2000 and 2022:| Holliston, Massachusetts: | +117.3% |
| State: | +118.7% |
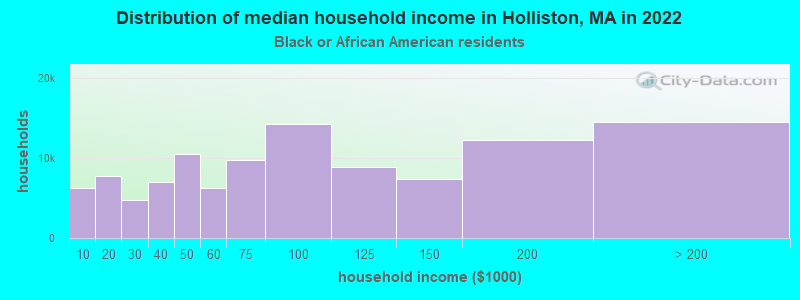
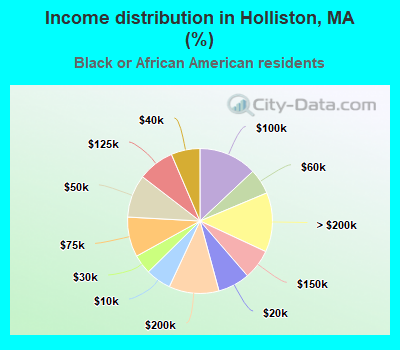
Income statistics for Black or African American residents
Median household income in Holliston, MA in 2022:| Holliston: | $328,563 |
| State: | $63,189 |
Change in median household income between 2000 and 2022:| Holliston, Massachusetts: | +92.0% |
| State: | +87.4% |
Number of households with income < $10k:| Holliston: | 5.7% (6,209) |
| State: | 9.1% (15,797) |
Number of households with income $10k - 20k:| Holliston: | 7.1% (7,792) |
| Massachusetts: | 9.4% (16,267) |
Number of households with income $20k - 30k:| Holliston: | 4.3% (4,735) |
| Massachusetts: | 7.8% (13,520) |
Number of households with income $30k - 40k:| Holliston: | 6.4% (7,052) |
| State: | 8.3% (14,412) |
Number of households with income $40k - 50k:| Holliston: | 9.6% (10,484) |
| Massachusetts: | 7.9% (13,790) |
Number of households with income $50k - 60k:| Holliston: | 5.7% (6,234) |
| Massachusetts: | 5.8% (10,041) |
Number of households with income $60k - 75k:| Holliston: | 8.9% (9,770) |
| State: | 8.5% (14,822) |
Number of households with income $75k - 100k:| Holliston: | 13.0% (14,226) |
| Massachusetts: | 11.0% (19,122) |
Number of households with income $100k - 125k:| Holliston: | 8.1% (8,881) |
| State: | 8.4% (14,575) |
Number of households with income $125k - 150k:| Holliston: | 6.7% (7,357) |
| State: | 6.0% (10,429) |
Number of households with income $150k - 200k:| Holliston: | 11.2% (12,242) |
| Massachusetts: | 7.2% (12,539) |
Number of households with income > $200k:| Holliston: | 13.3% (14,518) |
| State: | 10.5% (18,185) |
Aggregate household income in Holliston in 2022: $6,559,974
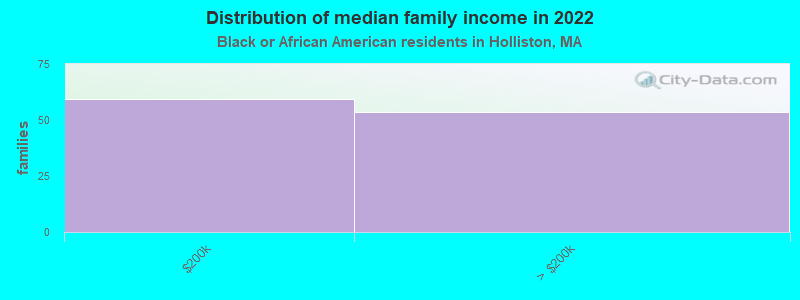
Median family income in Holliston in 2022:| Holliston: | $396,002 |
| State: | $79,815 |
Number of families with income $150k - 200k:| Holliston: | 52.6% (59) |
| Massachusetts: | 9.3% (10,230) |
Number of families with income > $200k:| Holliston: | 47.4% (53) |
| Massachusetts: | 12.9% (14,108) |
Median per capita income in Holliston in 2022:| Holliston: | $100,380 |
| State: | $33,524 |
Change in median per capita income between 2000 and 2022:| Holliston, Massachusetts: | +98.1% |
| Massachusetts: | +109.4% |
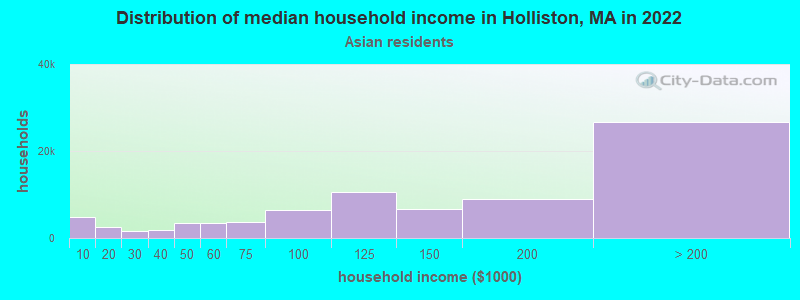
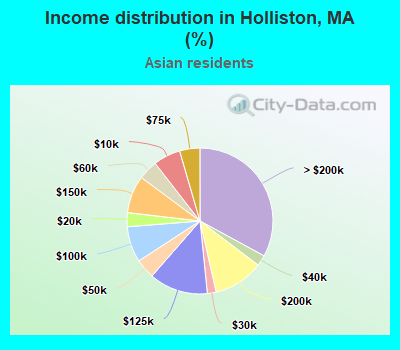
Income statistics for Asian residents
Median household income in Holliston, MA in 2022:| Holliston: | $137,557 |
| State: | $117,855 |
Change in median household income between 2000 and 2022:| Holliston, Massachusetts: | +108.1% |
| State: | +129.9% |
Number of households with income < $10k:| Holliston: | 6.0% (4,883) |
| Massachusetts: | 6.8% (11,982) |
Number of households with income $10k - 20k:| Holliston: | 3.1% (2,520) |
| Massachusetts: | 4.8% (8,376) |
Number of households with income $20k - 30k:| Holliston: | 1.9% (1,580) |
| State: | 3.7% (6,558) |
Number of households with income $30k - 40k:| Holliston: | 2.4% (1,944) |
| State: | 3.3% (5,748) |
Number of households with income $40k - 50k:| Holliston: | 4.4% (3,550) |
| State: | 4.1% (7,192) |
Number of households with income $50k - 60k:| Holliston: | 4.3% (3,505) |
| Massachusetts: | 5.0% (8,734) |
Number of households with income $60k - 75k:| Holliston: | 4.5% (3,648) |
| State: | 5.8% (10,203) |
Number of households with income $75k - 100k:| Holliston: | 7.9% (6,446) |
| Massachusetts: | 8.6% (15,154) |
Number of households with income $100k - 125k:| Holliston: | 13.0% (10,570) |
| State: | 10.8% (18,942) |
Number of households with income $125k - 150k:| Holliston: | 8.3% (6,746) |
| State: | 8.0% (14,037) |
Number of households with income $150k - 200k:| Holliston: | 11.1% (9,027) |
| State: | 12.5% (21,856) |
Number of households with income > $200k:| Holliston: | 32.9% (26,724) |
| State: | 26.6% (46,694) |
Aggregate household income in Holliston in 2022: $20,011,103
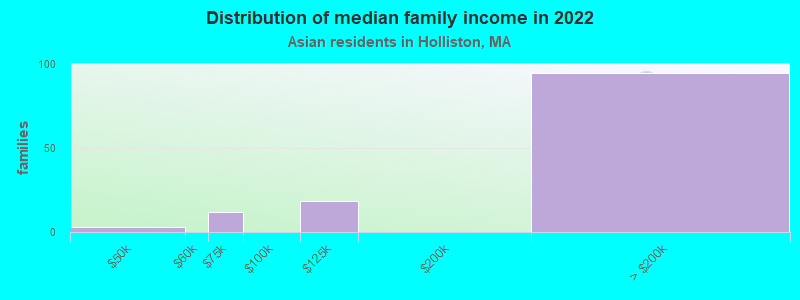
Median family income in Holliston in 2022:| Holliston: | $147,834 |
| State: | $140,113 |
Number of families with income $40k - 50k:| Holliston: | 2.4% (3) |
| State: | 3.9% (4,621) |
Number of families with income $60k - 75k:| Holliston: | 9.2% (12) |
| Massachusetts: | 6.1% (7,105) |
Number of families with income $100k - 125k:| Holliston: | 14.2% (18) |
| State: | 10.0% (11,697) |
Number of families with income > $200k:| Holliston: | 74.1% (94) |
| State: | 34.0% (39,856) |
Median non-family income in Holliston in 2022:| Holliston: | $129,164 |
| State: | $71,440 |
Change in median non-family income between 2000 and 2022:| Holliston, Massachusetts: | +119.9% |
| State: | +128.0% |
Median per capita income in Holliston in 2022:| Holliston: | $60,858 |
| Massachusetts: | $58,900 |
Income statistics for Hispanic or Latino residents
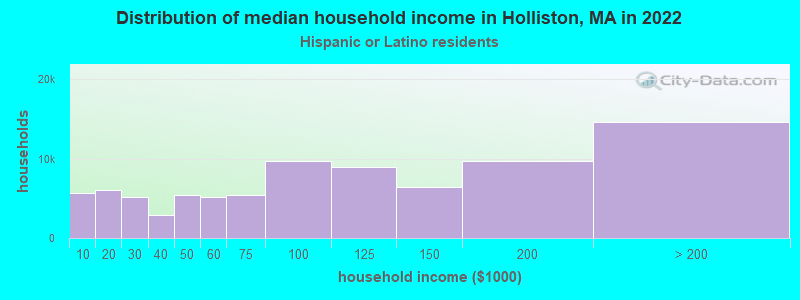
Median household income in Holliston, MA in 2022:| Holliston: | $186,756 |
| State: | $61,523 |
Change in median household income between 2000 and 2022:| Holliston, Massachusetts: | +138.1% |
| State: | +125.4% |
Number of households with income < $10k:| Holliston: | 6.6% (5,618) |
| Massachusetts: | 8.8% (25,307) |
Number of households with income $10k - 20k:| Holliston: | 7.1% (6,006) |
| State: | 10.0% (28,653) |
Number of households with income $20k - 30k:| Holliston: | 6.0% (5,138) |
| State: | 8.8% (25,189) |
Number of households with income $30k - 40k:| Holliston: | 3.4% (2,881) |
| Massachusetts: | 7.2% (20,822) |
Number of households with income $40k - 50k:| Holliston: | 6.4% (5,432) |
| State: | 7.2% (20,817) |
Number of households with income $50k - 60k:| Holliston: | 6.1% (5,228) |
| Massachusetts: | 6.5% (18,748) |
Number of households with income $60k - 75k:| Holliston: | 6.3% (5,364) |
| State: | 8.8% (25,390) |
Number of households with income $75k - 100k:| Holliston: | 11.4% (9,728) |
| Massachusetts: | 12.0% (34,488) |
Number of households with income $100k - 125k:| Holliston: | 10.6% (9,011) |
| State: | 8.6% (24,599) |
Number of households with income $125k - 150k:| Holliston: | 7.5% (6,380) |
| Massachusetts: | 6.2% (17,743) |
Number of households with income $150k - 200k:| Holliston: | 11.4% (9,699) |
| State: | 7.3% (21,017) |
Number of households with income > $200k:| Holliston: | 17.2% (14,632) |
| State: | 8.6% (24,606) |
Aggregate household income in Holliston in 2022: $24,185,475
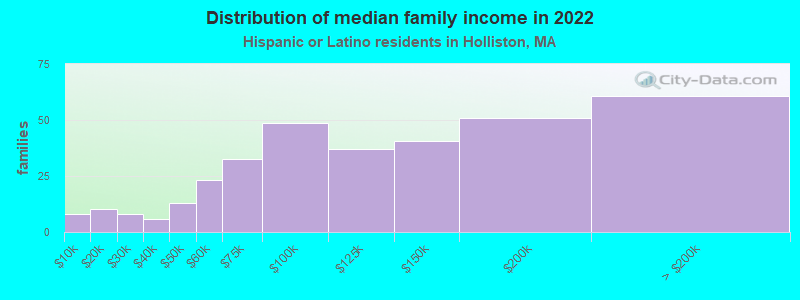
Median family income in Holliston in 2022:| Holliston: | $178,231 |
| Massachusetts: | $66,072 |
Number of families with income < $10k:| Holliston: | 2.3% (8) |
| State: | 6.2% (12,456) |
Number of families with income $10k - 20k:| Holliston: | 3.0% (10) |
| State: | 6.0% (12,071) |
Number of families with income $20k - 30k:| Holliston: | 2.4% (8) |
| Massachusetts: | 10.1% (20,376) |
Number of families with income $30k - 40k:| Holliston: | 1.7% (6) |
| Massachusetts: | 8.2% (16,470) |
Number of families with income $40k - 50k:| Holliston: | 3.9% (13) |
| State: | 7.4% (14,829) |
Number of families with income $50k - 60k:| Holliston: | 6.9% (23) |
| State: | 7.3% (14,643) |
Number of families with income $60k - 75k:| Holliston: | 9.6% (32) |
| Massachusetts: | 10.6% (21,252) |
Number of families with income $75k - 100k:| Holliston: | 14.3% (49) |
| Massachusetts: | 12.0% (24,088) |
Number of families with income $100k - 125k:| Holliston: | 11.0% (37) |
| State: | 8.9% (17,954) |
Number of families with income $125k - 150k:| Holliston: | 12.0% (41) |
| State: | 6.9% (13,837) |
Number of families with income $150k - 200k:| Holliston: | 15.0% (51) |
| State: | 7.3% (14,683) |
Number of families with income > $200k:| Holliston: | 18.0% (61) |
| Massachusetts: | 9.3% (18,741) |
Median non-family income in Holliston in 2022:| Holliston: | $180,188 |
| State: | $37,563 |
Change in median non-family income between 2000 and 2022:| Holliston, Massachusetts: | +98.1% |
| State: | +115.0% |
Median per capita income in Holliston in 2022:| Holliston: | $39,575 |
| Massachusetts: | $28,993 |
Change in median per capita income between 2000 and 2022:| Holliston, Massachusetts: | +142.9% |
| State: | +142.4% |
Income statistics for American Indian and Alaska Native residents
Number of households with income < $10k:| Holliston: | 6.6% (114) |
| State: | 6.6% (451) |
Number of households with income $10k - 20k:| Holliston: | 7.0% (120) |
| State: | 7.0% (476) |
Number of households with income $20k - 30k:| Holliston: | 2.8% (48) |
| State: | 2.8% (192) |
Number of households with income $30k - 40k:| Holliston: | 3.2% (55) |
| Massachusetts: | 3.2% (218) |
Number of households with income $40k - 50k:| Holliston: | 2.9% (50) |
| Massachusetts: | 2.9% (199) |
Number of households with income $50k - 60k:| Holliston: | 9.9% (170) |
| State: | 9.9% (677) |
Number of households with income $60k - 75k:| Holliston: | 11.5% (197) |
| State: | 11.5% (781) |
Number of households with income $75k - 100k:| Holliston: | 9.2% (158) |
| State: | 9.2% (629) |
Number of households with income $100k - 125k:| Holliston: | 5.9% (102) |
| State: | 6.0% (406) |
Number of households with income $125k - 150k:| Holliston: | 13.5% (232) |
| Massachusetts: | 13.5% (921) |
Number of households with income $150k - 200k:| Holliston: | 12.6% (216) |
| Massachusetts: | 12.6% (859) |
Number of households with income > $200k:| Holliston: | 14.8% (253) |
| State: | 14.7% (1,003) |
Median per capita income in Holliston in 2022:| Holliston: | $13,822 |
| Massachusetts: | $39,434 |
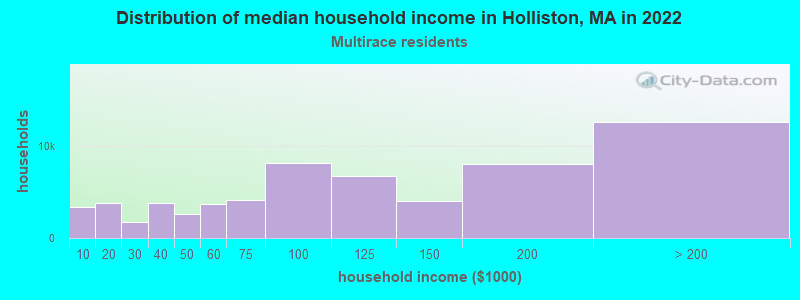
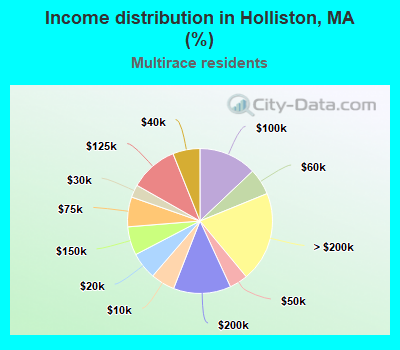
Income statistics for Multirace residents
Median household income in Holliston, MA in 2022:| Holliston: | $141,917 |
| State: | $71,552 |
Change in median household income between 2000 and 2022:| Holliston, Massachusetts: | +146.3% |
| Massachusetts: | +109.0% |
Number of households with income < $10k:| Holliston: | 5.4% (3,373) |
| Massachusetts: | 6.6% (15,127) |
Number of households with income $10k - 20k:| Holliston: | 6.0% (3,769) |
| State: | 9.2% (21,158) |
Number of households with income $20k - 30k:| Holliston: | 2.8% (1,776) |
| Massachusetts: | 7.8% (18,016) |
Number of households with income $30k - 40k:| Holliston: | 6.0% (3,787) |
| Massachusetts: | 7.9% (18,260) |
Number of households with income $40k - 50k:| Holliston: | 4.1% (2,582) |
| Massachusetts: | 5.6% (13,027) |
Number of households with income $50k - 60k:| Holliston: | 5.9% (3,695) |
| Massachusetts: | 5.6% (12,909) |
Number of households with income $60k - 75k:| Holliston: | 6.7% (4,164) |
| Massachusetts: | 9.0% (20,800) |
Number of households with income $75k - 100k:| Holliston: | 12.9% (8,102) |
| Massachusetts: | 12.1% (27,875) |
Number of households with income $100k - 125k:| Holliston: | 10.8% (6,731) |
| State: | 8.1% (18,754) |
Number of households with income $125k - 150k:| Holliston: | 6.4% (3,986) |
| State: | 6.8% (15,621) |
Number of households with income $150k - 200k:| Holliston: | 12.8% (8,031) |
| State: | 9.4% (21,618) |
Number of households with income > $200k:| Holliston: | 20.1% (12,613) |
| State: | 12.0% (27,592) |
Aggregate household income in Holliston in 2022: $28,936,974
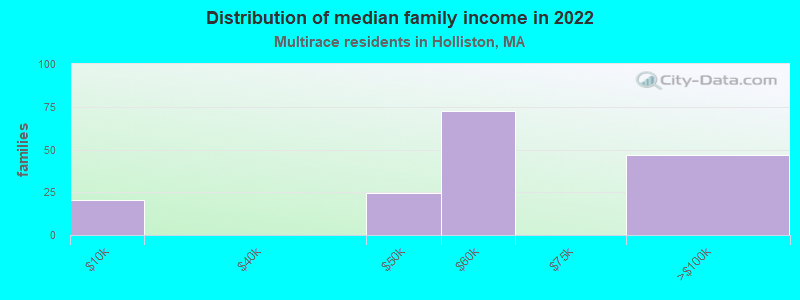
Median family income in Holliston in 2022:| Holliston: | $130,853 |
| State: | $78,380 |
Number of families with income < $10k:| Holliston: | 12.4% (20) |
| State: | 4.5% (7,017) |
Number of families with income $40k - 50k:| Holliston: | 14.8% (24) |
| State: | 5.3% (8,255) |
Number of families with income $50k - 60k:| Holliston: | 44.1% (72) |
| Massachusetts: | 6.7% (10,445) |
Number of families with income $75k - 100k:| Holliston: | 28.6% (47) |
| State: | 12.1% (18,758) |
Median per capita income in Holliston in 2022:| Holliston: | $23,811 |
| State: | $34,029 |
Change in median per capita income between 2000 and 2022:| Holliston, Massachusetts: | +116.4% |
| State: | +132.1% |
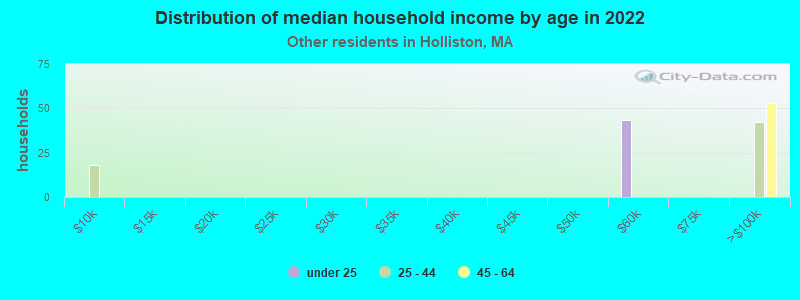
Income statistics for other residents
Number of households with income < $10k:| Holliston: | 9.2% (10) |
| State: | 8.4% (11,559) |
Number of households with income $10k - 20k:| Holliston: | 5.5% (6) |
| State: | 8.4% (11,499) |
Number of households with income $20k - 30k:| Holliston: | 11.0% (12) |
| State: | 9.5% (13,070) |
Number of households with income $30k - 40k:| Holliston: | 3.7% (4) |
| State: | 6.0% (8,291) |
Number of households with income $40k - 50k:| Holliston: | 9.2% (10) |
| State: | 9.2% (12,611) |
Number of households with income $50k - 60k:| Holliston: | 9.2% (10) |
| Massachusetts: | 7.9% (10,879) |
Number of households with income $60k - 75k:| Holliston: | 7.3% (8) |
| State: | 7.5% (10,239) |
Number of households with income $75k - 100k:| Holliston: | 10.1% (11) |
| State: | 13.1% (18,032) |
Number of households with income $100k - 125k:| Holliston: | 10.1% (11) |
| Massachusetts: | 9.6% (13,141) |
Number of households with income $125k - 150k:| Holliston: | 5.5% (6) |
| State: | 5.0% (6,808) |
Number of households with income $150k - 200k:| Holliston: | 5.5% (6) |
| Massachusetts: | 6.4% (8,843) |
Number of households with income > $200k:| Holliston: | 13.8% (15) |
| State: | 9.0% (12,396) |
Aggregate household income in Holliston in 2022: $13,580,761
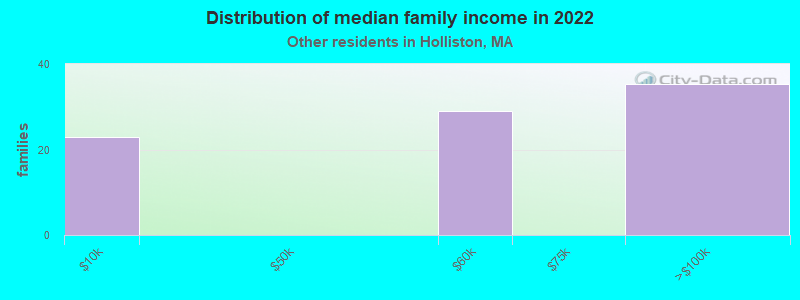
Median family income in Holliston in 2022:| Holliston: | $116,508 |
| Massachusetts: | $66,840 |
Number of families with income < $10k:| Holliston: | 26.2% (23) |
| State: | 6.7% (6,769) |
Number of families with income $50k - 60k:| Holliston: | 33.2% (29) |
| State: | 8.7% (8,850) |
Number of families with income $75k - 100k:| Holliston: | 40.6% (35) |
| State: | 12.8% (12,997) |
Median non-family income in Holliston in 2022:| Holliston: | $165,339 |
| Massachusetts: | $36,127 |
Change in median non-family income between 2000 and 2022:| Holliston, Massachusetts: | +81.8% |
| State: | +123.4% |
Median per capita income in Holliston in 2022:| Holliston: | $70,092 |
| State: | $30,797 |