The median household income in Gurley, NE in 2022 was $55,083, which was 26.3% less than the median annual income of $69,597 across the entire state of Nebraska. Compared to the median income of $30,250 in 2000 this represents an increase of 45.1%. The per capita income in 2022 was $33,891, which means an increase of 61.5% compared to 2000 when it was $13,032.
Whole page based on the data from 2000 / 2022 when the population of Gurley, Nebraska was 228 / 267
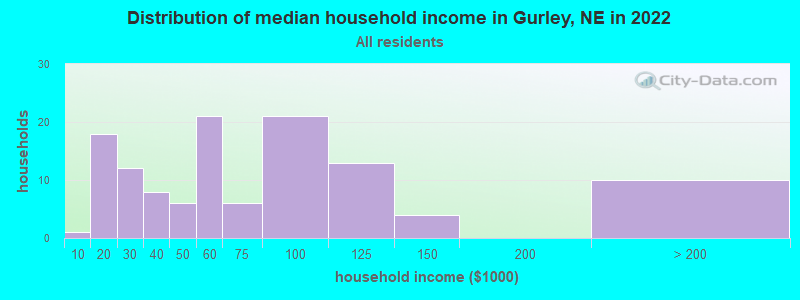
Income statistics for all residents
Median household income in Gurley, NE in 2022:
Gurley:
$55,083
State:
$69,597
Change in median household income between 2000 and 2022:
Gurley, Nebraska:
+82.1%
State:
+77.3%
Number of households with income < $10k:
Gurley:
0.8% (1)
State:
4.9% (39,385)
Number of households with income $10k - 20k:
Gurley:
15.0% (18)
State:
6.9% (55,520)
Number of households with income $20k - 30k:
Gurley:
10.0% (12)
State:
7.3% (58,969)
Number of households with income $30k - 40k:
Gurley:
6.7% (8)
Nebraska:
8.3% (66,349)
Number of households with income $40k - 50k:
Gurley:
5.0% (6)
Nebraska:
8.3% (66,330)
Number of households with income $50k - 60k:
Gurley:
17.5% (21)
State:
7.3% (58,981)
Number of households with income $60k - 75k:
Gurley:
5.0% (6)
State:
10.1% (80,982)
Number of households with income $75k - 100k:
Gurley:
17.5% (21)
State:
13.5% (108,056)
Number of households with income $100k - 125k:
Gurley:
10.8% (13)
Nebraska:
10.6% (84,921)
Number of households with income $125k - 150k:
Gurley:
3.3% (4)
State:
6.9% (55,106)
Number of households with income $150k - 200k:
Gurley:
0.0% (0)
State:
8.0% (64,623)
Number of households with income > $200k:
Gurley:
8.3% (10)
State:
8.0% (63,935)
Aggregate household income in Gurley in 2022: $9,757,756
Median family income in Gurley in 2022:
Gurley:
$79,053
Nebraska:
$92,676
Number of families with income $10k - 20k:
Gurley:
3.1% (2)
State:
3.1% (15,673)
Number of families with income $30k - 40k:
Gurley:
5.7% (4)
Nebraska:
5.6% (27,925)
Number of families with income $50k - 60k:
Gurley:
27.7% (19)
State:
6.2% (31,270)
Number of families with income $60k - 75k:
Gurley:
8.9% (6)
State:
10.5% (52,455)
Number of families with income $75k - 100k:
Gurley:
27.1% (19)
State:
15.4% (77,141)
Number of families with income $100k - 125k:
Gurley:
10.0% (7)
State:
13.5% (67,817)
Number of families with income $125k - 150k:
Gurley:
4.3% (3)
State:
9.4% (47,206)
Number of families with income > $200k:
Gurley:
13.4% (9)
State:
11.1% (55,699)
Median income for families with 0 earners:
Gurley:
$0
State:
$50,017
Median income for families with 1 earner:
Gurley:
$0
Nebraska:
$61,290
Median income for families with 2 earners:
Gurley:
$78,773
State:
$110,359
Median income for families with 3+ earners:
Gurley:
$0
Nebraska:
$134,518
Median non-family income in Gurley in 2022:
Gurley:
$23,852
State:
$40,712
Change in median non-family income between 2000 and 2022:: -4.6%
Gurley, Nebraska:
-4.6%
State:
+77.1%
Median per capita income in Gurley in 2022:
Gurley:
$33,891
State:
$38,997
Income statistics for White residents
Median household income in Gurley, NE in 2022:
Gurley:
$54,766
State:
$72,200
Change in median household income between 2000 and 2022:
Gurley, Nebraska:
+79.6%
State:
+79.8%
Number of households with income < $10k:
Gurley:
0.9% (1)
State:
4.5% (30,161)
Number of households with income $10k - 20k:
Gurley:
15.0% (16)
Nebraska:
6.6% (44,570)
Number of households with income $20k - 30k:
Gurley:
11.2% (12)
State:
7.0% (47,313)
Number of households with income $30k - 40k:
Gurley:
7.5% (8)
State:
8.0% (53,672)
Number of households with income $40k - 50k:
Gurley:
5.6% (6)
State:
8.1% (54,226)
Number of households with income $50k - 60k:
Gurley:
19.6% (21)
Nebraska:
7.3% (49,363)
Number of households with income $60k - 75k:
Gurley:
5.6% (6)
State:
10.0% (67,227)
Number of households with income $75k - 100k:
Gurley:
10.3% (11)
State:
13.2% (88,988)
Number of households with income $100k - 125k:
Gurley:
12.1% (13)
State:
10.8% (72,291)
Number of households with income $125k - 150k:
Gurley:
3.7% (4)
State:
7.2% (48,670)
Number of households with income $150k - 200k:
Gurley:
0.0% (0)
State:
8.7% (58,306)
Number of households with income > $200k:
Gurley:
8.4% (9)
State:
8.5% (57,020)
Aggregate household income in Gurley in 2022: $8,601,701
Median family income in Gurley in 2022:
Gurley:
$74,299
Nebraska:
$97,416
Number of families with income $10k - 20k:
Gurley:
3.6% (2)
Nebraska:
2.7% (11,277)
Number of families with income $30k - 40k:
Gurley:
5.9% (3)
State:
4.9% (20,081)
Number of families with income $50k - 60k:
Gurley:
32.1% (19)
State:
6.1% (25,277)
Number of families with income $60k - 75k:
Gurley:
10.2% (6)
State:
10.3% (42,609)
Number of families with income $75k - 100k:
Gurley:
16.0% (9)
State:
15.1% (62,421)
Number of families with income $100k - 125k:
Gurley:
11.5% (7)
State:
14.0% (57,836)
Number of families with income $125k - 150k:
Gurley:
5.1% (3)
State:
10.2% (42,226)
Number of families with income > $200k:
Gurley:
15.6% (9)
State:
12.1% (50,040)
Median non-family income in Gurley in 2022:
Gurley:
$24,622
Nebraska:
$41,549
Change in median non-family income between 2000 and 2022:: -1.5%
Gurley, Nebraska:
-1.5%
State:
+78.3%
Median per capita income in Gurley in 2022:
Gurley:
$38,463
Nebraska:
$42,734
Income statistics for Hispanic or Latino residents
Aggregate household income in Gurley in 2022: $1,864,683
Median per capita income in Gurley in 2022:
Gurley:
$9,267
State:
$21,511
Income statistics for American Indian and Alaska Native residents
Median per capita income in Gurley in 2022:
Gurley:
$57,289
State:
$31,134
Income statistics for Multirace residents
Aggregate household income in Gurley in 2022: $1,607,318
Median per capita income in Gurley in 2022:
Gurley:
$8,206
State:
$24,026
Change in median per capita income between 2000 and 2022:: -58.7%
Gurley, Nebraska:
-58.7%
State:
+150.7%
Discuss Gurley, Nebraska (NE) on our hugely popular Nebraska forum.