The median household income in Grier City, PA in 2022 was $71,906, which was about the same as the median annual income of $71,798 across the entire state of Pennsylvania. Compared to the median income of $32,699 in 2000 this represents an increase of 54.5%. The per capita income in 2022 was $38,425, which means an increase of 55.2% compared to 2000 when it was $17,230.
Whole page based on the data from 2000 / 2022 when the population of Grier City, Pennsylvania was 241 / 242
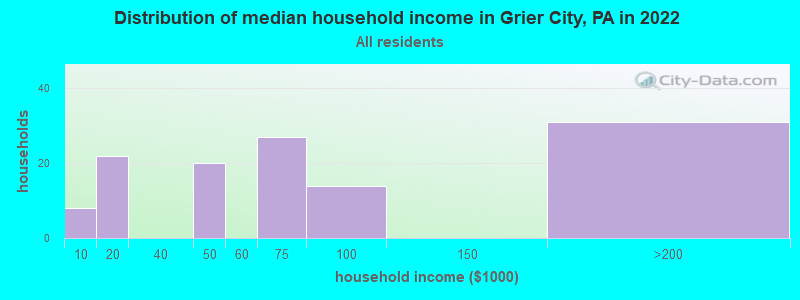
Income statistics for all residents
Median household income in Grier City, PA in 2022:
Grier City:
$71,907
Pennsylvania:
$71,798
Change in median household income between 2000 and 2022:
Grier City, Pennsylvania:
+119.9%
State:
+79.0%
Number of households with income < $10k:
Grier City:
6.6% (8)
Pennsylvania:
5.5% (291,562)
Number of households with income $10k - 20k:
Grier City:
18.0% (22)
Pennsylvania:
7.3% (384,726)
Number of households with income $20k - 30k:
Grier City:
0.0% (0)
Pennsylvania:
7.4% (389,464)
Number of households with income $30k - 40k:
Grier City:
0.0% (0)
State:
7.6% (402,138)
Number of households with income $40k - 50k:
Grier City:
16.4% (20)
State:
7.3% (387,945)
Number of households with income $50k - 60k:
Grier City:
0.0% (0)
State:
7.0% (372,468)
Number of households with income $60k - 75k:
Grier City:
22.1% (27)
State:
9.9% (524,786)
Number of households with income $75k - 100k:
Grier City:
11.5% (14)
State:
12.6% (666,253)
Number of households with income $100k - 125k:
Grier City:
0.0% (0)
Pennsylvania:
9.9% (526,402)
Number of households with income $125k - 150k:
Grier City:
0.0% (0)
Pennsylvania:
6.9% (362,702)
Number of households with income $150k - 200k:
Grier City:
25.4% (31)
State:
8.3% (440,827)
Number of households with income > $200k:
Grier City:
0.0% (0)
State:
10.3% (544,792)
Aggregate household income in Grier City in 2022: $8,967,267
Median family income in Grier City in 2022:
Grier City:
$86,905
Pennsylvania:
$93,029
Number of families with income < $10k:
Grier City:
7.9% (7)
Pennsylvania:
3.1% (101,868)
Number of families with income $10k - 20k:
Grier City:
3.2% (3)
State:
3.5% (115,881)
Number of families with income $40k - 50k:
Grier City:
3.4% (3)
State:
6.4% (211,380)
Number of families with income $60k - 75k:
Grier City:
28.0% (23)
State:
9.7% (318,991)
Number of families with income $75k - 100k:
Grier City:
18.1% (15)
Pennsylvania:
14.0% (461,021)
Number of families with income $150k - 200k:
Grier City:
39.4% (33)
State:
11.2% (367,642)
Median income for 2 person families:
Grier City:
$76,420
State:
$78,349
Median income for families with 0 earners:
Grier City:
$0
State:
$48,949
Median income for families with 1 earner:
Grier City:
$72,154
State:
$64,277
Median income for families with 2 earners:
Grier City:
$0
Pennsylvania:
$118,220
Median income for families with 3+ earners:
Grier City:
$0
State:
$150,374
Median per capita income in Grier City in 2022:
Grier City:
$38,425
State:
$41,489
Change in median per capita income between 2000 and 2022:
Grier City, Pennsylvania:
+123.0%
Pennsylvania:
+98.7%
Income statistics for White residents
Median household income in Grier City, PA in 2022:
Grier City:
$71,506
State:
$76,765
Change in median household income between 2000 and 2022:
Grier City, Pennsylvania:
+118.4%
State:
+84.3%
Number of households with income < $10k:
Grier City:
5.8% (7)
State:
4.3% (179,792)
Number of households with income $10k - 20k:
Grier City:
18.2% (22)
State:
6.5% (268,738)
Number of households with income $20k - 30k:
Grier City:
0.0% (0)
State:
7.0% (288,138)
Number of households with income $30k - 40k:
Grier City:
0.0% (0)
State:
7.2% (300,208)
Number of households with income $40k - 50k:
Grier City:
17.4% (21)
State:
7.2% (298,756)
Number of households with income $50k - 60k:
Grier City:
0.0% (0)
State:
6.8% (283,251)
Number of households with income $60k - 75k:
Grier City:
20.7% (25)
State:
9.9% (408,159)
Number of households with income $75k - 100k:
Grier City:
11.6% (14)
State:
13.2% (547,809)
Number of households with income $100k - 125k:
Grier City:
0.0% (0)
State:
10.5% (436,652)
Number of households with income $125k - 150k:
Grier City:
0.0% (0)
State:
7.3% (304,132)
Number of households with income $150k - 200k:
Grier City:
26.4% (32)
State:
9.0% (374,658)
Number of households with income > $200k:
Grier City:
0.0% (0)
State:
10.9% (452,618)
Aggregate household income in Grier City in 2022: $8,784,546
Median family income in Grier City in 2022:
Grier City:
$87,771
Pennsylvania:
$99,396
Number of families with income < $10k:
Grier City:
6.3% (5)
State:
2.2% (56,136)
Number of families with income $10k - 20k:
Grier City:
3.5% (3)
State:
2.7% (69,032)
Number of families with income $40k - 50k:
Grier City:
3.6% (3)
Pennsylvania:
6.0% (154,327)
Number of families with income $60k - 75k:
Grier City:
26.4% (21)
Pennsylvania:
9.6% (249,292)
Number of families with income $75k - 100k:
Grier City:
19.2% (15)
State:
14.7% (379,316)
Number of families with income $150k - 200k:
Grier City:
41.0% (33)
State:
12.2% (314,926)
Median per capita income in Grier City in 2022:
Grier City:
$38,923
State:
$45,306
Change in median per capita income between 2000 and 2022:
Grier City, Pennsylvania:
+123.7%
State:
+105.4%
Discuss Grier City, Pennsylvania (PA) on our hugely popular Pennsylvania forum.