The median household income in Green Valley, WI in 2022 was $70,043, which was about the same as the median annual income of $70,996 across the entire state of Wisconsin. Compared to the median income of $42,778 in 2000 this represents an increase of 38.9%. The per capita income in 2022 was $33,818, which means an increase of 47.8% compared to 2000 when it was $17,637.
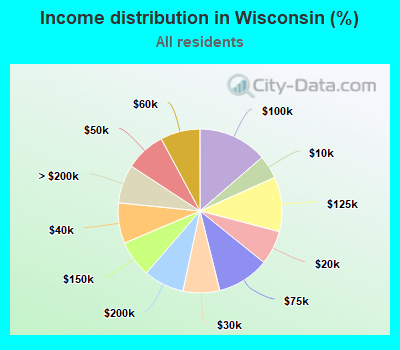
Income statistics for all residents
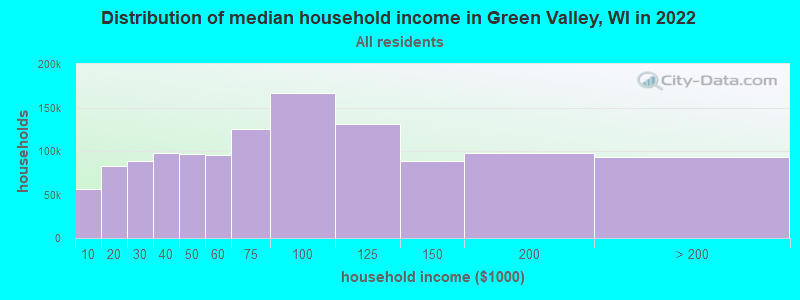
Median household income in Green Valley, WI in 2022:
Green Valley:
$70,044
State:
$70,996
Change in median household income between 2000 and 2022:
Green Valley, Wisconsin:
+63.7%
Wisconsin:
+62.1%
Number of households with income < $10k:
Green Valley:
4.6% (56,475)
State:
4.6% (115,058)
Number of households with income $10k - 20k:
Green Valley:
6.8% (82,313)
State:
6.7% (167,685)
Number of households with income $20k - 30k:
Green Valley:
7.3% (88,457)
State:
7.2% (180,435)
Number of households with income $30k - 40k:
Green Valley:
8.0% (97,685)
Wisconsin:
8.0% (199,167)
Number of households with income $40k - 50k:
Green Valley:
7.9% (96,780)
Wisconsin:
7.9% (197,648)
Number of households with income $50k - 60k:
Green Valley:
7.8% (95,574)
State:
7.8% (195,297)
Number of households with income $60k - 75k:
Green Valley:
10.3% (125,582)
State:
10.3% (256,633)
Number of households with income $75k - 100k:
Green Valley:
13.7% (166,376)
State:
13.7% (340,492)
Number of households with income $100k - 125k:
Green Valley:
10.8% (131,117)
State:
10.8% (268,847)
Number of households with income $125k - 150k:
Green Valley:
7.2% (88,261)
State:
7.3% (180,911)
Number of households with income $150k - 200k:
Green Valley:
8.0% (97,274)
State:
8.0% (199,297)
Number of households with income > $200k:
Green Valley:
7.6% (92,743)
Wisconsin:
7.6% (189,651)
Aggregate household income in Green Valley in 2022: $1,018,809,455
Median family income in Green Valley in 2022:
Green Valley:
$84,234
State:
$91,700
Median non-family income in Green Valley in 2022:
Green Valley:
$30,765
State:
$42,812
Change in median non-family income between 2000 and 2022:
Green Valley, Wisconsin:
+68.3%
State:
+65.7%
Median per capita income in Green Valley in 2022:
Green Valley:
$33,818
State:
$40,188
Change in median per capita income between 2000 and 2022:
Green Valley, Wisconsin:
+91.7%
Wisconsin:
+88.9%
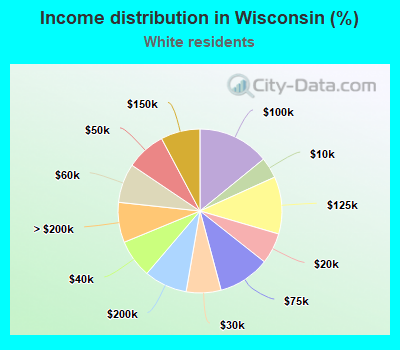
Income statistics for White residents
Median household income in Green Valley, WI in 2022:
Green Valley:
$70,513
Wisconsin:
$74,405
Change in median household income between 2000 and 2022:
Green Valley, Wisconsin:
+65.9%
Wisconsin:
+64.5%
Number of households with income < $10k:
Green Valley:
4.1% (41,093)
State:
4.1% (87,410)
Number of households with income $10k - 20k:
Green Valley:
6.1% (60,901)
Wisconsin:
6.1% (129,511)
Number of households with income $20k - 30k:
Green Valley:
6.9% (68,271)
Wisconsin:
6.9% (145,235)
Number of households with income $30k - 40k:
Green Valley:
7.6% (75,326)
State:
7.6% (160,205)
Number of households with income $40k - 50k:
Green Valley:
7.8% (77,852)
State:
7.8% (165,627)
Number of households with income $50k - 60k:
Green Valley:
7.7% (76,825)
State:
7.7% (163,506)
Number of households with income $60k - 75k:
Green Valley:
10.2% (101,734)
State:
10.2% (216,479)
Number of households with income $75k - 100k:
Green Valley:
14.1% (140,443)
Wisconsin:
14.1% (298,984)
Number of households with income $100k - 125k:
Green Valley:
11.3% (112,473)
State:
11.3% (239,588)
Number of households with income $125k - 150k:
Green Valley:
7.8% (77,245)
Wisconsin:
7.8% (164,502)
Number of households with income $150k - 200k:
Green Valley:
8.5% (84,560)
State:
8.5% (180,048)
Number of households with income > $200k:
Green Valley:
7.9% (78,951)
Wisconsin:
7.9% (167,999)
Aggregate household income in Green Valley in 2022: $880,090,546
Median family income in Green Valley in 2022:
Green Valley:
$84,785
Wisconsin:
$96,327
Number of families with income < $10k:
Green Valley:
2.0% (4)
Wisconsin:
2.0% (25,684)
Number of families with income $10k - 20k:
Green Valley:
5.3% (11)
State:
2.4% (30,426)
Number of families with income $20k - 30k:
Green Valley:
5.9% (13)
State:
3.5% (45,298)
Number of families with income $30k - 40k:
Green Valley:
6.3% (14)
State:
4.9% (62,935)
Number of families with income $40k - 50k:
Green Valley:
10.8% (23)
State:
6.0% (76,575)
Number of families with income $50k - 60k:
Green Valley:
8.8% (19)
State:
6.9% (88,079)
Number of families with income $60k - 75k:
Green Valley:
12.6% (27)
State:
10.6% (136,022)
Number of families with income $75k - 100k:
Green Valley:
22.0% (47)
State:
16.0% (204,807)
Number of families with income $100k - 125k:
Green Valley:
14.0% (30)
State:
14.3% (183,287)
Number of families with income $125k - 150k:
Green Valley:
4.1% (9)
State:
10.2% (131,464)
Number of families with income > $200k:
Green Valley:
8.2% (18)
Wisconsin:
11.2% (143,836)
Median non-family income in Green Valley in 2022:
Green Valley:
$30,553
Wisconsin:
$44,213
Change in median non-family income between 2000 and 2022:
Green Valley, Wisconsin:
+70.0%
State:
+68.5%
Median per capita income in Green Valley in 2022:
Green Valley:
$34,607
Wisconsin:
$43,415
Change in median per capita income between 2000 and 2022:
Green Valley, Wisconsin:
+96.6%
State:
+94.0%
Income statistics for Hispanic or Latino residents
Number of households with income < $10k:
Green Valley:
6.2% (6,695)
Wisconsin:
6.2% (7,841)
Number of households with income $10k - 20k:
Green Valley:
7.2% (7,764)
Wisconsin:
7.2% (9,100)
Number of households with income $20k - 30k:
Green Valley:
7.3% (7,861)
State:
7.3% (9,213)
Number of households with income $30k - 40k:
Green Valley:
9.9% (10,675)
State:
9.9% (12,505)
Number of households with income $40k - 50k:
Green Valley:
9.9% (10,700)
State:
9.9% (12,552)
Number of households with income $50k - 60k:
Green Valley:
8.9% (9,610)
Wisconsin:
8.9% (11,263)
Number of households with income $60k - 75k:
Green Valley:
13.0% (14,031)
Wisconsin:
13.0% (16,458)
Number of households with income $75k - 100k:
Green Valley:
14.7% (15,857)
State:
14.7% (18,587)
Number of households with income $100k - 125k:
Green Valley:
8.8% (9,497)
State:
8.8% (11,136)
Number of households with income $125k - 150k:
Green Valley:
4.2% (4,508)
Wisconsin:
4.2% (5,292)
Number of households with income $150k - 200k:
Green Valley:
5.3% (5,740)
State:
5.3% (6,737)
Number of households with income > $200k:
Green Valley:
4.6% (4,981)
Wisconsin:
4.6% (5,851)
Median per capita income in Green Valley in 2022:
Green Valley:
$39,496
Wisconsin:
$23,991
Change in median per capita income between 2000 and 2022:
Green Valley, Wisconsin:
+101.2%
State:
+108.6%
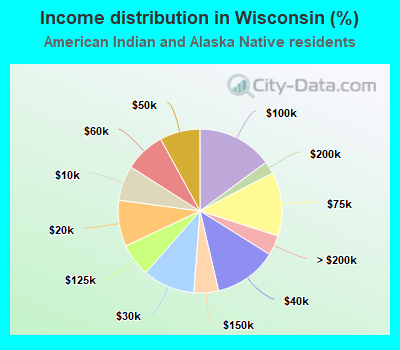
Income statistics for American Indian and Alaska Native residents
Median household income in Green Valley, WI in 2022:
Green Valley:
$53,076
State:
$54,790
Change in median household income between 2000 and 2022:
Green Valley, Wisconsin:
+69.8%
State:
+69.2%
Number of households with income < $10k:
Green Valley:
6.9% (532)
State:
6.9% (1,103)
Number of households with income $10k - 20k:
Green Valley:
9.2% (706)
State:
9.1% (1,458)
Number of households with income $20k - 30k:
Green Valley:
10.2% (789)
State:
10.2% (1,636)
Number of households with income $30k - 40k:
Green Valley:
12.4% (957)
State:
12.5% (1,993)
Number of households with income $40k - 50k:
Green Valley:
8.0% (615)
State:
7.9% (1,269)
Number of households with income $50k - 60k:
Green Valley:
8.0% (618)
State:
8.0% (1,284)
Number of households with income $60k - 75k:
Green Valley:
12.6% (974)
Wisconsin:
12.6% (2,013)
Number of households with income $75k - 100k:
Green Valley:
14.8% (1,143)
Wisconsin:
14.9% (2,380)
Number of households with income $100k - 125k:
Green Valley:
6.6% (505)
State:
6.5% (1,043)
Number of households with income $125k - 150k:
Green Valley:
4.8% (373)
State:
4.9% (778)
Number of households with income $150k - 200k:
Green Valley:
2.5% (189)
State:
2.5% (392)
Number of households with income > $200k:
Green Valley:
3.9% (303)
Wisconsin:
3.9% (631)
Aggregate household income in Green Valley in 2022: $107,197
Median non-family income in Green Valley in 2022:
Green Valley:
$64,578
State:
$39,686
Change in median non-family income between 2000 and 2022:
Green Valley, Wisconsin:
+106.6%
State:
+79.3%
Median per capita income in Green Valley in 2022:
Green Valley:
$11,745
State:
$25,398
Change in median per capita income between 2000 and 2022:
Green Valley, Wisconsin:
+87.6%
State:
+87.6%
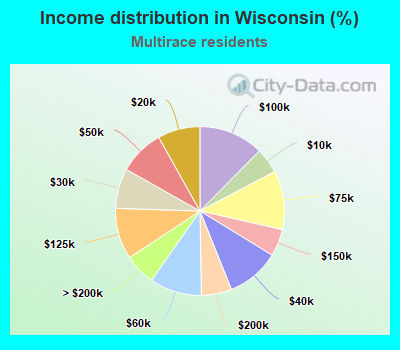
Income statistics for Multirace residents
Median household income in Green Valley, WI in 2022:
Green Valley:
$99,303
State:
$60,490
Change in median household income between 2000 and 2022:
Green Valley, Wisconsin:
+69.0%
State:
+69.6%
Number of households with income < $10k:
Green Valley:
4.9% (5,190)
State:
4.8% (6,288)
Number of households with income $10k - 20k:
Green Valley:
8.2% (8,743)
State:
8.1% (10,562)
Number of households with income $20k - 30k:
Green Valley:
7.7% (8,235)
State:
7.7% (9,975)
Number of households with income $30k - 40k:
Green Valley:
10.3% (10,927)
State:
10.2% (13,246)
Number of households with income $40k - 50k:
Green Valley:
8.7% (9,281)
State:
8.7% (11,305)
Number of households with income $50k - 60k:
Green Valley:
10.0% (10,673)
Wisconsin:
10.0% (12,968)
Number of households with income $60k - 75k:
Green Valley:
11.2% (11,929)
State:
11.3% (14,655)
Number of households with income $75k - 100k:
Green Valley:
12.5% (13,279)
State:
12.4% (16,181)
Number of households with income $100k - 125k:
Green Valley:
9.8% (10,417)
State:
9.8% (12,743)
Number of households with income $125k - 150k:
Green Valley:
5.2% (5,506)
State:
5.2% (6,773)
Number of households with income $150k - 200k:
Green Valley:
5.7% (6,085)
Wisconsin:
5.8% (7,552)
Number of households with income > $200k:
Green Valley:
5.9% (6,330)
State:
6.0% (7,788)
Aggregate household income in Green Valley in 2022: $4,027,059
Median family income in Green Valley in 2022:
Green Valley:
$97,288
State:
$69,897
Number of families with income $50k - 60k:
Green Valley:
100.0% (25)
State:
8.6% (7,171)
Median per capita income in Green Valley in 2022:
Green Valley:
$105,172
State:
$24,783
Change in median per capita income between 2000 and 2022:
Green Valley, Wisconsin:
+125.9%
Wisconsin:
+124.7%
Income statistics for other residents
Number of households with income < $10k:
Green Valley:
7.3% (6,157)
State:
7.2% (2,622)
Number of households with income $10k - 20k:
Green Valley:
5.9% (5,011)
State:
5.9% (2,142)
Number of households with income $20k - 30k:
Green Valley:
7.5% (6,343)
State:
7.5% (2,715)
Number of households with income $30k - 40k:
Green Valley:
11.7% (9,931)
State:
11.7% (4,249)
Number of households with income $40k - 50k:
Green Valley:
11.3% (9,568)
Wisconsin:
11.4% (4,111)
Number of households with income $50k - 60k:
Green Valley:
5.9% (4,984)
Wisconsin:
5.9% (2,134)
Number of households with income $60k - 75k:
Green Valley:
16.5% (13,950)
State:
16.5% (5,962)
Number of households with income $75k - 100k:
Green Valley:
12.5% (10,587)
Wisconsin:
12.5% (4,527)
Number of households with income $100k - 125k:
Green Valley:
7.1% (5,961)
Wisconsin:
7.0% (2,551)
Number of households with income $125k - 150k:
Green Valley:
4.2% (3,512)
State:
4.2% (1,517)
Number of households with income $150k - 200k:
Green Valley:
6.4% (5,374)
Wisconsin:
6.4% (2,318)
Number of households with income > $200k:
Green Valley:
3.7% (3,145)
Wisconsin:
3.7% (1,344)
Median per capita income in Green Valley in 2022:
Green Valley:
$127,832
State:
$27,766
Discuss Green Valley, Wisconsin (WI) on our hugely popular Wisconsin forum.