Green Valley Farms, Texas (TX) income map, earnings map, and wages data

Data:
The per capita income in 2022 was $20,090, which means an increase of 72.1% compared to 2000 when it was $5,612.
Whole page based on the data from 2000 / 2022 when the population of Green Valley Farms, Texas was 720 / 472
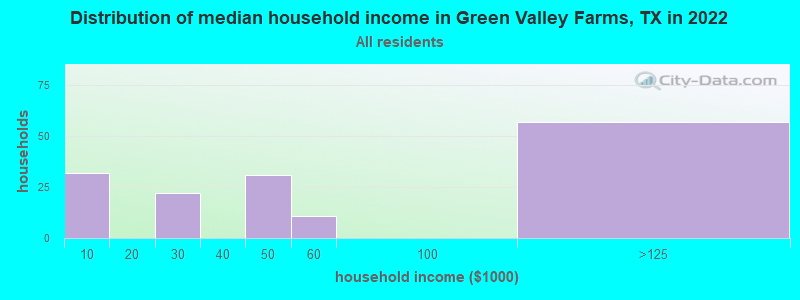
Income statistics for all residents
Number of households with income < $10k:| Green Valley Farms: | 20.9% (32) |
| State: | 5.5% (611,011) |
Number of households with income $10k - 20k:| Green Valley Farms: | 0.0% (0) |
| State: | 6.7% (743,157) |
Number of households with income $20k - 30k:| Green Valley Farms: | 14.4% (22) |
| State: | 7.2% (803,381) |
Number of households with income $30k - 40k:| Green Valley Farms: | 0.0% (0) |
| Texas: | 7.8% (866,080) |
Number of households with income $40k - 50k:| Green Valley Farms: | 20.3% (31) |
| State: | 7.3% (810,440) |
Number of households with income $50k - 60k:| Green Valley Farms: | 7.2% (11) |
| State: | 7.2% (799,783) |
Number of households with income $60k - 75k:| Green Valley Farms: | 0.0% (0) |
| State: | 9.9% (1,095,384) |
Number of households with income $75k - 100k:| Green Valley Farms: | 0.0% (0) |
| Texas: | 12.8% (1,419,057) |
Number of households with income $100k - 125k:| Green Valley Farms: | 37.3% (57) |
| State: | 9.5% (1,054,577) |
Number of households with income $125k - 150k:| Green Valley Farms: | 0.0% (0) |
| State: | 6.7% (741,518) |
Number of households with income $150k - 200k:| Green Valley Farms: | 0.0% (0) |
| State: | 8.7% (961,776) |
Number of households with income > $200k:| Green Valley Farms: | 0.0% (0) |
| State: | 10.7% (1,181,544) |
Aggregate household income in Green Valley Farms in 2022: $8,684,314
Median per capita income in Green Valley Farms in 2022:| Green Valley Farms: | $20,091 |
| Texas: | $38,123 |
Income statistics for White residents
Number of households with income < $10k:| Green Valley Farms: | 80.0% (16) |
| State: | 4.7% (273,716) |
Number of households with income $10k - 20k:| Green Valley Farms: | 0.0% (0) |
| State: | 5.5% (322,702) |
Number of households with income $20k - 30k:| Green Valley Farms: | 20.0% (4) |
| Texas: | 6.2% (363,947) |
Number of households with income $30k - 40k:| Green Valley Farms: | 0.0% (0) |
| State: | 6.8% (399,275) |
Number of households with income $40k - 50k:| Green Valley Farms: | 0.0% (0) |
| Texas: | 6.5% (383,417) |
Number of households with income $50k - 60k:| Green Valley Farms: | 0.0% (0) |
| State: | 6.6% (388,535) |
Number of households with income $60k - 75k:| Green Valley Farms: | 0.0% (0) |
| State: | 9.7% (566,295) |
Number of households with income $75k - 100k:| Green Valley Farms: | 0.0% (0) |
| State: | 13.0% (760,276) |
Number of households with income $100k - 125k:| Green Valley Farms: | 0.0% (0) |
| State: | 10.2% (597,596) |
Number of households with income $125k - 150k:| Green Valley Farms: | 0.0% (0) |
| Texas: | 7.4% (436,830) |
Number of households with income $150k - 200k:| Green Valley Farms: | 0.0% (0) |
| State: | 9.9% (583,067) |
Number of households with income > $200k:| Green Valley Farms: | 0.0% (0) |
| State: | 13.5% (792,647) |
Aggregate household income in Green Valley Farms in 2022: $5,958,246
Median per capita income in Green Valley Farms in 2022:| Green Valley Farms: | $15,530 |
| Texas: | $47,740 |
Change in median per capita income between 2000 and 2022:| Green Valley Farms, Texas: | +136.2% |
| State: | +114.3% |
Income statistics for Hispanic or Latino residents
Number of households with income < $10k:| Green Valley Farms: | 21.1% (32) |
| Texas: | 5.8% (213,953) |
Number of households with income $10k - 20k:| Green Valley Farms: | 0.0% (0) |
| Texas: | 8.0% (297,456) |
Number of households with income $20k - 30k:| Green Valley Farms: | 14.5% (22) |
| Texas: | 9.2% (340,166) |
Number of households with income $30k - 40k:| Green Valley Farms: | 0.0% (0) |
| Texas: | 9.5% (354,336) |
Number of households with income $40k - 50k:| Green Valley Farms: | 21.1% (32) |
| State: | 8.8% (327,013) |
Number of households with income $50k - 60k:| Green Valley Farms: | 7.2% (11) |
| Texas: | 8.3% (308,818) |
Number of households with income $60k - 75k:| Green Valley Farms: | 0.0% (0) |
| State: | 10.9% (405,109) |
Number of households with income $75k - 100k:| Green Valley Farms: | 0.0% (0) |
| State: | 13.8% (511,639) |
Number of households with income $100k - 125k:| Green Valley Farms: | 36.2% (55) |
| State: | 8.6% (319,728) |
Number of households with income $125k - 150k:| Green Valley Farms: | 0.0% (0) |
| Texas: | 5.7% (210,932) |
Number of households with income $150k - 200k:| Green Valley Farms: | 0.0% (0) |
| Texas: | 6.4% (236,055) |
Number of households with income > $200k:| Green Valley Farms: | 0.0% (0) |
| Texas: | 5.1% (189,259) |
Aggregate household income in Green Valley Farms in 2022: $8,723,606
Median per capita income in Green Valley Farms in 2022:| Green Valley Farms: | $20,107 |
| State: | $24,862 |
Income statistics for Multirace residents
Number of households with income < $10k:| Green Valley Farms: | 0.0% (0) |
| State: | 5.5% (122,324) |
Number of households with income $10k - 20k:| Green Valley Farms: | 0.0% (0) |
| State: | 8.2% (182,232) |
Number of households with income $20k - 30k:| Green Valley Farms: | 0.0% (0) |
| Texas: | 8.5% (189,456) |
Number of households with income $30k - 40k:| Green Valley Farms: | 0.0% (0) |
| State: | 8.9% (197,499) |
Number of households with income $40k - 50k:| Green Valley Farms: | 32.9% (46) |
| Texas: | 8.7% (191,735) |
Number of households with income $50k - 60k:| Green Valley Farms: | 0.0% (0) |
| State: | 8.0% (177,535) |
Number of households with income $60k - 75k:| Green Valley Farms: | 0.0% (0) |
| Texas: | 10.5% (232,479) |
Number of households with income $75k - 100k:| Green Valley Farms: | 0.0% (0) |
| State: | 13.1% (290,448) |
Number of households with income $100k - 125k:| Green Valley Farms: | 67.1% (94) |
| State: | 8.6% (191,595) |
Number of households with income $125k - 150k:| Green Valley Farms: | 0.0% (0) |
| State: | 6.0% (133,361) |
Number of households with income $150k - 200k:| Green Valley Farms: | 0.0% (0) |
| State: | 7.2% (159,195) |
Number of households with income > $200k:| Green Valley Farms: | 0.0% (0) |
| State: | 6.7% (148,064) |
Median per capita income in Green Valley Farms in 2022:| Green Valley Farms: | $23,807 |
| State: | $26,785 |
Income statistics for other residents
Number of households with income < $10k:| Green Valley Farms: | 0.0% (0) |
| Texas: | 5.9% (54,162) |
Number of households with income $10k - 20k:| Green Valley Farms: | 0.0% (0) |
| Texas: | 6.8% (62,891) |
Number of households with income $20k - 30k:| Green Valley Farms: | 63.3% (31) |
| State: | 10.6% (97,294) |
Number of households with income $30k - 40k:| Green Valley Farms: | 0.0% (0) |
| State: | 10.8% (99,670) |
Number of households with income $40k - 50k:| Green Valley Farms: | 0.0% (0) |
| State: | 9.3% (85,548) |
Number of households with income $50k - 60k:| Green Valley Farms: | 36.7% (18) |
| State: | 9.0% (82,757) |
Number of households with income $60k - 75k:| Green Valley Farms: | 0.0% (0) |
| State: | 10.9% (100,326) |
Number of households with income $75k - 100k:| Green Valley Farms: | 0.0% (0) |
| State: | 14.0% (128,767) |
Number of households with income $100k - 125k:| Green Valley Farms: | 0.0% (0) |
| State: | 8.2% (75,218) |
Number of households with income $125k - 150k:| Green Valley Farms: | 0.0% (0) |
| Texas: | 4.8% (44,223) |
Number of households with income $150k - 200k:| Green Valley Farms: | 0.0% (0) |
| State: | 5.6% (51,376) |
Number of households with income > $200k:| Green Valley Farms: | 0.0% (0) |
| Texas: | 4.0% (36,393) |
Aggregate household income in Green Valley Farms in 2022: $2,851,686
Median per capita income in Green Valley Farms in 2022:| Green Valley Farms: | $12,669 |
| State: | $23,899 |