The median household income in Green Valley, CA in 2022 was $130,024, which was 29.6% greater than the median annual income of $91,551 across the entire state of California. Compared to the median income of $83,755 in 2000 this represents an increase of 35.6%. The per capita income in 2022 was $72,444, which means an increase of 40.7% compared to 2000 when it was $42,979.
Whole page based on the data from 2000 / 2022 when the population of Green Valley, California was 1,859 / 1,578
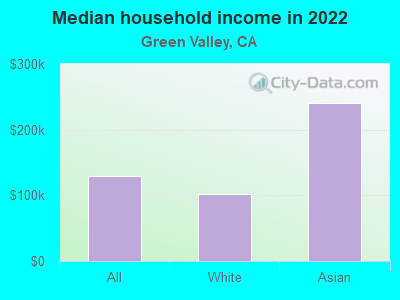
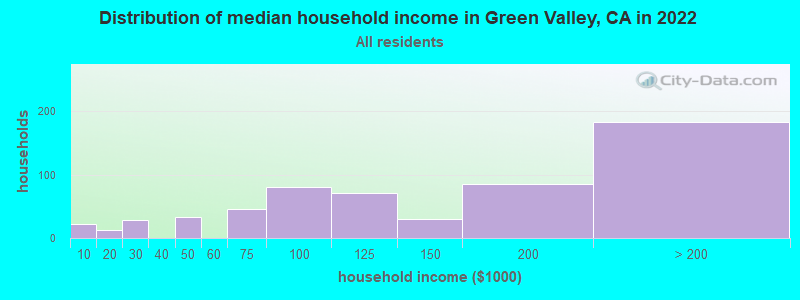
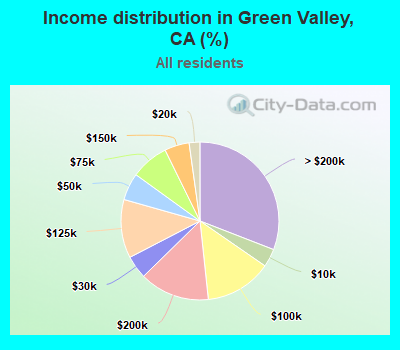
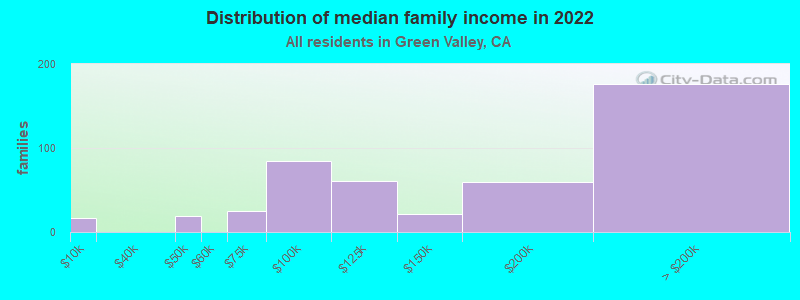
Income statistics for all residents
Median household income in Green Valley, CA in 2022:
Green Valley:
$130,025
State:
$91,551
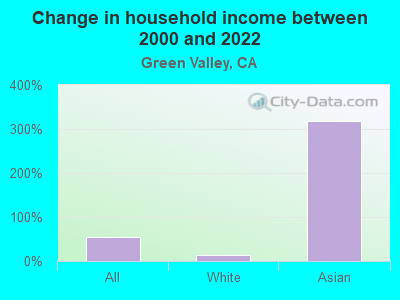
Change in median household income between 2000 and 2022:
Green Valley, California:
+55.2%
State:
+92.8%
Number of households with income < $10k:
Green Valley:
3.7% (22)
State:
4.8% (654,370)
Number of households with income $10k - 20k:
Green Valley:
2.2% (13)
California:
5.8% (789,493)
Number of households with income $20k - 30k:
Green Valley:
4.7% (28)
California:
5.7% (778,318)
Number of households with income $30k - 40k:
Green Valley:
0.0% (0)
State:
5.8% (783,170)
Number of households with income $40k - 50k:
Green Valley:
5.6% (33)
State:
5.8% (781,352)
Number of households with income $50k - 60k:
Green Valley:
0.0% (0)
State:
5.6% (760,175)
Number of households with income $60k - 75k:
Green Valley:
7.8% (46)
State:
8.2% (1,104,699)
Number of households with income $75k - 100k:
Green Valley:
13.7% (81)
State:
12.0% (1,627,633)
Number of households with income $100k - 125k:
Green Valley:
12.0% (71)
California:
10.0% (1,358,619)
Number of households with income $125k - 150k:
Green Valley:
5.1% (30)
California:
7.6% (1,027,455)
Number of households with income $150k - 200k:
Green Valley:
14.4% (85)
State:
10.6% (1,439,811)
Number of households with income > $200k:
Green Valley:
30.9% (183)
California:
18.0% (2,445,491)
Aggregate household income in Green Valley in 2022: $114,515,564
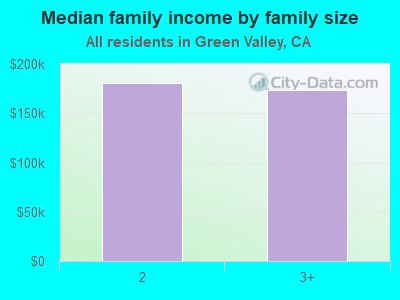
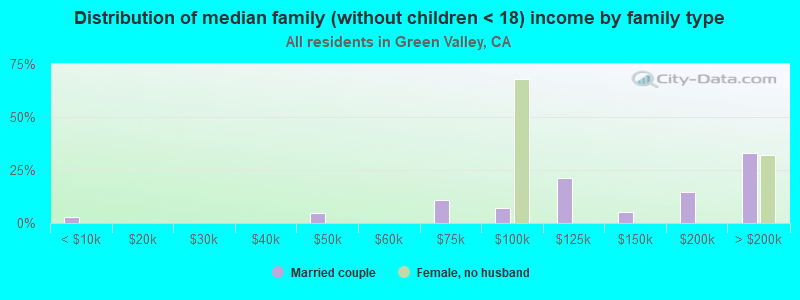
Median family income in Green Valley in 2022:
Green Valley:
$158,888
State:
$104,823
Number of families with income < $10k:
Green Valley:
3.6% (17)
California:
3.1% (280,184)
Number of families with income $40k - 50k:
Green Valley:
4.2% (19)
State:
5.6% (511,647)
Number of families with income $60k - 75k:
Green Valley:
5.4% (25)
State:
8.0% (731,094)
Number of families with income $75k - 100k:
Green Valley:
18.2% (84)
State:
12.2% (1,115,621)
Number of families with income $100k - 125k:
Green Valley:
13.2% (61)
State:
10.5% (959,600)
Number of families with income $125k - 150k:
Green Valley:
4.7% (22)
State:
8.4% (768,725)
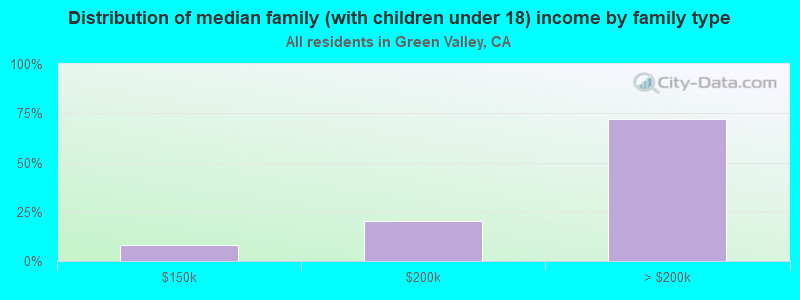
Number of families with income $150k - 200k:
Green Valley:
12.7% (59)
California:
11.9% (1,087,239)
Number of families with income > $200k:
Green Valley:
38.0% (176)
State:
21.5% (1,963,769)
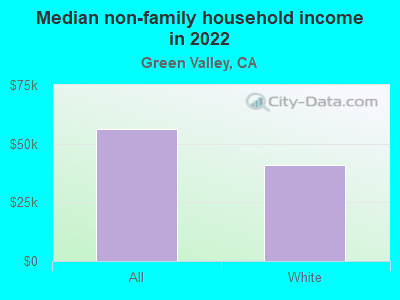
Median non-family income in Green Valley in 2022:
Green Valley:
$56,431
State:
$59,348
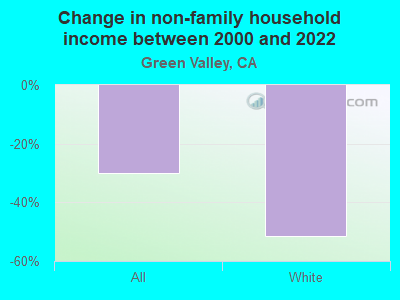
Change in median non-family income between 2000 and 2022:: -29.9%
Green Valley, California:
-29.9%
California:
+85.3%
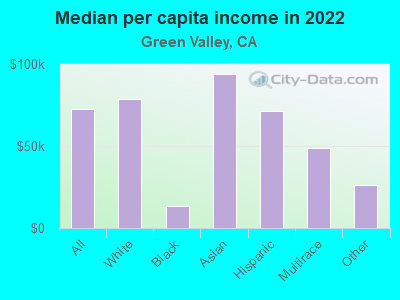
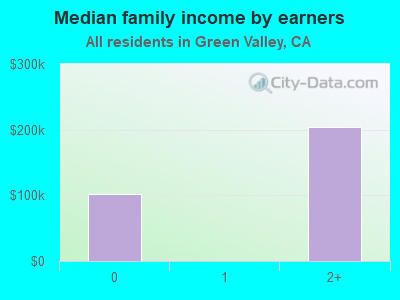
Median per capita income in Green Valley in 2022:
Green Valley:
$72,445
State:
$46,661
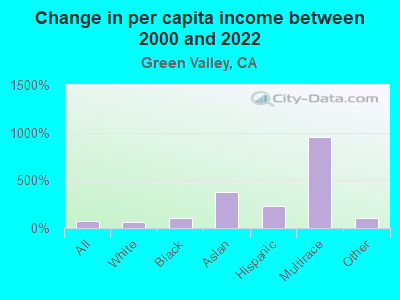
Change in median per capita income between 2000 and 2022:
Green Valley, California:
+68.6%
State:
+105.5%
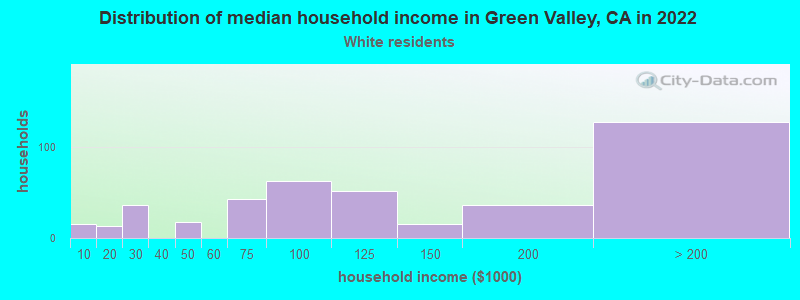
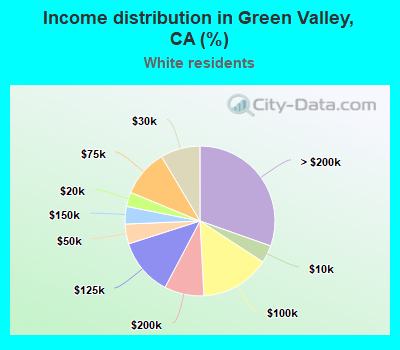
Income statistics for White residents
Median household income in Green Valley, CA in 2022:
Green Valley:
$102,052
State:
$100,917
Change in median household income between 2000 and 2022:
Green Valley, California:
+12.6%
California:
+96.8%
Number of households with income < $10k:
Green Valley:
3.8% (16)
State:
4.4% (284,109)
Number of households with income $10k - 20k:
Green Valley:
3.1% (13)
California:
5.3% (340,330)
Number of households with income $20k - 30k:
Green Valley:
8.6% (36)
State:
5.3% (343,145)
Number of households with income $30k - 40k:
Green Valley:
0.0% (0)
California:
5.1% (330,146)
Number of households with income $40k - 50k:
Green Valley:
4.3% (18)
California:
5.2% (335,310)
Number of households with income $50k - 60k:
Green Valley:
0.0% (0)
State:
5.1% (326,299)
Number of households with income $60k - 75k:
Green Valley:
10.2% (43)
State:
7.6% (487,640)
Number of households with income $75k - 100k:
Green Valley:
15.0% (63)
State:
11.5% (736,578)
Number of households with income $100k - 125k:
Green Valley:
12.4% (52)
State:
10.1% (648,782)
Number of households with income $125k - 150k:
Green Valley:
3.8% (16)
California:
7.8% (499,671)
Number of households with income $150k - 200k:
Green Valley:
8.6% (36)
State:
11.4% (729,603)
Number of households with income > $200k:
Green Valley:
30.4% (128)
California:
21.2% (1,364,246)
Aggregate household income in Green Valley in 2022: $81,495,210
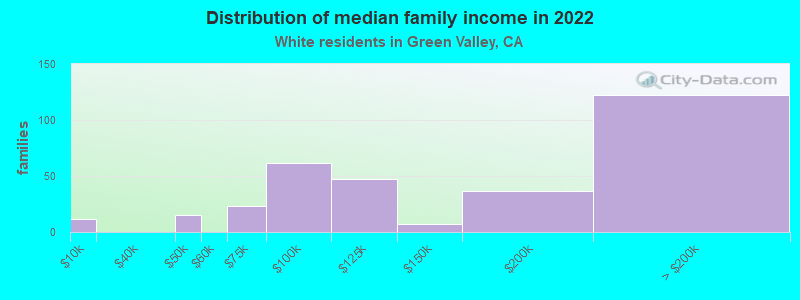
Median family income in Green Valley in 2022:
Green Valley:
$130,437
State:
$125,379
Number of families with income < $10k:
Green Valley:
3.6% (12)
State:
2.2% (87,079)
Number of families with income $40k - 50k:
Green Valley:
4.6% (15)
State:
4.3% (169,197)
Number of families with income $60k - 75k:
Green Valley:
6.9% (23)
State:
7.0% (274,752)
Number of families with income $75k - 100k:
Green Valley:
19.2% (62)
California:
11.3% (445,632)
Number of families with income $100k - 125k:
Green Valley:
14.6% (47)
State:
10.7% (423,630)
Number of families with income $125k - 150k:
Green Valley:
2.3% (7)
California:
9.1% (357,408)
Number of families with income $150k - 200k:
Green Valley:
11.2% (37)
State:
13.5% (532,693)
Number of families with income > $200k:
Green Valley:
37.5% (122)
California:
27.6% (1,086,948)
Median non-family income in Green Valley in 2022:
Green Valley:
$41,054
State:
$62,819
Change in median non-family income between 2000 and 2022:: -51.4%
Green Valley, California:
-51.4%
State:
+84.4%
Median per capita income in Green Valley in 2022:
Green Valley:
$78,894
State:
$61,706
Change in median per capita income between 2000 and 2022:
Green Valley, California:
+67.5%
State:
+122.7%
Income statistics for Black or African American residents
Number of households with income < $10k:
Green Valley:
0.0% (0)
State:
9.0% (73,219)
Number of households with income $10k - 20k:
Green Valley:
0.0% (0)
State:
10.6% (86,666)
Number of households with income $20k - 30k:
Green Valley:
0.0% (0)
State:
7.1% (57,719)
Number of households with income $30k - 40k:
Green Valley:
0.0% (0)
State:
7.2% (58,714)
Number of households with income $40k - 50k:
Green Valley:
0.0% (0)
California:
7.1% (58,075)
Number of households with income $50k - 60k:
Green Valley:
0.0% (0)
California:
6.8% (55,229)
Number of households with income $60k - 75k:
Green Valley:
0.0% (0)
State:
8.8% (71,895)
Number of households with income $75k - 100k:
Green Valley:
0.0% (0)
California:
11.9% (96,893)
Number of households with income $100k - 125k:
Green Valley:
0.0% (0)
State:
8.7% (70,729)
Number of households with income $125k - 150k:
Green Valley:
0.0% (0)
State:
6.3% (51,211)
Number of households with income $150k - 200k:
Green Valley:
100.0% (31)
State:
7.2% (58,687)
Number of households with income > $200k:
Green Valley:
0.0% (0)
State:
9.3% (75,487)
Aggregate household income in Green Valley in 2022: $1,553,006
Median per capita income in Green Valley in 2022:
Green Valley:
$13,368
California:
$36,708
Change in median per capita income between 2000 and 2022:
Green Valley, California:
+99.9%
State:
+110.4%
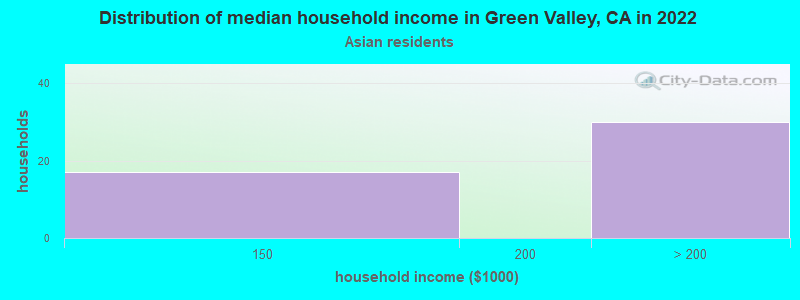
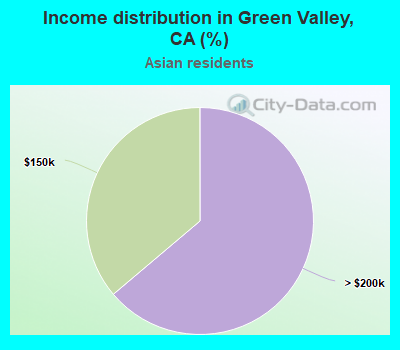
Income statistics for Asian residents
Median household income in Green Valley, CA in 2022:
Green Valley:
$240,872
State:
$119,861
Number of households with income < $10k:
Green Valley:
0.0% (0)
State:
5.1% (106,273)
Number of households with income $10k - 20k:
Green Valley:
0.0% (0)
State:
4.9% (101,815)
Number of households with income $20k - 30k:
Green Valley:
0.0% (0)
California:
4.6% (94,414)
Number of households with income $30k - 40k:
Green Valley:
0.0% (0)
California:
4.1% (84,491)
Number of households with income $40k - 50k:
Green Valley:
0.0% (0)
California:
4.0% (81,758)
Number of households with income $50k - 60k:
Green Valley:
0.0% (0)
State:
3.9% (80,971)
Number of households with income $60k - 75k:
Green Valley:
0.0% (0)
State:
6.0% (124,194)
Number of households with income $75k - 100k:
Green Valley:
0.0% (0)
California:
9.7% (200,337)
Number of households with income $100k - 125k:
Green Valley:
0.0% (0)
State:
9.4% (193,488)
Number of households with income $125k - 150k:
Green Valley:
36.2% (17)
California:
7.7% (158,253)
Number of households with income $150k - 200k:
Green Valley:
0.0% (0)
California:
12.2% (252,139)
Number of households with income > $200k:
Green Valley:
63.8% (30)
California:
28.4% (586,641)
Aggregate household income in Green Valley in 2022: $10,309,899
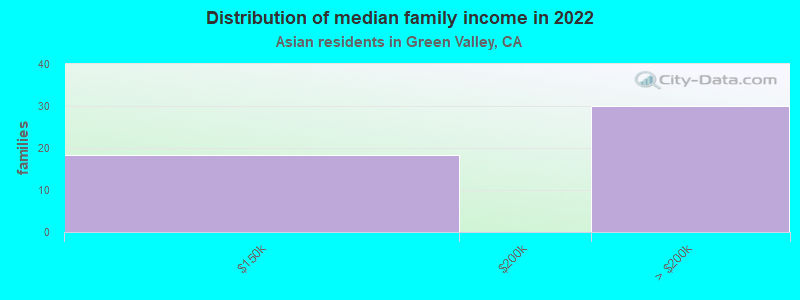
Median family income in Green Valley in 2022:
Green Valley:
$245,020
State:
$136,040
Number of families with income $125k - 150k:
Green Valley:
38.0% (18)
State:
8.0% (120,635)
Number of families with income > $200k:
Green Valley:
62.0% (30)
State:
32.5% (489,303)
Median per capita income in Green Valley in 2022:
Green Valley:
$93,606
California:
$58,824
Income statistics for Hispanic or Latino residents
Number of households with income < $10k:
Green Valley:
0.0% (0)
State:
4.3% (183,294)
Number of households with income $10k - 20k:
Green Valley:
0.0% (0)
State:
6.0% (253,903)
Number of households with income $20k - 30k:
Green Valley:
0.0% (0)
State:
6.8% (286,386)
Number of households with income $30k - 40k:
Green Valley:
0.0% (0)
State:
7.4% (313,728)
Number of households with income $40k - 50k:
Green Valley:
0.0% (0)
California:
7.4% (313,199)
Number of households with income $50k - 60k:
Green Valley:
0.0% (0)
State:
7.2% (305,366)
Number of households with income $60k - 75k:
Green Valley:
0.0% (0)
California:
10.3% (434,937)
Number of households with income $75k - 100k:
Green Valley:
0.0% (0)
California:
14.4% (607,302)
Number of households with income $100k - 125k:
Green Valley:
0.0% (0)
California:
10.6% (447,424)
Number of households with income $125k - 150k:
Green Valley:
0.0% (0)
State:
7.5% (316,022)
Number of households with income $150k - 200k:
Green Valley:
0.0% (0)
State:
9.2% (386,269)
Number of households with income > $200k:
Green Valley:
100.0% (23)
California:
8.8% (372,651)
Aggregate household income in Green Valley in 2022: $17,215,206
Median per capita income in Green Valley in 2022:
Green Valley:
$71,475
California:
$27,240
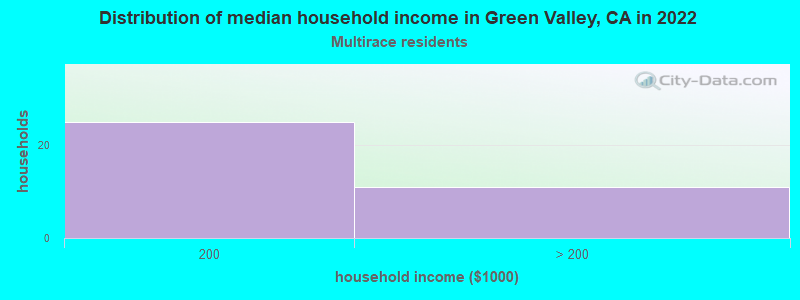
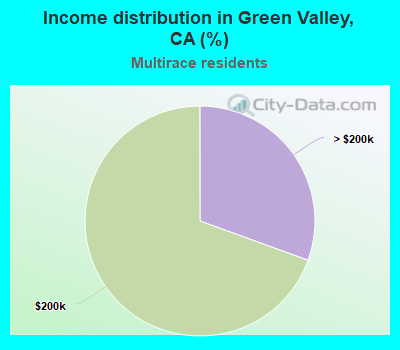
Income statistics for Multirace residents
Number of households with income < $10k:
Green Valley:
0.0% (0)
State:
4.2% (85,299)
Number of households with income $10k - 20k:
Green Valley:
0.0% (0)
State:
6.1% (122,966)
Number of households with income $20k - 30k:
Green Valley:
0.0% (0)
California:
6.4% (129,328)
Number of households with income $30k - 40k:
Green Valley:
0.0% (0)
State:
6.4% (130,070)
Number of households with income $40k - 50k:
Green Valley:
0.0% (0)
California:
6.5% (131,254)
Number of households with income $50k - 60k:
Green Valley:
0.0% (0)
California:
6.5% (132,382)
Number of households with income $60k - 75k:
Green Valley:
0.0% (0)
State:
9.4% (191,472)
Number of households with income $75k - 100k:
Green Valley:
0.0% (0)
State:
13.3% (269,691)
Number of households with income $100k - 125k:
Green Valley:
0.0% (0)
State:
10.2% (207,286)
Number of households with income $125k - 150k:
Green Valley:
0.0% (0)
State:
7.8% (158,259)
Number of households with income $150k - 200k:
Green Valley:
69.4% (25)
State:
10.3% (209,227)
Number of households with income > $200k:
Green Valley:
30.6% (11)
California:
13.0% (263,210)
Aggregate household income in Green Valley in 2022: $11,650,649
Median per capita income in Green Valley in 2022:
Green Valley:
$48,878
California:
$32,124
Income statistics for other residents
Median per capita income in Green Valley in 2022:
Green Valley:
$26,085
State:
$25,164
Change in median per capita income between 2000 and 2022:
Green Valley, California:
+100.7%
California:
+137.9%
Discuss Green Valley, California (CA) on our hugely popular California forum.