Gray, Kentucky (KY) income map, earnings map, and wages data
The median household income in Gray, KY in 2022 was $38,016, which was 56.1% less than the median annual income of $59,341 across the entire state of Kentucky. Compared to the median income of $21,544 in 2000 this represents an increase of 43.3%. The per capita income in 2022 was $20,456, which means an increase of 47.0% compared to 2000 when it was $10,847.
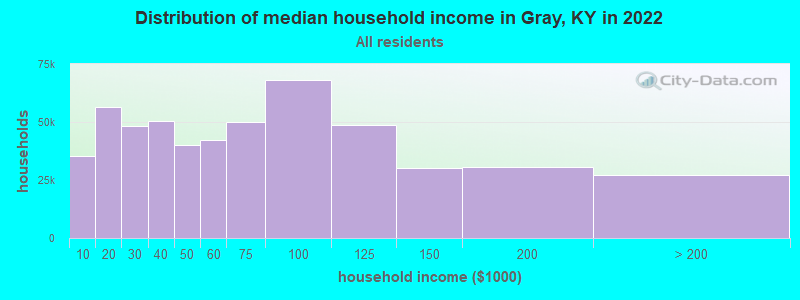
Income statistics for all residents
Median household income in Gray, KY in 2022:| Gray: | $38,016 |
| State: | $59,341 |
Change in median household income between 2000 and 2022:| Gray, Kentucky: | +76.5% |
| Kentucky: | +76.2% |
Number of households with income < $10k:| Gray: | 6.8% (39,394) |
| State: | 6.8% (123,697) |
Number of households with income $10k - 20k:| Gray: | 10.0% (58,515) |
| Kentucky: | 10.0% (182,645) |
Number of households with income $20k - 30k:| Gray: | 9.0% (52,355) |
| Kentucky: | 9.0% (164,092) |
Number of households with income $30k - 40k:| Gray: | 9.1% (53,003) |
| State: | 9.1% (165,607) |
Number of households with income $40k - 50k:| Gray: | 8.0% (46,415) |
| State: | 8.0% (146,315) |
Number of households with income $50k - 60k:| Gray: | 7.7% (44,987) |
| State: | 7.7% (140,671) |
Number of households with income $60k - 75k:| Gray: | 9.8% (57,182) |
| State: | 9.8% (180,002) |
Number of households with income $75k - 100k:| Gray: | 12.6% (73,496) |
| Kentucky: | 12.6% (230,239) |
Number of households with income $100k - 125k:| Gray: | 9.0% (52,481) |
| Kentucky: | 9.0% (164,398) |
Number of households with income $125k - 150k:| Gray: | 5.9% (34,514) |
| Kentucky: | 5.9% (108,602) |
Number of households with income $150k - 200k:| Gray: | 6.1% (35,756) |
| State: | 6.2% (112,813) |
Number of households with income > $200k:| Gray: | 5.9% (34,513) |
| State: | 6.0% (109,599) |
Aggregate household income in Gray in 2022: $1,151,518,024
Median family income in Gray in 2022:| Gray: | $44,262 |
| State: | $76,119 |
Median non-family income in Gray in 2022:| Gray: | $20,984 |
| State: | $33,993 |
Change in median non-family income between 2000 and 2022:| Gray, Kentucky: | +80.5% |
| State: | +79.2% |
Median per capita income in Gray in 2022:| Gray: | $20,456 |
| Kentucky: | $33,980 |
Change in median per capita income between 2000 and 2022:| Gray, Kentucky: | +88.6% |
| State: | +87.8% |
Income statistics for White residents
Median household income in Gray, KY in 2022:| Gray: | $37,797 |
| Kentucky: | $60,987 |
Change in median household income between 2000 and 2022:| Gray, Kentucky: | +76.6% |
| Kentucky: | +76.2% |
Number of households with income < $10k:| Gray: | 6.2% (30,186) |
| Kentucky: | 6.2% (96,690) |
Number of households with income $10k - 20k:| Gray: | 9.8% (47,407) |
| Kentucky: | 9.7% (151,125) |
Number of households with income $20k - 30k:| Gray: | 9.0% (43,510) |
| State: | 8.9% (139,532) |
Number of households with income $30k - 40k:| Gray: | 9.1% (44,422) |
| State: | 9.1% (142,284) |
Number of households with income $40k - 50k:| Gray: | 7.7% (37,433) |
| Kentucky: | 7.7% (121,151) |
Number of households with income $50k - 60k:| Gray: | 7.7% (37,442) |
| Kentucky: | 7.7% (119,790) |
Number of households with income $60k - 75k:| Gray: | 9.8% (47,672) |
| State: | 9.9% (154,174) |
Number of households with income $75k - 100k:| Gray: | 12.8% (62,116) |
| State: | 12.8% (199,740) |
Number of households with income $100k - 125k:| Gray: | 9.4% (45,414) |
| State: | 9.4% (146,284) |
Number of households with income $125k - 150k:| Gray: | 6.0% (29,101) |
| State: | 6.0% (94,180) |
Number of households with income $150k - 200k:| Gray: | 6.4% (30,980) |
| State: | 6.4% (100,702) |
Number of households with income > $200k:| Gray: | 6.2% (29,982) |
| State: | 6.3% (98,502) |
Aggregate household income in Gray in 2022: $994,636,307
Median family income in Gray in 2022:| Gray: | $44,885 |
| Kentucky: | $78,353 |
Number of families with income < $10k:| Gray: | 15.8% (93) |
| State: | 3.7% (37,075) |
Number of families with income $10k - 20k:| Gray: | 13.0% (77) |
| State: | 4.9% (49,864) |
Number of families with income $20k - 30k:| Gray: | 11.1% (66) |
| State: | 6.4% (64,043) |
Number of families with income $30k - 40k:| Gray: | 12.5% (74) |
| Kentucky: | 8.0% (81,080) |
Number of families with income $40k - 50k:| Gray: | 8.7% (52) |
| State: | 6.9% (69,099) |
Number of families with income $50k - 60k:| Gray: | 4.1% (24) |
| Kentucky: | 7.2% (72,955) |
Number of families with income $60k - 75k:| Gray: | 7.8% (46) |
| State: | 10.4% (104,587) |
Number of families with income $75k - 100k:| Gray: | 13.6% (80) |
| Kentucky: | 15.0% (151,545) |
Number of families with income $100k - 125k:| Gray: | 3.6% (21) |
| State: | 11.9% (120,340) |
Number of families with income $125k - 150k:| Gray: | 4.8% (29) |
| State: | 8.1% (81,620) |
Number of families with income > $200k:| Gray: | 5.0% (30) |
| Kentucky: | 8.6% (86,849) |
Median non-family income in Gray in 2022:| Gray: | $20,213 |
| State: | $34,415 |
Change in median non-family income between 2000 and 2022:| Gray, Kentucky: | +79.7% |
| State: | +78.3% |
Median per capita income in Gray in 2022:| Gray: | $20,715 |
| Kentucky: | $35,352 |
Change in median per capita income between 2000 and 2022:| Gray, Kentucky: | +90.9% |
| State: | +90.2% |
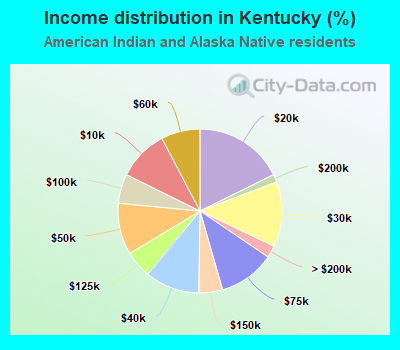
Income statistics for American Indian and Alaska Native residents
Median household income in Gray, KY in 2022:| Gray: | $84,437 |
| Kentucky: | $43,531 |
Change in median household income between 2000 and 2022:| Gray, Kentucky: | +82.6% |
| State: | +82.6% |
Number of households with income < $10k:| Gray: | 8.4% (131,515) |
| Kentucky: | 10.0% (217) |
Number of households with income $10k - 20k:| Gray: | 9.4% (146,767) |
| State: | 17.7% (385) |
Number of households with income $20k - 30k:| Gray: | 8.5% (132,753) |
| State: | 12.8% (279) |
Number of households with income $30k - 40k:| Gray: | 9.1% (142,228) |
| Kentucky: | 10.8% (234) |
Number of households with income $40k - 50k:| Gray: | 8.3% (130,461) |
| State: | 10.2% (221) |
Number of households with income $50k - 60k:| Gray: | 7.8% (123,014) |
| State: | 7.7% (167) |
Number of households with income $60k - 75k:| Gray: | 9.8% (153,331) |
| State: | 11.1% (241) |
Number of households with income $75k - 100k:| Gray: | 12.6% (197,926) |
| Kentucky: | 5.8% (126) |
Number of households with income $100k - 125k:| Gray: | 9.4% (148,009) |
| Kentucky: | 5.3% (116) |
Number of households with income $125k - 150k:| Gray: | 5.6% (88,612) |
| State: | 4.7% (102) |
Number of households with income $150k - 200k:| Gray: | 6.0% (93,414) |
| State: | 1.5% (33) |
Number of households with income > $200k:| Gray: | 5.2% (80,856) |
| State: | 2.4% (52) |
Aggregate household income in Gray in 2022: $205,971
Median non-family income in Gray in 2022:| Gray: | $84,845 |
| State: | $19,286 |
Change in median non-family income between 2000 and 2022:| Gray, Kentucky: | +83.4% |
| Kentucky: | +36.6% |
Median per capita income in Gray in 2022:| Gray: | $35,080 |
| State: | $18,045 |
Change in median per capita income between 2000 and 2022:| Gray, Kentucky: | +29.9% |
| State: | +26.9% |
Income statistics for Multirace residents
Number of households with income < $10k:| Gray: | 8.3% (962) |
| State: | 8.3% (6,780) |
Number of households with income $10k - 20k:| Gray: | 11.0% (1,269) |
| State: | 11.0% (9,005) |
Number of households with income $20k - 30k:| Gray: | 8.6% (995) |
| State: | 8.6% (7,004) |
Number of households with income $30k - 40k:| Gray: | 9.0% (1,045) |
| Kentucky: | 9.0% (7,406) |
Number of households with income $40k - 50k:| Gray: | 8.2% (949) |
| State: | 8.2% (6,707) |
Number of households with income $50k - 60k:| Gray: | 7.4% (857) |
| State: | 7.4% (6,048) |
Number of households with income $60k - 75k:| Gray: | 11.2% (1,302) |
| Kentucky: | 11.2% (9,202) |
Number of households with income $75k - 100k:| Gray: | 11.9% (1,383) |
| State: | 11.9% (9,767) |
Number of households with income $100k - 125k:| Gray: | 7.1% (824) |
| State: | 7.1% (5,846) |
Number of households with income $125k - 150k:| Gray: | 6.9% (802) |
| Kentucky: | 6.9% (5,667) |
Number of households with income $150k - 200k:| Gray: | 5.1% (590) |
| State: | 5.1% (4,171) |
Number of households with income > $200k:| Gray: | 5.2% (602) |
| State: | 5.2% (4,241) |
Median per capita income in Gray in 2022:
Change in median per capita income between 2000 and 2022:| Gray, Kentucky: | +131.8% |
| State: | +132.3% |