Gorham, Illinois (IL) income map, earnings map, and wages data

Data:
The per capita income in 2022 was $13,990, which means an increase of 16.1% compared to 2000 when it was $11,739.
Whole page based on the data from 2000 / 2022 when the population of Gorham, Illinois was 256 / 299
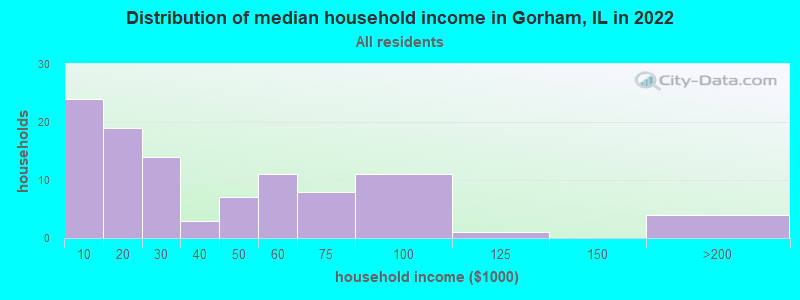
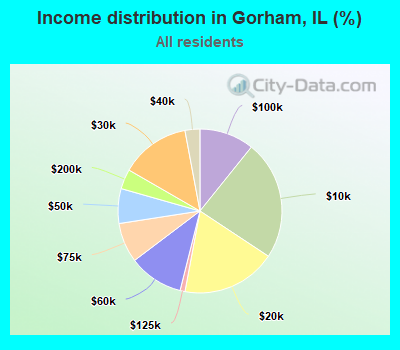
Income statistics for all residents
Number of households with income < $10k:| Gorham: | 23.5% (24) |
| Illinois: | 5.9% (296,090) |
Number of households with income $10k - 20k:| Gorham: | 18.6% (19) |
| State: | 6.6% (333,259) |
Number of households with income $20k - 30k:| Gorham: | 13.7% (14) |
| State: | 6.8% (342,921) |
Number of households with income $30k - 40k:| Gorham: | 2.9% (3) |
| State: | 7.0% (355,254) |
Number of households with income $40k - 50k:| Gorham: | 6.9% (7) |
| State: | 6.7% (340,678) |
Number of households with income $50k - 60k:| Gorham: | 10.8% (11) |
| Illinois: | 6.7% (339,405) |
Number of households with income $60k - 75k:| Gorham: | 7.8% (8) |
| Illinois: | 9.2% (465,709) |
Number of households with income $75k - 100k:| Gorham: | 10.8% (11) |
| State: | 12.9% (651,353) |
Number of households with income $100k - 125k:| Gorham: | 1.0% (1) |
| Illinois: | 10.3% (522,359) |
Number of households with income $125k - 150k:| Gorham: | 0.0% (0) |
| Illinois: | 7.3% (367,136) |
Number of households with income $150k - 200k:| Gorham: | 3.9% (4) |
| State: | 9.0% (455,249) |
Number of households with income > $200k:| Gorham: | 0.0% (0) |
| Illinois: | 11.6% (586,947) |
Aggregate household income in Gorham in 2022: $3,916,303
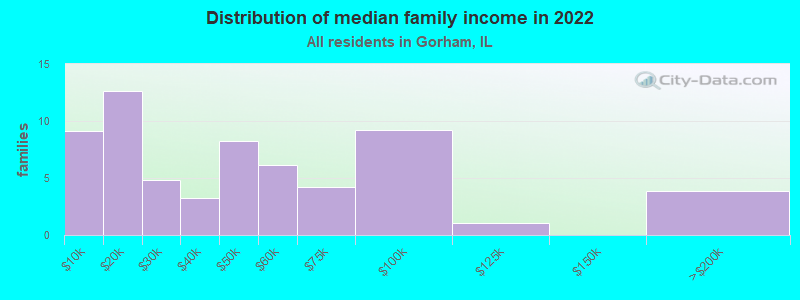
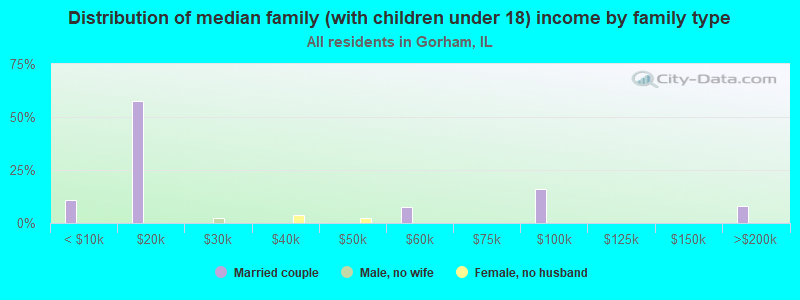
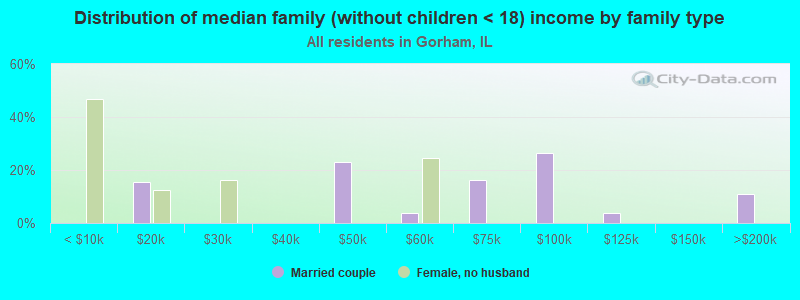
Median family income in Gorham in 2022:| Gorham: | $40,307 |
| Illinois: | $96,948 |
Number of families with income < $10k:| Gorham: | 14.6% (9) |
| State: | 3.4% (105,875) |
Number of families with income $10k - 20k:| Gorham: | 20.2% (13) |
| State: | 3.3% (105,017) |
Number of families with income $20k - 30k:| Gorham: | 7.7% (5) |
| State: | 4.7% (146,403) |
Number of families with income $30k - 40k:| Gorham: | 5.2% (3) |
| Illinois: | 5.3% (167,069) |
Number of families with income $40k - 50k:| Gorham: | 13.2% (8) |
| Illinois: | 5.8% (181,164) |
Number of families with income $50k - 60k:| Gorham: | 9.8% (6) |
| State: | 6.1% (191,561) |
Number of families with income $60k - 75k:| Gorham: | 6.8% (4) |
| State: | 9.0% (282,985) |
Number of families with income $75k - 100k:| Gorham: | 14.7% (9) |
| State: | 13.8% (432,725) |
Number of families with income $100k - 125k:| Gorham: | 1.6% (1) |
| Illinois: | 11.9% (373,296) |
Number of families with income $150k - 200k:| Gorham: | 6.2% (4) |
| State: | 11.9% (372,004) |
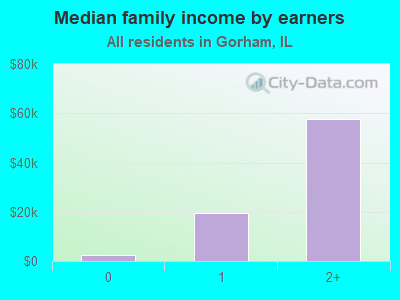
Median income for 2 person families:| Gorham: | $44,744 |
| Illinois: | $83,024 |
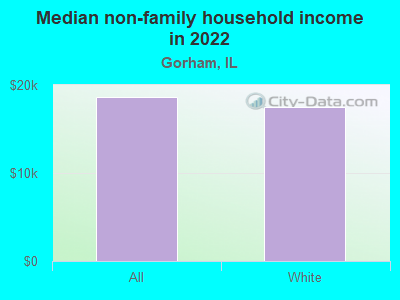
Median non-family income in Gorham in 2022:| Gorham: | $18,693 |
| State: | $46,533 |
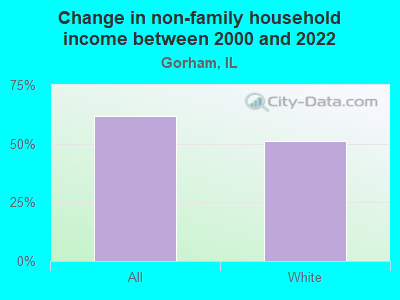
Change in median non-family income between 2000 and 2022:| Gorham, Illinois: | +61.7% |
| Illinois: | +64.0% |
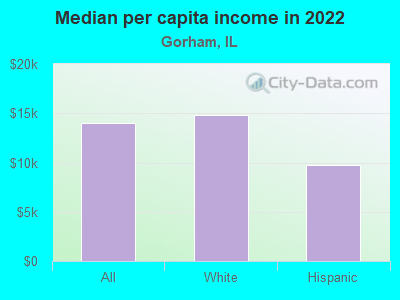
Median per capita income in Gorham in 2022:| Gorham: | $13,990 |
| State: | $43,317 |
Change in median per capita income between 2000 and 2022:| Gorham, Illinois: | +19.2% |
| State: | +87.5% |
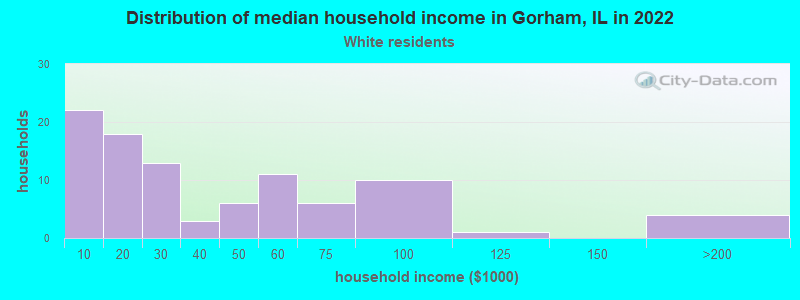
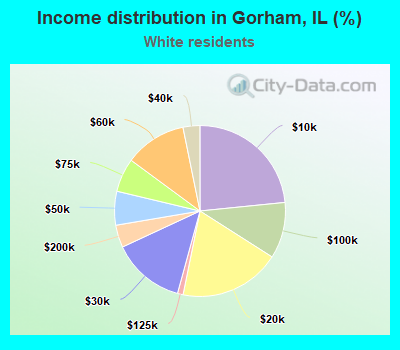
Income statistics for White residents
Number of households with income < $10k:| Gorham: | 23.4% (22) |
| State: | 4.5% (149,895) |
Number of households with income $10k - 20k:| Gorham: | 19.1% (18) |
| Illinois: | 5.5% (184,529) |
Number of households with income $20k - 30k:| Gorham: | 13.8% (13) |
| Illinois: | 6.1% (205,767) |
Number of households with income $30k - 40k:| Gorham: | 3.2% (3) |
| Illinois: | 6.7% (225,572) |
Number of households with income $40k - 50k:| Gorham: | 6.4% (6) |
| State: | 6.5% (216,965) |
Number of households with income $50k - 60k:| Gorham: | 11.7% (11) |
| Illinois: | 6.6% (222,841) |
Number of households with income $60k - 75k:| Gorham: | 6.4% (6) |
| State: | 9.3% (312,758) |
Number of households with income $75k - 100k:| Gorham: | 10.6% (10) |
| State: | 12.9% (433,180) |
Number of households with income $100k - 125k:| Gorham: | 1.1% (1) |
| State: | 10.7% (360,753) |
Number of households with income $125k - 150k:| Gorham: | 0.0% (0) |
| State: | 7.9% (266,532) |
Number of households with income $150k - 200k:| Gorham: | 4.3% (4) |
| Illinois: | 10.0% (337,357) |
Number of households with income > $200k:| Gorham: | 0.0% (0) |
| Illinois: | 13.3% (446,069) |
Aggregate household income in Gorham in 2022: $3,598,349
Median family income in Gorham in 2022:| Gorham: | $40,427 |
| State: | $107,938 |
Number of families with income < $10k:| Gorham: | 15.5% (9) |
| State: | 2.2% (45,983) |
Number of families with income $10k - 20k:| Gorham: | 20.6% (12) |
| State: | 2.5% (50,574) |
Number of families with income $20k - 30k:| Gorham: | 7.6% (4) |
| Illinois: | 3.5% (70,927) |
Number of families with income $30k - 40k:| Gorham: | 5.3% (3) |
| State: | 4.4% (90,563) |
Number of families with income $40k - 50k:| Gorham: | 12.8% (7) |
| State: | 5.0% (102,597) |
Number of families with income $50k - 60k:| Gorham: | 10.2% (6) |
| State: | 5.8% (119,129) |
Number of families with income $60k - 75k:| Gorham: | 5.2% (3) |
| Illinois: | 8.8% (179,665) |
Number of families with income $75k - 100k:| Gorham: | 14.7% (8) |
| Illinois: | 13.5% (276,887) |
Number of families with income $100k - 125k:| Gorham: | 1.7% (1) |
| State: | 12.5% (256,099) |
Number of families with income $150k - 200k:| Gorham: | 6.4% (4) |
| State: | 13.4% (274,569) |
Median non-family income in Gorham in 2022:| Gorham: | $17,486 |
| State: | $50,934 |
Change in median non-family income between 2000 and 2022:| Gorham, Illinois: | +51.2% |
| State: | +70.7% |
Median per capita income in Gorham in 2022:| Gorham: | $14,866 |
| Illinois: | $50,738 |
Change in median per capita income between 2000 and 2022:| Gorham, Illinois: | +25.6% |
| Illinois: | +95.5% |
Income statistics for Hispanic or Latino residents
Aggregate household income in Gorham in 2022: $259,682
Median per capita income in Gorham in 2022:| Gorham: | $9,702 |
| State: | $26,551 |