Goldsmith-Penwell, Texas (TX) income map, earnings map, and wages data
The median household income in Goldsmith-Penwell, TX in 2022 was $68,398, which was 5.7% less than the median annual income of $72,284 across the entire state of Texas. Compared to the median income of $31,302 in 2000 this represents an increase of 54.2%. The per capita income in 2022 was $25,974, which means an increase of 54.2% compared to 2000 when it was $11,894.
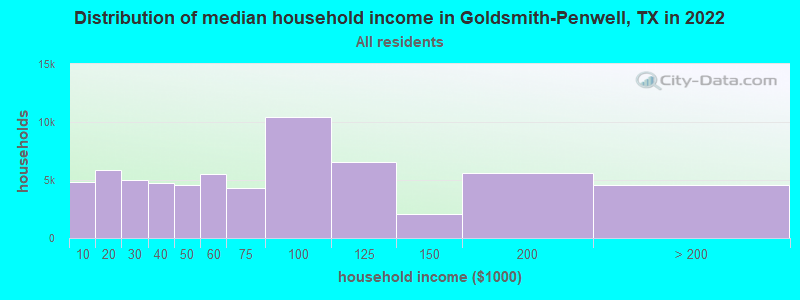
Income statistics for all residents
Median household income in Goldsmith-Penwell, TX in 2022:| Goldsmith-Penwell: | $68,399 |
| State: | $72,284 |
Change in median household income between 2000 and 2022:| Goldsmith-Penwell, Texas: | +118.5% |
| State: | +81.0% |
Number of households with income < $10k:| Goldsmith-Penwell: | 7.5% (4,831) |
| Texas: | 5.5% (611,011) |
Number of households with income $10k - 20k:| Goldsmith-Penwell: | 9.2% (5,895) |
| Texas: | 6.7% (743,157) |
Number of households with income $20k - 30k:| Goldsmith-Penwell: | 7.9% (5,035) |
| State: | 7.2% (803,381) |
Number of households with income $30k - 40k:| Goldsmith-Penwell: | 7.4% (4,726) |
| State: | 7.8% (866,080) |
Number of households with income $40k - 50k:| Goldsmith-Penwell: | 7.1% (4,535) |
| Texas: | 7.3% (810,440) |
Number of households with income $50k - 60k:| Goldsmith-Penwell: | 8.6% (5,534) |
| Texas: | 7.2% (799,783) |
Number of households with income $60k - 75k:| Goldsmith-Penwell: | 6.7% (4,280) |
| State: | 9.9% (1,095,384) |
Number of households with income $75k - 100k:| Goldsmith-Penwell: | 16.3% (10,462) |
| Texas: | 12.8% (1,419,057) |
Number of households with income $100k - 125k:| Goldsmith-Penwell: | 10.2% (6,536) |
| State: | 9.5% (1,054,577) |
Number of households with income $125k - 150k:| Goldsmith-Penwell: | 3.2% (2,055) |
| State: | 6.7% (741,518) |
Number of households with income $150k - 200k:| Goldsmith-Penwell: | 8.7% (5,592) |
| State: | 8.7% (961,776) |
Number of households with income > $200k:| Goldsmith-Penwell: | 7.1% (4,565) |
| State: | 10.7% (1,181,544) |
Aggregate household income in Goldsmith-Penwell in 2022: $714,778,484
Median family income in Goldsmith-Penwell in 2022:| Goldsmith-Penwell: | $72,829 |
| State: | $86,267 |
Median non-family income in Goldsmith-Penwell in 2022:| Goldsmith-Penwell: | $32,475 |
| Texas: | $45,999 |
Change in median non-family income between 2000 and 2022:| Goldsmith-Penwell, Texas: | +140.1% |
| State: | +79.5% |
Median per capita income in Goldsmith-Penwell in 2022:| Goldsmith-Penwell: | $25,974 |
| Texas: | $38,123 |
Change in median per capita income between 2000 and 2022:| Goldsmith-Penwell, Texas: | +118.4% |
| State: | +94.3% |
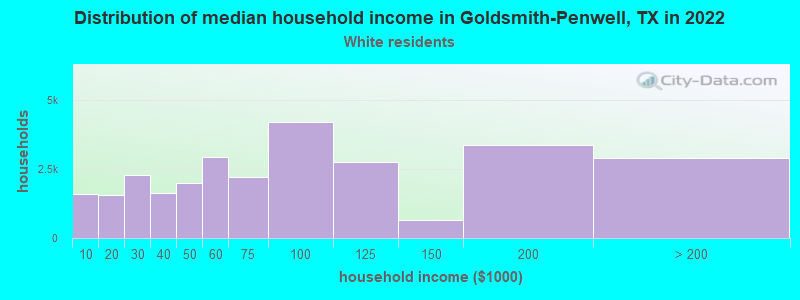
Income statistics for White residents
Median household income in Goldsmith-Penwell, TX in 2022:| Goldsmith-Penwell: | $73,149 |
| Texas: | $82,032 |
Change in median household income between 2000 and 2022:| Goldsmith-Penwell, Texas: | +126.0% |
| State: | +91.0% |
Number of households with income < $10k:| Goldsmith-Penwell: | 5.7% (1,578) |
| Texas: | 4.7% (273,716) |
Number of households with income $10k - 20k:| Goldsmith-Penwell: | 5.5% (1,539) |
| Texas: | 5.5% (322,702) |
Number of households with income $20k - 30k:| Goldsmith-Penwell: | 8.1% (2,260) |
| Texas: | 6.2% (363,947) |
Number of households with income $30k - 40k:| Goldsmith-Penwell: | 5.8% (1,620) |
| Texas: | 6.8% (399,275) |
Number of households with income $40k - 50k:| Goldsmith-Penwell: | 7.1% (1,972) |
| State: | 6.5% (383,417) |
Number of households with income $50k - 60k:| Goldsmith-Penwell: | 10.5% (2,940) |
| State: | 6.6% (388,535) |
Number of households with income $60k - 75k:| Goldsmith-Penwell: | 7.9% (2,200) |
| State: | 9.7% (566,295) |
Number of households with income $75k - 100k:| Goldsmith-Penwell: | 15.0% (4,191) |
| State: | 13.0% (760,276) |
Number of households with income $100k - 125k:| Goldsmith-Penwell: | 9.8% (2,732) |
| State: | 10.2% (597,596) |
Number of households with income $125k - 150k:| Goldsmith-Penwell: | 2.3% (637) |
| Texas: | 7.4% (436,830) |
Number of households with income $150k - 200k:| Goldsmith-Penwell: | 12.0% (3,357) |
| State: | 9.9% (583,067) |
Number of households with income > $200k:| Goldsmith-Penwell: | 10.3% (2,873) |
| State: | 13.5% (792,647) |
Aggregate household income in Goldsmith-Penwell in 2022: $365,460,414
Median family income in Goldsmith-Penwell in 2022:| Goldsmith-Penwell: | $76,847 |
| State: | $101,788 |
Number of families with income < $10k:| Goldsmith-Penwell: | 6.3% (134) |
| Texas: | 2.8% (108,142) |
Number of families with income $10k - 20k:| Goldsmith-Penwell: | 7.2% (154) |
| State: | 2.9% (113,421) |
Number of families with income $20k - 30k:| Goldsmith-Penwell: | 10.6% (226) |
| State: | 4.1% (157,688) |
Number of families with income $30k - 40k:| Goldsmith-Penwell: | 1.8% (38) |
| State: | 5.2% (198,847) |
Number of families with income $40k - 50k:| Goldsmith-Penwell: | 18.0% (384) |
| Texas: | 5.6% (216,490) |
Number of families with income $50k - 60k:| Goldsmith-Penwell: | 14.1% (302) |
| State: | 5.7% (220,689) |
Number of families with income $60k - 75k:| Goldsmith-Penwell: | 10.1% (216) |
| State: | 9.0% (346,106) |
Number of families with income $75k - 100k:| Goldsmith-Penwell: | 16.6% (355) |
| State: | 13.7% (527,363) |
Number of families with income $100k - 125k:| Goldsmith-Penwell: | 2.7% (57) |
| Texas: | 11.6% (448,411) |
Number of families with income $125k - 150k:| Goldsmith-Penwell: | 1.8% (38) |
| State: | 9.2% (355,798) |
Number of families with income $150k - 200k:| Goldsmith-Penwell: | 3.2% (68) |
| State: | 12.5% (480,185) |
Number of families with income > $200k:| Goldsmith-Penwell: | 7.7% (165) |
| State: | 17.6% (677,490) |
Median non-family income in Goldsmith-Penwell in 2022:| Goldsmith-Penwell: | $37,898 |
| Texas: | $50,587 |
Median per capita income in Goldsmith-Penwell in 2022:| Goldsmith-Penwell: | $32,345 |
| Texas: | $47,740 |
Change in median per capita income between 2000 and 2022:| Goldsmith-Penwell, Texas: | +141.9% |
| State: | +114.3% |
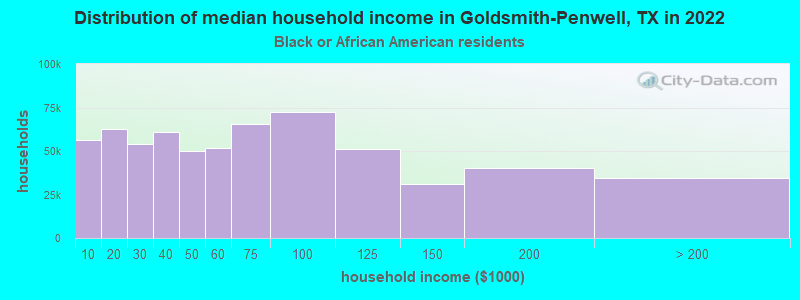
Income statistics for Black or African American residents
Median household income in Goldsmith-Penwell, TX in 2022:| Goldsmith-Penwell: | $86,112 |
| State: | $55,759 |
Number of households with income < $10k:| Goldsmith-Penwell: | 8.9% (56,059) |
| State: | 8.9% (126,378) |
Number of households with income $10k - 20k:| Goldsmith-Penwell: | 9.9% (62,674) |
| State: | 9.9% (140,369) |
Number of households with income $20k - 30k:| Goldsmith-Penwell: | 8.5% (53,921) |
| State: | 8.5% (120,639) |
Number of households with income $30k - 40k:| Goldsmith-Penwell: | 9.7% (60,964) |
| State: | 9.7% (137,517) |
Number of households with income $40k - 50k:| Goldsmith-Penwell: | 7.9% (50,082) |
| Texas: | 8.0% (112,973) |
Number of households with income $50k - 60k:| Goldsmith-Penwell: | 8.2% (51,895) |
| Texas: | 8.3% (117,156) |
Number of households with income $60k - 75k:| Goldsmith-Penwell: | 10.4% (65,510) |
| State: | 10.4% (147,462) |
Number of households with income $75k - 100k:| Goldsmith-Penwell: | 11.5% (72,334) |
| State: | 11.5% (162,718) |
Number of households with income $100k - 125k:| Goldsmith-Penwell: | 8.1% (51,358) |
| State: | 8.2% (115,829) |
Number of households with income $125k - 150k:| Goldsmith-Penwell: | 4.9% (31,122) |
| State: | 4.9% (69,556) |
Number of households with income $150k - 200k:| Goldsmith-Penwell: | 6.4% (40,308) |
| State: | 6.4% (90,701) |
Number of households with income > $200k:| Goldsmith-Penwell: | 5.5% (34,630) |
| Texas: | 5.5% (77,988) |
Aggregate household income in Goldsmith-Penwell in 2022: $3,301,186
Median family income in Goldsmith-Penwell in 2022:| Goldsmith-Penwell: | $92,746 |
| Texas: | $69,134 |
Number of families with income < $10k:| Goldsmith-Penwell: | 14.6% (4) |
| State: | 6.8% (55,625) |
Number of families with income $20k - 30k:| Goldsmith-Penwell: | 35.6% (11) |
| Texas: | 7.1% (57,877) |
Number of families with income $60k - 75k:| Goldsmith-Penwell: | 49.7% (15) |
| State: | 10.1% (81,994) |
Median non-family income in Goldsmith-Penwell in 2022:| Goldsmith-Penwell: | $56,774 |
| Texas: | $40,133 |
Median per capita income in Goldsmith-Penwell in 2022:| Goldsmith-Penwell: | $16,421 |
| State: | $30,490 |
Change in median per capita income between 2000 and 2022:| Goldsmith-Penwell, Texas: | +94.3% |
| State: | +113.9% |
Income statistics for Asian residents
Number of households with income < $10k:| Goldsmith-Penwell: | 5.2% (3,565) |
| State: | 5.2% (29,885) |
Number of households with income $10k - 20k:| Goldsmith-Penwell: | 4.7% (3,226) |
| State: | 4.7% (27,044) |
Number of households with income $20k - 30k:| Goldsmith-Penwell: | 4.1% (2,787) |
| State: | 4.1% (23,363) |
Number of households with income $30k - 40k:| Goldsmith-Penwell: | 4.1% (2,781) |
| Texas: | 4.1% (23,309) |
Number of households with income $40k - 50k:| Goldsmith-Penwell: | 5.2% (3,558) |
| State: | 5.2% (29,826) |
Number of households with income $50k - 60k:| Goldsmith-Penwell: | 4.7% (3,163) |
| Texas: | 4.7% (26,512) |
Number of households with income $60k - 75k:| Goldsmith-Penwell: | 6.5% (4,403) |
| State: | 6.5% (36,905) |
Number of households with income $75k - 100k:| Goldsmith-Penwell: | 11.3% (7,677) |
| State: | 11.3% (64,350) |
Number of households with income $100k - 125k:| Goldsmith-Penwell: | 11.4% (7,720) |
| Texas: | 11.4% (64,714) |
Number of households with income $125k - 150k:| Goldsmith-Penwell: | 9.3% (6,289) |
| State: | 9.3% (52,719) |
Number of households with income $150k - 200k:| Goldsmith-Penwell: | 12.5% (8,465) |
| Texas: | 12.5% (70,953) |
Number of households with income > $200k:| Goldsmith-Penwell: | 21.1% (14,347) |
| State: | 21.1% (120,260) |
Median per capita income in Goldsmith-Penwell in 2022:| Goldsmith-Penwell: | $5,828 |
| Texas: | $48,626 |
Change in median per capita income between 2000 and 2022:| Goldsmith-Penwell, Texas: | +16.6% |
| State: | +132.0% |
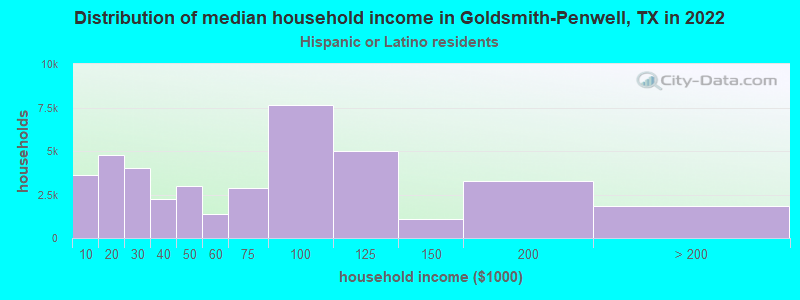
Income statistics for Hispanic or Latino residents
Median household income in Goldsmith-Penwell, TX in 2022:| Goldsmith-Penwell: | $74,574 |
| State: | $60,504 |
Number of households with income < $10k:| Goldsmith-Penwell: | 8.9% (3,640) |
| State: | 5.8% (213,953) |
Number of households with income $10k - 20k:| Goldsmith-Penwell: | 11.7% (4,749) |
| Texas: | 8.0% (297,456) |
Number of households with income $20k - 30k:| Goldsmith-Penwell: | 9.8% (4,006) |
| State: | 9.2% (340,166) |
Number of households with income $30k - 40k:| Goldsmith-Penwell: | 5.5% (2,246) |
| Texas: | 9.5% (354,336) |
Number of households with income $40k - 50k:| Goldsmith-Penwell: | 7.3% (2,973) |
| State: | 8.8% (327,013) |
Number of households with income $50k - 60k:| Goldsmith-Penwell: | 3.4% (1,395) |
| Texas: | 8.3% (308,818) |
Number of households with income $60k - 75k:| Goldsmith-Penwell: | 7.1% (2,876) |
| Texas: | 10.9% (405,109) |
Number of households with income $75k - 100k:| Goldsmith-Penwell: | 18.8% (7,648) |
| State: | 13.8% (511,639) |
Number of households with income $100k - 125k:| Goldsmith-Penwell: | 12.2% (4,975) |
| State: | 8.6% (319,728) |
Number of households with income $125k - 150k:| Goldsmith-Penwell: | 2.7% (1,080) |
| State: | 5.7% (210,932) |
Number of households with income $150k - 200k:| Goldsmith-Penwell: | 8.0% (3,255) |
| State: | 6.4% (236,055) |
Number of households with income > $200k:| Goldsmith-Penwell: | 4.5% (1,830) |
| Texas: | 5.1% (189,259) |
Aggregate household income in Goldsmith-Penwell in 2022: $510,120,900
Median family income in Goldsmith-Penwell in 2022:| Goldsmith-Penwell: | $81,254 |
| State: | $65,080 |
Number of families with income < $10k:| Goldsmith-Penwell: | 17.4% (622) |
| Texas: | 5.3% (147,493) |
Number of families with income $10k - 20k:| Goldsmith-Penwell: | 11.5% (411) |
| State: | 6.3% (174,531) |
Number of families with income $20k - 30k:| Goldsmith-Penwell: | 13.0% (464) |
| State: | 8.6% (238,528) |
Number of families with income $30k - 40k:| Goldsmith-Penwell: | 8.4% (300) |
| State: | 9.1% (251,999) |
Number of families with income $40k - 50k:| Goldsmith-Penwell: | 10.1% (361) |
| State: | 8.6% (240,188) |
Number of families with income $50k - 60k:| Goldsmith-Penwell: | 4.1% (146) |
| Texas: | 8.0% (223,566) |
Number of families with income $60k - 75k:| Goldsmith-Penwell: | 5.9% (209) |
| State: | 10.9% (302,688) |
Number of families with income $75k - 100k:| Goldsmith-Penwell: | 21.0% (751) |
| Texas: | 14.3% (398,554) |
Number of families with income $100k - 125k:| Goldsmith-Penwell: | 2.6% (92) |
| State: | 9.5% (264,007) |
Number of families with income $125k - 150k:| Goldsmith-Penwell: | 2.1% (76) |
| Texas: | 6.2% (171,274) |
Number of families with income $150k - 200k:| Goldsmith-Penwell: | 2.4% (86) |
| State: | 7.3% (202,259) |
Number of families with income > $200k:| Goldsmith-Penwell: | 1.4% (51) |
| State: | 5.9% (165,129) |
Median non-family income in Goldsmith-Penwell in 2022:| Goldsmith-Penwell: | $29,706 |
| State: | $39,934 |
Median per capita income in Goldsmith-Penwell in 2022:| Goldsmith-Penwell: | $23,112 |
| State: | $24,862 |
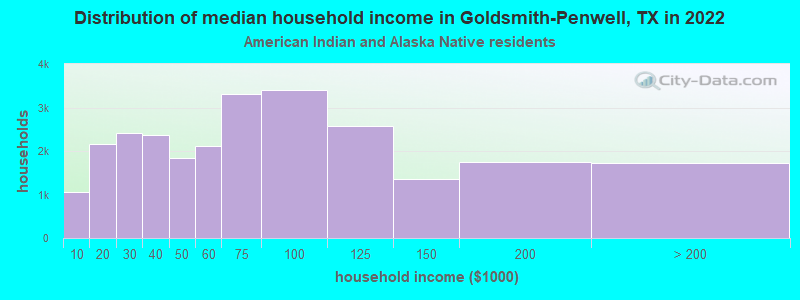
Income statistics for American Indian and Alaska Native residents
Median household income in Goldsmith-Penwell, TX in 2022:| Goldsmith-Penwell: | $42,107 |
| State: | $65,765 |
Change in median household income between 2000 and 2022:| Goldsmith-Penwell, Texas: | +93.7% |
| State: | +88.3% |
Number of households with income < $10k:| Goldsmith-Penwell: | 4.1% (1,059) |
| State: | 4.1% (3,398) |
Number of households with income $10k - 20k:| Goldsmith-Penwell: | 8.3% (2,166) |
| State: | 8.3% (6,949) |
Number of households with income $20k - 30k:| Goldsmith-Penwell: | 9.3% (2,414) |
| Texas: | 9.3% (7,742) |
Number of households with income $30k - 40k:| Goldsmith-Penwell: | 9.1% (2,375) |
| Texas: | 9.1% (7,627) |
Number of households with income $40k - 50k:| Goldsmith-Penwell: | 7.1% (1,848) |
| State: | 7.1% (5,922) |
Number of households with income $50k - 60k:| Goldsmith-Penwell: | 8.1% (2,108) |
| Texas: | 8.1% (6,761) |
Number of households with income $60k - 75k:| Goldsmith-Penwell: | 12.7% (3,299) |
| State: | 12.7% (10,588) |
Number of households with income $75k - 100k:| Goldsmith-Penwell: | 13.0% (3,399) |
| State: | 13.0% (10,903) |
Number of households with income $100k - 125k:| Goldsmith-Penwell: | 9.9% (2,574) |
| State: | 9.9% (8,256) |
Number of households with income $125k - 150k:| Goldsmith-Penwell: | 5.2% (1,357) |
| State: | 5.2% (4,355) |
Number of households with income $150k - 200k:| Goldsmith-Penwell: | 6.7% (1,751) |
| Texas: | 6.7% (5,623) |
Number of households with income > $200k:| Goldsmith-Penwell: | 6.6% (1,719) |
| State: | 6.6% (5,522) |
Aggregate household income in Goldsmith-Penwell in 2022: $2,318,228
Median family income in Goldsmith-Penwell in 2022:| Goldsmith-Penwell: | $41,448 |
| State: | $72,369 |
Number of families with income $20k - 30k:| Goldsmith-Penwell: | 100.0% (21) |
| State: | 7.3% (4,502) |
Median per capita income in Goldsmith-Penwell in 2022:| Goldsmith-Penwell: | $9,131 |
| State: | $28,166 |
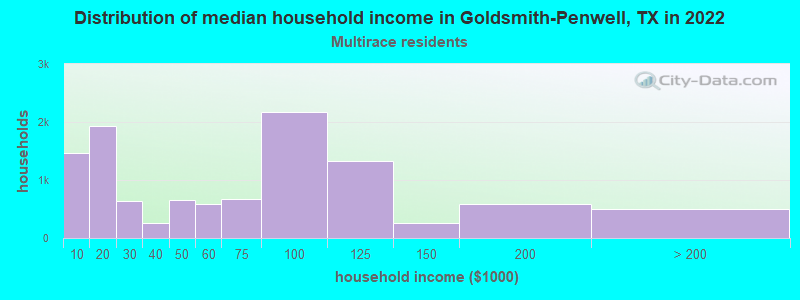
Income statistics for Multirace residents
Median household income in Goldsmith-Penwell, TX in 2022:| Goldsmith-Penwell: | $49,941 |
| Texas: | $62,748 |
Change in median household income between 2000 and 2022:| Goldsmith-Penwell, Texas: | +138.2% |
| Texas: | +92.3% |
Number of households with income < $10k:| Goldsmith-Penwell: | 13.2% (1,465) |
| Texas: | 5.5% (122,324) |
Number of households with income $10k - 20k:| Goldsmith-Penwell: | 17.4% (1,928) |
| State: | 8.2% (182,232) |
Number of households with income $20k - 30k:| Goldsmith-Penwell: | 5.8% (638) |
| State: | 8.5% (189,456) |
Number of households with income $30k - 40k:| Goldsmith-Penwell: | 2.3% (251) |
| Texas: | 8.9% (197,499) |
Number of households with income $40k - 50k:| Goldsmith-Penwell: | 6.0% (660) |
| State: | 8.7% (191,735) |
Number of households with income $50k - 60k:| Goldsmith-Penwell: | 5.4% (594) |
| Texas: | 8.0% (177,535) |
Number of households with income $60k - 75k:| Goldsmith-Penwell: | 6.0% (668) |
| Texas: | 10.5% (232,479) |
Number of households with income $75k - 100k:| Goldsmith-Penwell: | 19.7% (2,179) |
| Texas: | 13.1% (290,448) |
Number of households with income $100k - 125k:| Goldsmith-Penwell: | 12.0% (1,325) |
| State: | 8.6% (191,595) |
Number of households with income $125k - 150k:| Goldsmith-Penwell: | 2.4% (262) |
| State: | 6.0% (133,361) |
Number of households with income $150k - 200k:| Goldsmith-Penwell: | 5.4% (594) |
| State: | 7.2% (159,195) |
Number of households with income > $200k:| Goldsmith-Penwell: | 4.6% (507) |
| Texas: | 6.7% (148,064) |
Aggregate household income in Goldsmith-Penwell in 2022: $119,727,582
Median family income in Goldsmith-Penwell in 2022:| Goldsmith-Penwell: | $62,701 |
| State: | $69,780 |
Number of families with income < $10k:| Goldsmith-Penwell: | 10.7% (210) |
| State: | 4.4% (70,825) |
Number of families with income $10k - 20k:| Goldsmith-Penwell: | 15.2% (300) |
| State: | 5.9% (95,279) |
Number of families with income $20k - 30k:| Goldsmith-Penwell: | 3.8% (74) |
| State: | 7.8% (126,627) |
Number of families with income $30k - 40k:| Goldsmith-Penwell: | 19.1% (375) |
| Texas: | 8.5% (137,626) |
Number of families with income $40k - 50k:| Goldsmith-Penwell: | 3.8% (74) |
| State: | 8.4% (135,809) |
Number of families with income $50k - 60k:| Goldsmith-Penwell: | 17.7% (349) |
| Texas: | 7.9% (127,739) |
Number of families with income $60k - 75k:| Goldsmith-Penwell: | 5.3% (104) |
| Texas: | 10.5% (169,549) |
Number of families with income $150k - 200k:| Goldsmith-Penwell: | 24.5% (483) |
| Texas: | 8.5% (137,607) |
Median non-family income in Goldsmith-Penwell in 2022:| Goldsmith-Penwell: | $12,072 |
| State: | $40,634 |
Change in median non-family income between 2000 and 2022:| Goldsmith-Penwell, Texas: | +93.2% |
| State: | +77.2% |
Median per capita income in Goldsmith-Penwell in 2022:| Goldsmith-Penwell: | $27,810 |
| Texas: | $26,785 |
Income statistics for other residents
Number of households with income < $10k:| Goldsmith-Penwell: | 5.6% (203) |
| Texas: | 5.9% (54,162) |
Number of households with income $10k - 20k:| Goldsmith-Penwell: | 10.5% (381) |
| State: | 6.8% (62,891) |
Number of households with income $20k - 30k:| Goldsmith-Penwell: | 10.5% (380) |
| State: | 10.6% (97,294) |
Number of households with income $30k - 40k:| Goldsmith-Penwell: | 9.5% (344) |
| Texas: | 10.8% (99,670) |
Number of households with income $40k - 50k:| Goldsmith-Penwell: | 9.7% (351) |
| State: | 9.3% (85,548) |
Number of households with income $50k - 60k:| Goldsmith-Penwell: | 4.1% (149) |
| Texas: | 9.0% (82,757) |
Number of households with income $60k - 75k:| Goldsmith-Penwell: | 5.4% (196) |
| Texas: | 10.9% (100,326) |
Number of households with income $75k - 100k:| Goldsmith-Penwell: | 17.3% (630) |
| State: | 14.0% (128,767) |
Number of households with income $100k - 125k:| Goldsmith-Penwell: | 11.0% (400) |
| State: | 8.2% (75,218) |
Number of households with income $125k - 150k:| Goldsmith-Penwell: | 4.3% (157) |
| State: | 4.8% (44,223) |
Number of households with income $150k - 200k:| Goldsmith-Penwell: | 6.8% (247) |
| State: | 5.6% (51,376) |
Number of households with income > $200k:| Goldsmith-Penwell: | 5.3% (194) |
| State: | 4.0% (36,393) |
Aggregate household income in Goldsmith-Penwell in 2022: $287,803,117
Median family income in Goldsmith-Penwell in 2022:| Goldsmith-Penwell: | $81,263 |
| Texas: | $60,064 |
Number of families with income < $10k:| Goldsmith-Penwell: | 7.4% (191) |
| Texas: | 6.8% (47,502) |
Number of families with income $10k - 20k:| Goldsmith-Penwell: | 12.4% (322) |
| State: | 6.0% (41,763) |
Number of families with income $20k - 30k:| Goldsmith-Penwell: | 13.1% (338) |
| Texas: | 9.9% (68,761) |
Number of families with income $30k - 40k:| Goldsmith-Penwell: | 20.1% (521) |
| Texas: | 9.7% (67,685) |
Number of families with income $40k - 50k:| Goldsmith-Penwell: | 4.6% (118) |
| State: | 9.0% (62,441) |
Number of families with income $50k - 60k:| Goldsmith-Penwell: | 2.2% (56) |
| State: | 8.5% (59,321) |
Number of families with income $60k - 75k:| Goldsmith-Penwell: | 5.1% (131) |
| State: | 11.2% (77,588) |
Number of families with income $75k - 100k:| Goldsmith-Penwell: | 24.1% (626) |
| State: | 14.5% (101,032) |
Number of families with income $150k - 200k:| Goldsmith-Penwell: | 11.1% (288) |
| State: | 5.9% (41,211) |
Median non-family income in Goldsmith-Penwell in 2022:| Goldsmith-Penwell: | $29,149 |
| Texas: | $38,690 |
Median per capita income in Goldsmith-Penwell in 2022:| Goldsmith-Penwell: | $23,671 |
| State: | $23,899 |