Gillett, Texas (TX) income map, earnings map, and wages data
The median household income in Gillett, TX in 2022 was $55,307, which was 30.7% less than the median annual income of $72,284 across the entire state of Texas. Compared to the median income of $30,000 in 2000 this represents an increase of 45.8%. The per capita income in 2022 was $38,009, which means an increase of 48.5% compared to 2000 when it was $19,571.
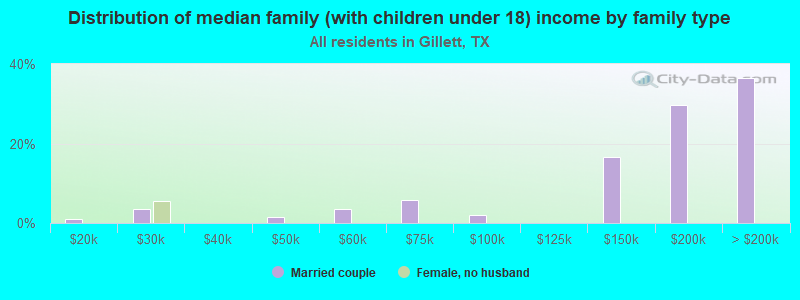
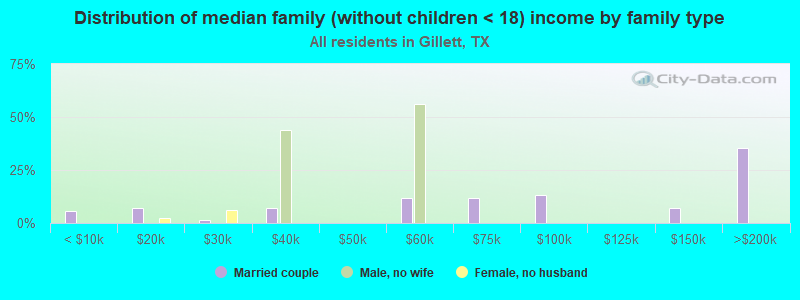
Income statistics for all residents
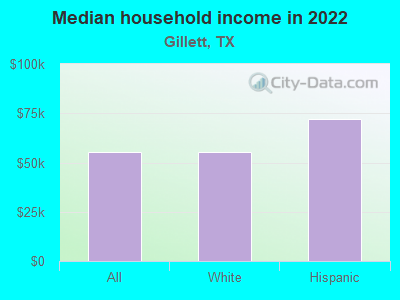
Median household income in Gillett, TX in 2022:| Gillett: | $55,308 |
| State: | $72,284 |
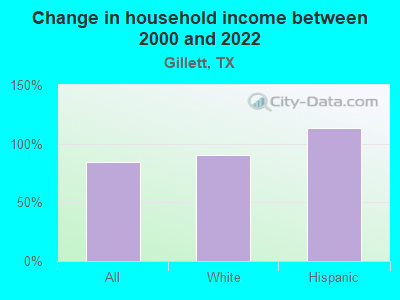
Change in median household income between 2000 and 2022:| Gillett, Texas: | +84.4% |
| State: | +81.0% |
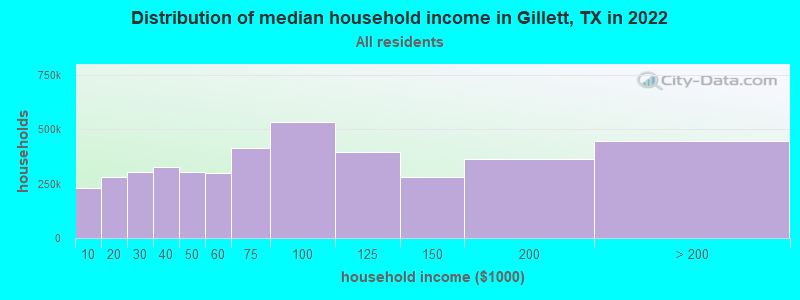
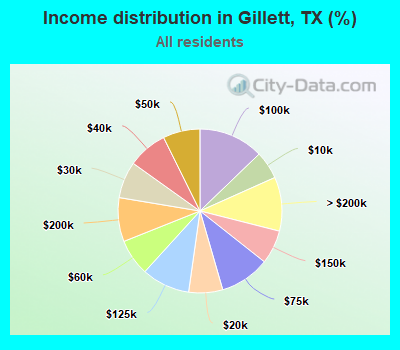
Number of households with income < $10k:| Gillett: | 5.5% (229,423) |
| State: | 5.5% (611,011) |
Number of households with income $10k - 20k:| Gillett: | 6.7% (279,185) |
| State: | 6.7% (743,157) |
Number of households with income $20k - 30k:| Gillett: | 7.2% (301,820) |
| State: | 7.2% (803,381) |
Number of households with income $30k - 40k:| Gillett: | 7.8% (325,337) |
| State: | 7.8% (866,080) |
Number of households with income $40k - 50k:| Gillett: | 7.3% (304,449) |
| Texas: | 7.3% (810,440) |
Number of households with income $50k - 60k:| Gillett: | 7.2% (300,405) |
| State: | 7.2% (799,783) |
Number of households with income $60k - 75k:| Gillett: | 9.9% (411,456) |
| Texas: | 9.9% (1,095,384) |
Number of households with income $75k - 100k:| Gillett: | 12.8% (533,182) |
| State: | 12.8% (1,419,057) |
Number of households with income $100k - 125k:| Gillett: | 9.5% (396,276) |
| State: | 9.5% (1,054,577) |
Number of households with income $125k - 150k:| Gillett: | 6.7% (278,708) |
| State: | 6.7% (741,518) |
Number of households with income $150k - 200k:| Gillett: | 8.7% (361,293) |
| State: | 8.7% (961,776) |
Number of households with income > $200k:| Gillett: | 10.7% (443,666) |
| Texas: | 10.7% (1,181,544) |
Aggregate household income in Gillett in 2022: $3,320,240,917
Median family income in Gillett in 2022:| Gillett: | $91,519 |
| State: | $86,267 |
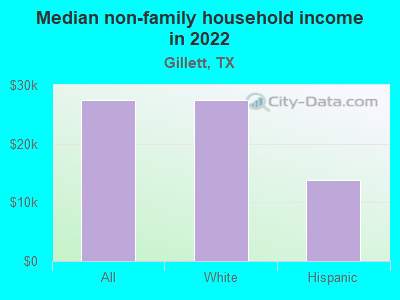
Median non-family income in Gillett in 2022:| Gillett: | $27,389 |
| State: | $45,999 |
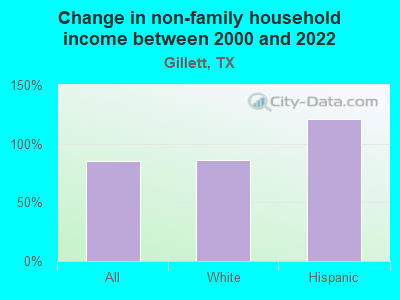
Change in median non-family income between 2000 and 2022:| Gillett, Texas: | +85.2% |
| Texas: | +79.5% |
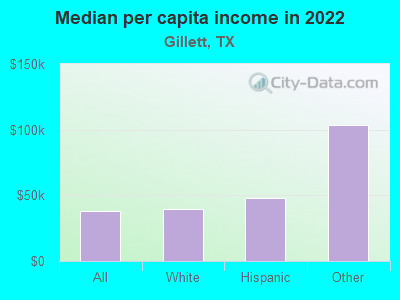
Median per capita income in Gillett in 2022:| Gillett: | $38,009 |
| State: | $38,123 |
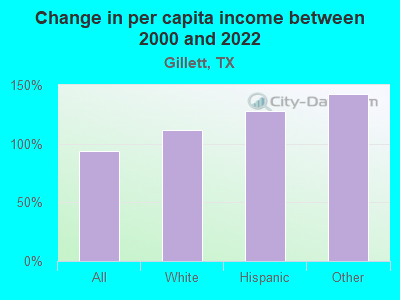
Change in median per capita income between 2000 and 2022:| Gillett, Texas: | +94.2% |
| Texas: | +94.3% |
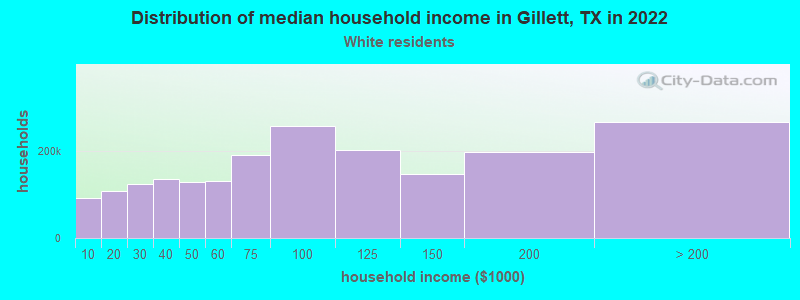
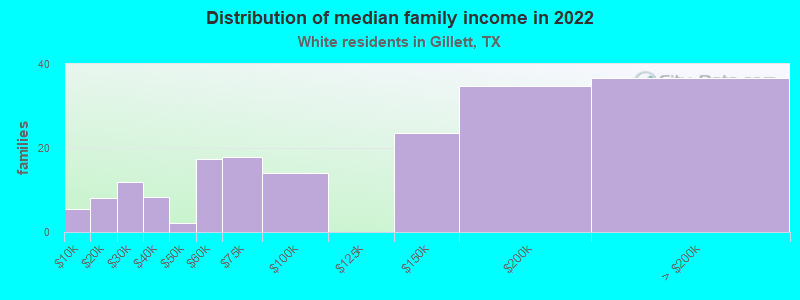
Income statistics for White residents
Median household income in Gillett, TX in 2022:| Gillett: | $55,332 |
| Texas: | $82,032 |
Change in median household income between 2000 and 2022:| Gillett, Texas: | +90.4% |
| State: | +91.0% |
Number of households with income < $10k:| Gillett: | 4.7% (92,340) |
| State: | 4.7% (273,716) |
Number of households with income $10k - 20k:| Gillett: | 5.5% (109,066) |
| State: | 5.5% (322,702) |
Number of households with income $20k - 30k:| Gillett: | 6.2% (123,073) |
| State: | 6.2% (363,947) |
Number of households with income $30k - 40k:| Gillett: | 6.8% (134,903) |
| State: | 6.8% (399,275) |
Number of households with income $40k - 50k:| Gillett: | 6.5% (129,499) |
| Texas: | 6.5% (383,417) |
Number of households with income $50k - 60k:| Gillett: | 6.6% (131,203) |
| State: | 6.6% (388,535) |
Number of households with income $60k - 75k:| Gillett: | 9.6% (190,978) |
| State: | 9.7% (566,295) |
Number of households with income $75k - 100k:| Gillett: | 13.0% (256,642) |
| Texas: | 13.0% (760,276) |
Number of households with income $100k - 125k:| Gillett: | 10.2% (201,731) |
| State: | 10.2% (597,596) |
Number of households with income $125k - 150k:| Gillett: | 7.4% (147,420) |
| Texas: | 7.4% (436,830) |
Number of households with income $150k - 200k:| Gillett: | 9.9% (196,615) |
| Texas: | 9.9% (583,067) |
Number of households with income > $200k:| Gillett: | 13.5% (266,590) |
| Texas: | 13.5% (792,647) |
Aggregate household income in Gillett in 2022: $1,824,124,546
Median family income in Gillett in 2022:| Gillett: | $74,858 |
| State: | $101,788 |
Number of families with income < $10k:| Gillett: | 3.0% (5) |
| State: | 2.8% (108,142) |
Number of families with income $10k - 20k:| Gillett: | 4.5% (8) |
| Texas: | 2.9% (113,421) |
Number of families with income $20k - 30k:| Gillett: | 6.5% (12) |
| State: | 4.1% (157,688) |
Number of families with income $30k - 40k:| Gillett: | 4.7% (8) |
| State: | 5.2% (198,847) |
Number of families with income $40k - 50k:| Gillett: | 1.2% (2) |
| Texas: | 5.6% (216,490) |
Number of families with income $50k - 60k:| Gillett: | 9.6% (17) |
| State: | 5.7% (220,689) |
Number of families with income $60k - 75k:| Gillett: | 9.9% (18) |
| State: | 9.0% (346,106) |
Number of families with income $75k - 100k:| Gillett: | 7.8% (14) |
| State: | 13.7% (527,363) |
Number of families with income $125k - 150k:| Gillett: | 13.1% (24) |
| State: | 9.2% (355,798) |
Number of families with income $150k - 200k:| Gillett: | 19.3% (35) |
| State: | 12.5% (480,185) |
Number of families with income > $200k:| Gillett: | 20.4% (37) |
| State: | 17.6% (677,490) |
Median non-family income in Gillett in 2022:| Gillett: | $27,488 |
| State: | $50,587 |
Change in median non-family income between 2000 and 2022:| Gillett, Texas: | +85.8% |
| State: | +87.7% |
Median per capita income in Gillett in 2022:| Gillett: | $39,311 |
| Texas: | $47,740 |
Change in median per capita income between 2000 and 2022:| Gillett, Texas: | +112.1% |
| Texas: | +114.3% |
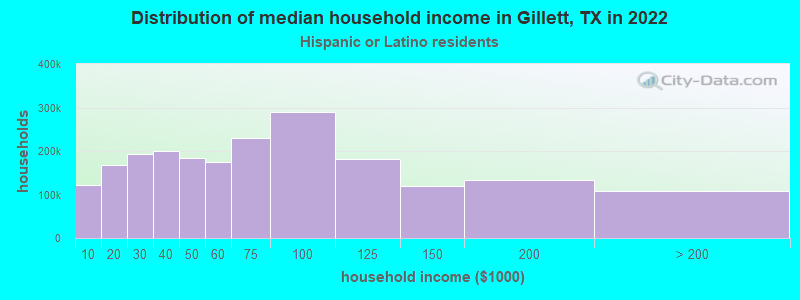
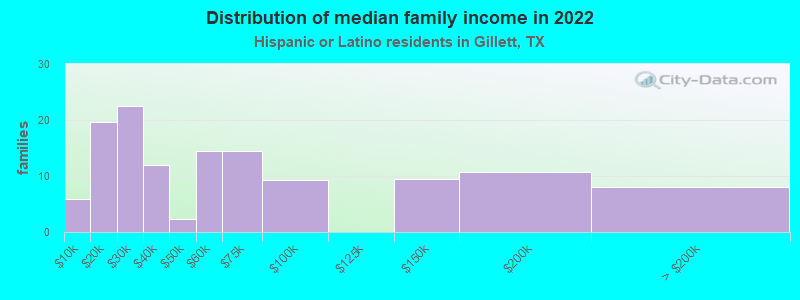
Income statistics for Hispanic or Latino residents
Median household income in Gillett, TX in 2022:| Gillett: | $71,853 |
| State: | $60,504 |
Change in median household income between 2000 and 2022:| Gillett, Texas: | +112.9% |
| State: | +102.5% |
Number of households with income < $10k:| Gillett: | 5.8% (120,994) |
| State: | 5.8% (213,953) |
Number of households with income $10k - 20k:| Gillett: | 8.0% (168,274) |
| State: | 8.0% (297,456) |
Number of households with income $20k - 30k:| Gillett: | 9.2% (192,265) |
| State: | 9.2% (340,166) |
Number of households with income $30k - 40k:| Gillett: | 9.5% (200,456) |
| State: | 9.5% (354,336) |
Number of households with income $40k - 50k:| Gillett: | 8.8% (184,873) |
| State: | 8.8% (327,013) |
Number of households with income $50k - 60k:| Gillett: | 8.3% (174,484) |
| State: | 8.3% (308,818) |
Number of households with income $60k - 75k:| Gillett: | 10.9% (229,090) |
| State: | 10.9% (405,109) |
Number of households with income $75k - 100k:| Gillett: | 13.8% (289,462) |
| State: | 13.8% (511,639) |
Number of households with income $100k - 125k:| Gillett: | 8.6% (180,900) |
| State: | 8.6% (319,728) |
Number of households with income $125k - 150k:| Gillett: | 5.7% (119,447) |
| State: | 5.7% (210,932) |
Number of households with income $150k - 200k:| Gillett: | 6.4% (133,400) |
| State: | 6.4% (236,055) |
Number of households with income > $200k:| Gillett: | 5.1% (107,101) |
| State: | 5.1% (189,259) |
Aggregate household income in Gillett in 2022: $99,149,019
Median family income in Gillett in 2022:| Gillett: | $129,532 |
| Texas: | $65,080 |
Number of families with income < $10k:| Gillett: | 4.6% (6) |
| State: | 5.3% (147,493) |
Number of families with income $10k - 20k:| Gillett: | 15.2% (20) |
| State: | 6.3% (174,531) |
Number of families with income $20k - 30k:| Gillett: | 17.4% (22) |
| State: | 8.6% (238,528) |
Number of families with income $30k - 40k:| Gillett: | 9.3% (12) |
| Texas: | 9.1% (251,999) |
Number of families with income $40k - 50k:| Gillett: | 1.9% (2) |
| Texas: | 8.6% (240,188) |
Number of families with income $50k - 60k:| Gillett: | 11.2% (14) |
| State: | 8.0% (223,566) |
Number of families with income $60k - 75k:| Gillett: | 11.2% (14) |
| Texas: | 10.9% (302,688) |
Number of families with income $75k - 100k:| Gillett: | 7.2% (9) |
| State: | 14.3% (398,554) |
Number of families with income $125k - 150k:| Gillett: | 7.3% (9) |
| State: | 6.2% (171,274) |
Number of families with income $150k - 200k:| Gillett: | 8.4% (11) |
| Texas: | 7.3% (202,259) |
Number of families with income > $200k:| Gillett: | 6.2% (8) |
| Texas: | 5.9% (165,129) |
Median non-family income in Gillett in 2022:| Gillett: | $13,801 |
| State: | $39,934 |
Change in median non-family income between 2000 and 2022:| Gillett, Texas: | +120.8% |
| Texas: | +109.1% |
Median per capita income in Gillett in 2022:| Gillett: | $47,667 |
| Texas: | $24,862 |
Change in median per capita income between 2000 and 2022:| Gillett, Texas: | +128.5% |
| State: | +130.8% |
Income statistics for other residents
Number of households with income < $10k:| Gillett: | 5.7% (14) |
| Texas: | 5.9% (54,162) |
Number of households with income $10k - 20k:| Gillett: | 6.6% (16) |
| State: | 6.8% (62,891) |
Number of households with income $20k - 30k:| Gillett: | 10.7% (26) |
| Texas: | 10.6% (97,294) |
Number of households with income $30k - 40k:| Gillett: | 10.7% (26) |
| Texas: | 10.8% (99,670) |
Number of households with income $40k - 50k:| Gillett: | 9.4% (23) |
| Texas: | 9.3% (85,548) |
Number of households with income $50k - 60k:| Gillett: | 9.0% (22) |
| State: | 9.0% (82,757) |
Number of households with income $60k - 75k:| Gillett: | 11.1% (27) |
| State: | 10.9% (100,326) |
Number of households with income $75k - 100k:| Gillett: | 13.9% (34) |
| Texas: | 14.0% (128,767) |
Number of households with income $100k - 125k:| Gillett: | 8.2% (20) |
| Texas: | 8.2% (75,218) |
Number of households with income $125k - 150k:| Gillett: | 4.9% (12) |
| Texas: | 4.8% (44,223) |
Number of households with income $150k - 200k:| Gillett: | 5.7% (14) |
| State: | 5.6% (51,376) |
Number of households with income > $200k:| Gillett: | 4.1% (10) |
| Texas: | 4.0% (36,393) |
Aggregate household income in Gillett in 2022: $18,048,889
Median family income in Gillett in 2022:| Gillett: | $372,125 |
| State: | $60,064 |
Number of families with income $150k - 200k:| Gillett: | 100.0% (98) |
| Texas: | 5.9% (41,211) |
Median per capita income in Gillett in 2022:| Gillett: | $103,250 |
| State: | $23,899 |
Change in median per capita income between 2000 and 2022:| Gillett, Texas: | +141.8% |
| State: | +135.2% |